Abstract
Tumour-specific CD8 T cells in solid tumours are dysfunctional, allowing tumours to progress. The epigenetic regulation of T cell dysfunction and therapeutic reprogrammability (for example, to immune checkpoint blockade) is not well understood. Here we show that T cells in mouse tumours differentiate through two discrete chromatin states: a plastic dysfunctional state from which T cells can be rescued, and a fixed dysfunctional state in which the cells are resistant to reprogramming. We identified surface markers associated with each chromatin state that distinguished reprogrammable from non-reprogrammable PD1hi dysfunctional T cells within heterogeneous T cell populations from tumours in mice; these surface markers were also expressed on human PD1hi tumour-infiltrating CD8 T cells. Our study has important implications for cancer immunotherapy as we define key transcription factors and epigenetic programs underlying T cell dysfunction and surface markers that predict therapeutic reprogrammability.
Introduction
Tumor-specific CD8 T cells (TST) are often found within solid tumors, but tumors progress despite their presence, suggesting that these TST are dysfunctional1. The clinical success of immune checkpoint blockade (e.g. PD1/PDL1, CTLA4 blocking antibodies) and adoptive T cell therapy in a subset of cancer patients demonstrates the great potential of TST2; however, important questions remain, including how to predict which patients will respond to therapy and precisely which TST mediate clinical responses3–5. Moreover, an unmet need is the development of interventions for tumors refractory to checkpoint blockade despite having ample TST infiltration.
We previously demonstrated that early during tumorigenesis, TST become non-responsive, exhibiting the phenotypic, functional, and transcriptional features of tumor-reactive tumor-infiltrating lymphocytes (TIL) from late-stage human solid tumors6. TST dysfunction is initially reversible but ultimately becomes irreversible, even after removal of dysfunctional T cells from the tumor microenvironment and multiple rounds of cell division6. We hypothesized that this heritable, signal-independent dysfunctional state is epigenetically imprinted. The epigenetic programs that regulate normal differentiation of innate and adaptive lymphocytes have been described7–10. However, the epigenetic programs regulating T cell differentiation and dysfunction in tumors are not known. In this study, we used the “Assay for Transposase Accessible Chromatin using Sequencing” (ATAC-Seq)11 to assess genome-wide chromatin accessibility changes during T cell differentiation in tumors compared to acute infection.
CD8 T cell chromatin changes during infection
We transferred congenically-marked naïve (N; CD44lo CD62Lhi) TCRTAG from TCRTAG transgenic mice (specific for SV40 large T antigen epitope I (TAG))12 into wild-type C57BL/6 mice, which were immunized one day later with recombinant Listeria monocytogenes strain expressing TAG (LmTAG)6,13. TCRTAG were re-isolated, phenotypically and functionally characterized, and subjected to ATAC-Seq and RNA-Seq at 5, 7 (effectors; E5, E7) and 60+ days (memory; M) after immunization (Fig. 1a). N, E5, E7 and M expressed characteristic activation, homing and cytokine receptors (CD44, CD62L, IL7R), transcription factors (TFs) (TBET), cytotoxic molecules (GZMB, CD107), and pro-inflammatory cytokines (IFN-γ and TNF-α) (Extended Data Fig. 1).
Figure 1. CD8 T cell chromatin state dynamics during acute infection.
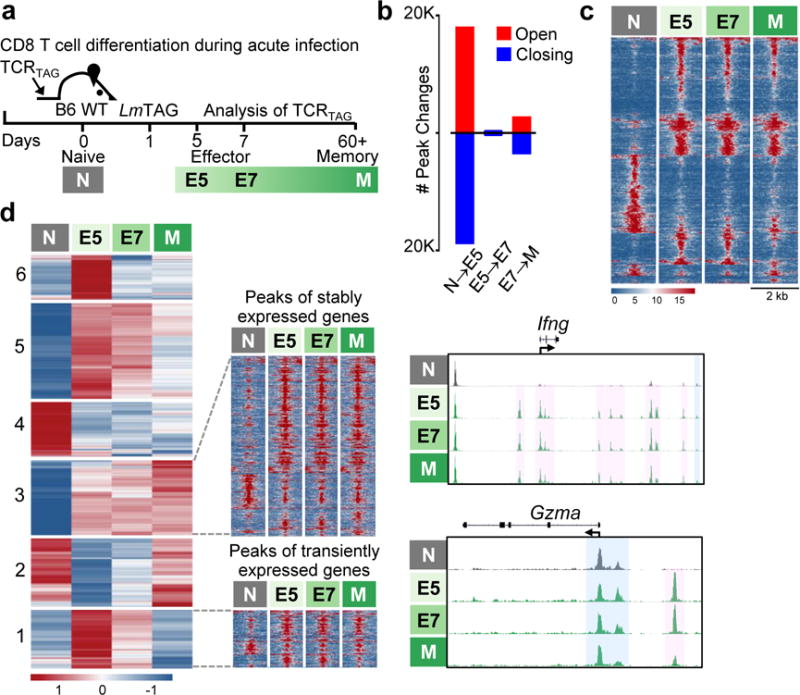
a, Experimental scheme. b, Number of chromatin peak accessibility changes during each transition (FDR<0.05). c, Chromatin accessibility heatmap grouped by differential accessibility patterns. Each row represents one of 8654 selected peaks (differentially accessible between at least one sequential cell comparison; FDR <0.05, |log2FC|>2). d, (Left) K-means clustered (K = 6, row-normalized) RNA-Seq data for 1758 differentially expressed genes (|log2FC|>1, FDR<0.05, base mean log2 expression≥10.) (Middle) Heatmap of differentially accessible peaks (FDR<0.05, |log2FC|>1) presented as in (c) for genes in K-means clusters 1 and 3. (Right) ATAC-Seq signal profiles across Ifng and Gzma loci. Peaks present in all differentiation states highlighted in blue, activation-induced peaks in pink.
ATAC-Seq libraries generated from N, E5, E7, and M showed the expected distribution of fragment lengths (Extended Data Fig. 2). Using DESeq214 to assess differential chromatin accessibility, we found that dramatic chromatin remodeling occurred as N differentiated to the effector state (E5), with much less remodeling from E5 to E7 and E7 to M (Fig. 1b, c, and Extended Data Fig. 3a). In N, effector gene loci such as Prf1 and Tnf shared highly accessible chromatin and basal transcriptional activity with E5/E7 and M (Extended Data Fig. 3b), consistent with activating histone marks previously shown at these loci in naïve T cells15,16.
We analyzed accessibility changes during the N to E5 transition in loci associated with early and late TCR-response genes as defined by the Immunological Genome Project17. Early-response genes showed much fewer changes compared to late-response genes (Extended Data Fig. 3c). For example, Ldha, (encoding LDHA, needed for the metabolic shift to aerobic glycolysis and IFNγ production18), and Mki67 (encoding KI67, required for chromosome segregation during mitosis19), require no change in chromatin accessibility to be rapidly induced after TCR stimulation (Extended Data Fig. 3d).
Memory T cells exhibit more rapid and robust effector function upon antigen re-encounter compared to naïve T cells20. K-means clustering of RNA expression patterns (Fig. 1d, left) revealed two trends: transient gene activation or down-regulation in E5/E7 but not M (clusters 1, 2, 5, 6), and stable gene activation or down-regulation in E5, E7, and M (clusters 3 and 4). In contrast, chromatin accessibility for these loci was largely similar in E5/E7 and M (Fig. 1d, middle). Thus, the “effector-like” accessibility in M permits basal transcription of certain effector genes (cluster 3) such as Ifng, while other genes are transcriptionally silent but poised for rapid re-expression upon TCR activation (cluster 1, Gzma) (Fig. 1d, right).
Chromatin state dynamics of TST dysfunction
We next assessed chromatin state dynamics in TST over the course of tumorigenesis using the previously described tamoxifen (Tam)-inducible, autochthonous liver cancer model (ASTxCre-ERT2; Cre-ERT2 = Tam-dependent Cre-recombinase) in which TAG is a tumor-specific antigen6. ASTxCre-ERT2 mice initially develop pre-malignant lesions which eventually progress into hepatocellular carcinoma (HCC; by day 60–90)6. We transferred congenically-marked naïve TCRTAG (N, identical to N in Fig. 1a) into ASTxCre-ERT2 mice 1 day prior to Tam and then analyzed TCRTAG at different time points (Fig. 2a). Liver-infiltrating TCRTAG downregulated CD62L, uniformly expressed activation markers CD44 and inhibitory receptors PD1 and LAG3, and failed to produce IFNγ or TNFα (Fig. 2b). Massive chromatin remodeling occurred by day 5, followed by a second wave of remodeling between days 7 and 14 (Fig. 2c, d and Extended Data Fig. 4a). Strikingly, after the second wave, few accessibility changes occurred, even after progression to established tumors at day 60+ (Fig. 2c, d, e). Thus, TST differentiated through two discrete chromatin states: an initial dysfunctional state 1 (L5, L7), and later dysfunctional state 2, established by day 14 and persisting thereafter. Many of the ATAC-Seq peaks gained or lost were in intronic and intergenic regions (potential enhancer peaks), while peaks present in all CD8 T cells were in promoter regions (Extended Data Fig. 4b, bottom); this pattern was also seen in functional CD8 T cell differentiation (Extended Data Fig. 4b, top).
Figure 2. TST differentiate to dysfunctionality in developing tumors through discrete chromatin states.
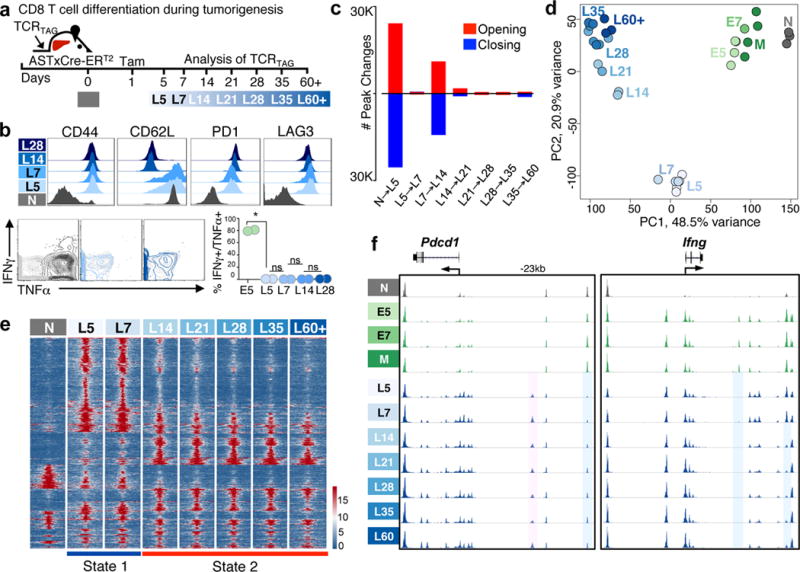
a, Experimental scheme. b, Immunophenotype and cytokine production (grey, no peptide control) (n=8 total, with n=2 per time point). Each symbol represents individual mouse. Representative of 5 independent experiments; mean ± s.e.m shown. *P=0.0002 (Student’s t-test); n.s. = not statistically significant. c, Number of peak changes during each transition (FDR<0.05). d, Principal component analysis (PCA) of peak accessibility in naïve TCRTAG (N; grey) during normal differentiation (green) and during tumorigenesis (blue). Each symbol represents single biological replicate. e, Chromatin accessibility heatmap (15,275 differentially accessible peaks as in Fig. 1c). f, ATAC-Seq signal profiles across Pdcd1 and Ifng loci. Peaks uniquely lost (blue) or gained (pink) in TST.
TCRTAG in malignant lesions followed a distinct epigenetic trajectory compared to TCRTAG in acute infection (L5 versus E5; Fig. 2d), and many peak changes were unique to either the early dysfunctional (L5) or functional (E5) state (Extended Data Fig. 4c) and included TCR signaling and cytokine production pathway genes (Extended Data Fig. 4d). Enhancer peaks in the Ifng locus that opened during normal effector differentiation were inaccessible in dysfunctional TCRTAG (Fig. 2f, right). An intergenic peak near (−23.8 kb) the Pdcd1 (PD1-encoding) locus was uniquely accessible in L5 to L60+ but not in E5/E7 and M (Fig. 2f, left); a similar peak was described in exhausted T cells in chronic viral infection21–23. We tested whether accessibility of potential TF targets changed preferentially during differentiation from N to L5 as compared to N to E5 (Extended Data Fig. 5a). Predicted NFATC1 binding sites, including those in genes encoding inhibitory receptors and negative regulators such as Ctla4, Pdcd1, Tigit, Socs1, and Cblb and TF Egr1 and Egr2, had increased peak accessibility in dysfunctional L5 (Extended Data Fig. 5a, b). NFAT TF family members, particularly NFATC1 and NFATC2, are important regulators of T cell development and function (reviewed in24), as well as exhaustion in chronic viral infections25. While some genes with increased NFATC1 peak accessibility in L5 showed immediate transient transcriptional activation, others were activated later (Extended Data Fig. 5c). TF footprints could be identified for NFATC1 as well as other TFs (Extended Data Fig. 6a).
Chromatin states are associated with reprogrammability
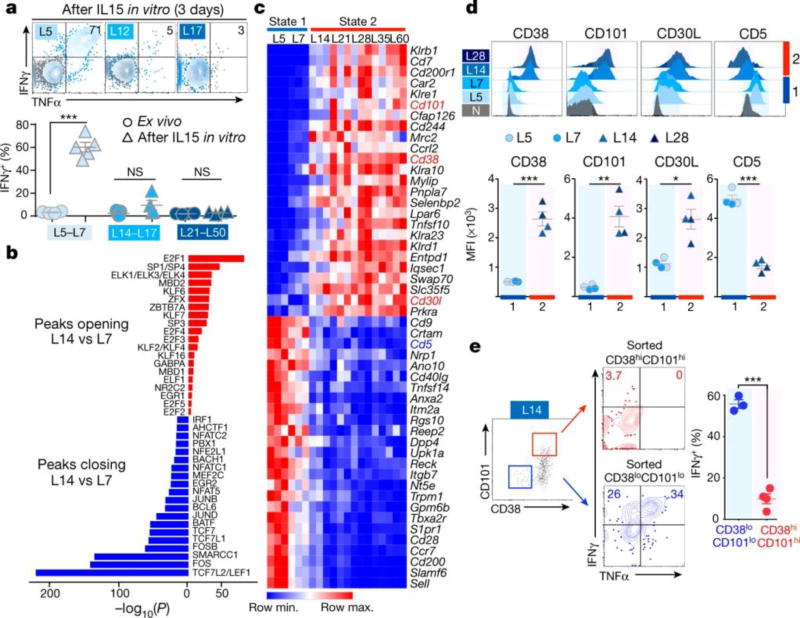
Intriguingly, the discrete chromatin states in dysfunctional TCRTAG correlated temporally with our previous observation that L8 but not L35 were capable of regaining effector function6. Indeed, when we re-isolated TCRTAG from liver lesions and cultured them in vitro with IL15 (Fig. 3a), previously shown to induce proliferation and restore effector function in tumor-reactive CD8 T cells26,27, L5 and L7 regained the ability to produce IFNγ and TNFα, but TCRTAG isolated at day 12 and after did not (Fig. 3a). Thus state 1 dysfunction is plastic, but with further chromatin remodeling between days 7 and 14, becomes fixed (state 2).
Figure 3. Discrete chromatin states correlate with reprogrammability and surface protein expression profiles.
a, (top) Cytokine production by L5, L12, and L17 after 3 days in vitro IL-15 culture (grey, no peptide control); (bottom) IFNγ production straight ex vivo (circles) or after 3–4 days IL-15 in vitro culture (triangles). Pooled from 3 experiments. b, Top 20 most-significantly enriched TF motifs in peaks opening (red) and closing (blue) between L7 and L14. c, RNA-Seq expression (row-normalized) for most differentially-expressed genes encoding membrane proteins. d, CD38, CD101, CD30L and CD5 expression. Representative of 3 independent experiments. e, Cytokine production by sorted CD38lo/CD101lo (blue) and CD38hi/CD101hi (red) L14 after 3 days IL-15 in vitro culture. Similar data obtained with sorted L10 in independent experiment. (a, d, e) Each symbol represents individual mouse. Mean ± s.e.m. shown; *P=0.005, **P=0.0005, ***P≤0.0001 (Student’s t-test).
Chromatin peaks with TCF family motifs closed during the state 1 (L7) to state 2 (L14) transition, while E2F, ETS, and KLF family TF motif-containing peaks opened (Fig. 3b). Indeed, TCF1 (encoded by Tcf7) protein levels decreased between L7 and L14 (Extended Data Fig. 6b), and analysis of closing peaks showed enrichment for WNT receptor signaling pathway genes, upstream of TCF family TFs, as well as cytokine response, TCR signaling, and T cell differentiation pathway genes (Extended Data Fig. 6c). Among the TCR signaling genes most up-regulated during the L7-L14 transition were negative regulators such as Cish1 and Socs2, while co-stimulatory molecule genes such as Icos and Cd28 were down-regulated together with closing of multiple peaks within their loci (Extended Data Fig. 6d).
We next used an in vivo pharmacologic strategy to test the role of NFAT and TCF in TST dysfunction. FK506 is an immunosuppressant that inhibits NFAT nuclear translocation and downstream gene activation28,29, and we used 25% of the full immunosuppression dose to partially downregulate NFAT activity without completely blocking T cell activation/effector function. TWS119, a GSK3β inhibitor, enhances CD8 memory differentiation through WNT/TCF1 activation30, so we treated TCRTAG-adoptively transferred ASTxCre-ERT2 mice with FK506 alone or in combination with TWS119 (Extended Data Fig. 7a). Indeed, L10 TST from FK506 and FK506/TWS119-treated mice had decreased expression of NFATC1-targets PD1 and LAG3, increased levels of TCF1 and EOMES (Extended Data Fig. 7b), and were more efficiently reprogrammable (Extended Data Fig. 7c) compared to controls or TWS119 alone (data not shown).
Surface proteins associated with chromatin states
We then looked for cell surface proteins whose expression correlated with chromatin states 1 or 2 and thus might predict reprogrammability of heterogeneous TIL. PD1 and LAG3 were similarly expressed by both plastic (L5, L7) and fixed (L14+) dysfunctional TST (Fig. 2b) and thus not informative in this regard. We identified membrane protein genes differentially expressed between early (L5, L7) and late (L14 to L60+) dysfunctional TCRTAG (Fig. 3c) and found several markers not previously associated with tumor-induced T cell dysfunction. State 1 (L5, L7) TCRTAG had low expression of CD38, CD101, and CD30L and high expression of CD5, while state 2 (L14, L28) TCRTAG had the opposite pattern (Fig. 3d). Consistent with its expression, the Cd38 locus contained intergenic and intronic peaks uniquely accessible in state 2 TST (Extended Data Fig. 8a). TCF1 downregulation coincided with CD38 upregulation (Extended Data Fig. 8b), and other key regulators of CD8 T cell differentiation such as IRF4 and BCL2 showed a similar binary expression in early and late TST (Extended Data Fig. 8c). Moreover, TCRTAG from FK506 and FK506/TWS119-treated mice expressed low CD38 and CD101 compared to controls, correlating with their improved reprogrammability (Extended Data Fig. 7d). To test whether these markers could identify reprogrammable T cells within a heterogeneous TST population, we sorted CD38lo/CD101lo and CD38hi/CD101hi TST in L14 populations and assessed reprogrammability (3 days in vitro IL-15). While CD38lo/CD101lo- L14 regained the ability to produce IFNγ and TNFα, CD38 hi/CD101hi- L14 did not (Fig. 3e).
We asked whether these findings could be applied to other tumor histologies and/or T cell specificities by utilizing murine B16F10 (B16) melanoma expressing ovalbumin (B16-OVA), a model antigen recognized by OVA-specific OT1 CD8 T cells (TCROT1). Naïve congenically-marked TCROT1 were adoptively transferred into B16-OVA tumor-bearing B6 mice. Tumor-infiltrating TCROT1 upregulated CD44, PD1, and LAG3, downregulated CD62L, and lost the ability to produce IFNγ or TNFα (Extended Data Fig. 8d). Later dysfunctional TCROT1 expressed high levels of CD38, CD101 and downregulated CD5 compared to early dysfunctional D5-TCROT1 (Extended Data Fig. 8e). Moreover, late dysfunctional D21-TCROT1 could not regain the ability to produce IFNγ or TNFα, in contrast to early dysfunctional D5-TCROT1 (Extended Data Fig. 8f).
Memory T cells enter state 2 dysfunction in tumors
We next tested if the “functionally-poised” chromatin state present in memory T cells (M; Fig. 1) could prevent them from becoming dysfunctional in tumors. M (TCRTAG) were transferred into ASTxAlb:Cre mice6 bearing established HCC and one day later immunized with LmTAG (Fig. 4a). By day 7, tumor-infiltrating M (ML7) rapidly upregulated PD1 and LAG3 and progressively lost effector function (Fig. 4b and Extended Data Fig. 9a). ATAC-Seq revealed that M followed a similar epigenetic trajectory as N in early malignant lesions (Fig. 4c and Extended Data Fig. 9b-d), and remarkably, by day 35, the chromatin state of transferred M was nearly identical to that of N at day 35 in early malignant lesions (ML35 and L35; Fig. 4d). Dysfunctional M displayed the same gain and loss of ATAC-Seq peaks in critical gene loci including Pdcd1, Ctla4, Cd38, Tcf7, and Ifng (Extended Data Fig. 9e). Changes in surface protein expression (CD38, CD101, CD30L, and CD5) between ML7 and ML14 were like those seen with N (L7 and L14, respectively) (Extended Data Fig. 9f). We obtained similar results when LmTAG immunization after adoptive transfer was omitted (Extended Data Fig. 9b–d).
Figure 4. Memory TST rapidly enter the fixed dysfunctional chromatin state in established tumors.

a, Experimental scheme. b, Cytokine production of M isolated from liver tumors. c, PCA of peak accessibility in TCRTAG during acute infection (green), tumorigenesis (blue), and memory TCRTAG in established tumors (red). d, Chromatin accessibility heatmap showing M, M re-isolated at D35 from established HCC tumors (ML35), and naïve TCRTAG isolated at day 35 (L35) from early malignant lesions (see Fig. 2). Each row represents one of 19,679 differentially accessible peaks as in Fig. 1c.
Chromatin accessibility in human TIL
Finally, we examined chromatin states of human CD8 tumor-infiltrating lymphocytes (TIL) and peripheral blood lymphocytes (PBL) from healthy donors. We carried out ATAC-Seq on naïve (N; CD45RA+ CD45RO-), effector memory (EM; CD45RA- CD45RO+ CD62Llo) and central memory (CM; CD45RA- CD45RO+ CD62Lhi) CD8 PBL from healthy donors and PD1hi CD8 TIL isolated from human melanoma and non-small cell lung tumors (NSCLC) (Extended Data Fig. 10a). Human N had a distinct chromatin state as compared to EM and CM, which were similar (Fig. 5a and Extended Data Fig. 10b) though distinct accessibility patterns in genes such as SELL (encoding CD62L) distinguished all three states (Extended Data Fig. 10c). PD1hi TIL uniquely gained and lost multiple peaks, for example in IFNG, EGR2, CD5, and CTLA4 (Extended Data Fig. 10d). We compared the non-promoter peak changes that occurred during functional and dysfunctional mouse CD8 T cell differentiation with those observed in human PBL and PD1hi TIL and found that human PD1hi TIL had the greatest overlap in peak accessibility changes with fixed dysfunctional (state 2) murine TST (Fig. 5b). For example, the TCF7/Tcf7 locus showed similar intergenic and intronic peak accessibility changes in human PD1hi TIL and murine state 2 TCRTAG (Fig. 5c). A subset of PD1hi TIL expressed higher levels of CD38 /CD101 and lower levels of CD5 (Fig. 5d), suggesting that these markers could potentially be used to identify T cells amenable to therapeutic reprogramming in human tumors.
Figure 5. Human tumor-infiltrating PD1-high CD8 T cells enter a similar chromatin accessibility state as murine fixed dysfunctional TST.
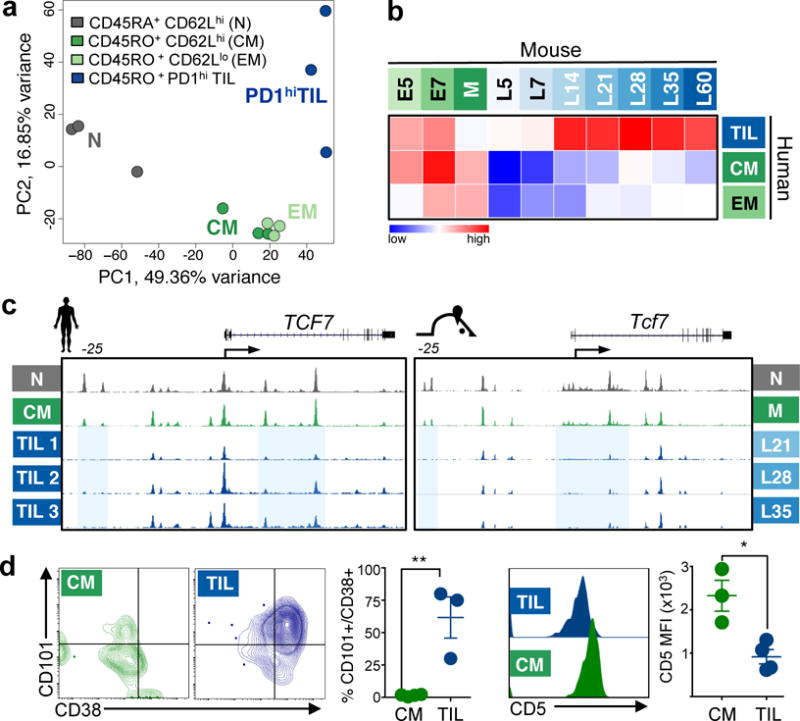
a, Peak accessibility PCA on human healthy donor PBL and PD1hi TIL from melanoma and NSCLC tumors. b, For non-promoter peaks, normalized Spearman correlations of log2FC calculated between human N and EM, CM or PD1hi TIL versus log2FC between murine N and E5, E7, M, and L5 to L60. P<10−16 for all comparisons between human PD1hi TIL and mouse L14 - L60. c, ATAC-Seq signal profiles across human TCF7 and mouse Tcf7 gene loci; peaks ost in human PD1hi TIL and mouse L21, L28, L35 highlighted in blue. d, CD38, CD101 and CD5 expression on human CM (green) and PD1hi TIL (blue). Each symbol represents individual healthy donor or patient. Mean ± s.e.m. shown; *P=0.01, **P=0.006 (Student’s t-test).
Discussion
In this study, we define for the first time the chromatin state dynamics underlying tumor-specific T cell dysfunction over the course of tumorigenesis. Naïve TST encountering tumor antigen in pre-malignant lesions differentiated to an initially plastic, therapeutically reprogrammable chromatin state, then transitioned to a fixed dysfunctional chromatin state that did not undergo further remodeling, even with progression to large established tumors (Extended Data Fig. 10e). The rapid induction of dysfunction early during tumorigenesis without progression through an effector state resembles peripheral tolerance induction31,32. We identified core elements shared between murine fixed dysfunctional TST and human PD1hi TIL. Surprisingly, memory TST differentiated to the same fixed dysfunctional chromatin state in tumors, suggesting that antigen exposure in tumors can overwrite pre-existing epigenetic programs regardless of the initial differentiation state.
We identified surface markers, including CD101 and CD38, which were associated with discrete dysfunctional chromatin states and demarcated reprogrammable from non-reprogrammable PD1hi T cells within heterogeneous TIL populations, a finding of important potential clinical relevance, and human PD1hi TIL showed heterogeneous expression of these markers. In patients who do not respond to immune checkpoint blockade (non-responders), PD1hi TIL may be in a fixed dysfunctional state, in contrast to responders whose PD1hi TIL are in a plastic state, amenable to reprogramming. Our studies on the epigenetic and transcriptional programs underlying TST dysfunctional states and therapeutic reprogrammability point to new targets and strategies to transform TST into potent anti-tumor agents.
METHODS
Mice
TCRTAG transgenic mice (B6.Cg-Tg(TcraY1,TcrbY1)416Tev/J)12, Cre-ERT2 (B6.129-Gt(ROSA)26Sortm1(cre/ERT2)Tyj/J), Alb:Cre (B6.Cg-Tg(Alb-cre)21Mgn/J), TCR-OT1 (C57BL/6-Tg(TcraTcrb)1100Mjb/J), Ly5.1 (B6.SJL-Ptprca Pepcb/BoyJ), and C57BL/6J Thy1.1 mice were purchased from The Jackson Laboratory. TCRTAG mice were crossed to Thy.1.1 mice to generate TCRTAG Thy.1.1 mice. TCR-OT1 were crossed to Ly5.1 mice to generate TCR-OT1 Ly5.1 mice. AST [Albumin-floxStop-SV40 large T antigen (TAG)]33 were crossed to Cre-ERT2 or Alb:Cre mice to obtain ASTxCre-ERT2 and ASTxAlb:Cre mice respectively6. Both female and male mice were used for studies. Mice were age- and sex-matched and between 1.5 - 3 months old when used for experiments. Animals were assigned randomly to experimental groups. All mice were bred and maintained in the animal facility at Memorial Sloan Kettering Cancer Center (MSKCC). Experiments were performed in compliance with the MSKCC Institutional Animal Care and Use Committee (IACUC) regulations.
Antibodies and reagents
Fluorochrome-conjugated antibodies were purchased from BD Biosciences, eBioscience, Biolegend, and Cell Signaling Technology. Tamoxifen (Sigma) stock solution was prepared by warming tamoxifen in 1ml sterile corn oil at 50°C for 15 minutes, then further diluted in corn oil to obtain the stock concentration (5mg/ml in corn oil). A single dose of tamoxifen (1 mg) was administered intraperitoneally (i.p.) into ASTxCre-ERT2 mice.
Intracellular cytokine staining
Intracellular cytokine staining was performed using the Cytofix/Cytoperm Plus kit (BD Biosciences) per the manufacturer’s instructions. Briefly, T cells were mixed with 2×10⁶ congenically-marked splenocytes and incubated with Tag-I peptide (0.5 μg/ml) or OVA peptide (0.1 μg/ml) for 4–5 hours at 37°C in the presence of GolgiPlug (brefeldin A). After staining for cell-surface molecules, the cells were fixed, permeabilized, and stained with antibodies to IFN-γ (XMG1.2) and TNF-α (MP6-XT22).
Flow cytometric analysis
Flow cytometric analysis was performed using Fortessa and LSR FACS analyzers (BD Biosciences, San Jose, CA); cells were sorted using BD FACS Aria (BD Biosciences, San Jose, CA) at the MSKCC Flow Core Facility. Flow data were analyzed with FlowJo v. 10 software (Tree Star Inc, Ashland, OR).
Listeria infection
The Listeria monocytogenes (Lm) ΔactA ΔinlB strain13 expressing the Tag-I epitope (SAINNYAQKL, SV40 large T antigen206-215) was generated by Aduro Biotech as previously described34. Experimental vaccination stocks were prepared by growing bacteria to early stationary phase, washing in phosphate buffered saline, formulated at approximately 1×10¹⁰ colony forming units (cfu)/ml, and stored at −80°C. Mice were infected i.p. with 5×10⁶ cfu of LmTAG.
Adoptive T cell transfer
For the generation of effector and memory TCRTAG CD8+ T cells, 105 CD8+ splenocytes from TCRTAG Thy1.1 transgenic mice were adoptively transferred into B6 (Thy1.2) mice; one day later, mice were infected with 5×10⁶ cfu LmTAG. Effector TCRTAG CD8+ T cells were isolated from the spleens of B6 host mice and analyzed 5 or 7 days post LmTAG immunization; memory TCRTAG CD8+ T cells were isolated from spleens of B6 host mice and analyzed at least 2–3 months post LmTAG immunization. For the transfer of naïve TCRTAG T cells into ASTxCre-ERT2 mice, 1×10⁵ – 2.5×10⁶ CD8+ splenocytes from TCRTAG Thy1.1 transgenic mice were adoptively transferred into ASTxCre-ERT2 mice; 1 day later, mice were treated with 1mg tamoxifen and donor T cells isolated for subsequent analyses. For memory TCRTAG transfer experiments 3–4×10⁴ TCRTAG Thy1.1+ CD44hi, CD62Lhi sorted central memory CD8 T cells were adoptively transferred into ASTxAlb:Cre mice; one day later, mice were infected with 5×10⁶ cfu LmTAG (105 central memory T cells were sorted and transferred for experiments without subsequent listeria immunization).
B16-OVA tumor model
5×10⁵ – 1×10⁶ B16 tumor cells expressing OVA (full-length or cytosolic as previously described35) were injected into C57BL/6J wild-type mice. Once tumors were established (1–2 weeks later) naïve Ly5.1 congenically-marked TCROT1 CD8 T cells were adoptively transferred and isolated from tumors at indicated time points. Tumor volumes did not exceed the permitted volumes specified by the MSKCC IACUC protocol. The B16 cell line was obtained from ATCC. It was tested negative for all rodent pathogens including Mycoplasma pulmonis.
Cell isolation for subsequent analyses
Spleens were mechanically disrupted with the back of a 3-ml syringe, filtered through a 70-μm strainer, and red blood cells (RBC) were lysed with ammonium chloride potassium buffer. Cells were washed twice with cold RPMI 1640 media supplemented with 2μM glutamine, 100U/ml penicillin/streptomycin, and 5–10% FCS (cRPMI). Liver tissue was mechanically disrupted to a single cell suspension using a 150 μ metal mesh and glass pestle in ice-cold 3% FCS/HBSS and passed through a 70 μm strainer. The liver homogenate was spun down at 400 g × 5 minutes at 4°C, and the pellet was resuspended in 30ml 3% FCS/HBSS, 500ul (500U) heparin, and 17ml Percoll (GE), mixed by inversion, and spun at 500 g × 10 min at 4°C. Pellet was lysed with ammonium chloride potassium buffer and cells were further processed for downstream applications.
IL15 in vitro culture
TCRTAG or TCROTI were isolated from tumors at various time points post transfer and cultured in vitro in the presence of IL15 (100ng/ml) in cRPMI for 3–4 days.
Pharmacologic rescue studies
Naïve TCRTAG (Thy1.1+) were transferred into ASTxCre-ERT2 (Thy1.2+) mice which were treated with tamoxifen one day later. On days 2–9 mice were treated with the calcineurin inhibitor FK506 (Prograf, 5 mg/ml) (2.5mg/kg/mouse i.p. once daily) alone, or in combination with the GSK3β inhibitor TWS119 (Sigma; 0.75mg/mouse i.p. once daily; days 5–8). Control mice were treated with PBS and/or DMSO.
Human samples
Human tumor samples and healthy donor peripheral blood lymphocytes were obtained as per protocols approved by the MSKCC Institutional Review Board (IRB), and all patient and healthy donors provided informed consent. Peripheral blood lymphocytes were flow-sorted for naïve, effector memory-like and central memory-like phenotypes as described in Extended Data Fig. 10a. Human melanoma and lung tumors were mechanically disrupted as described for solid murine tumors, and CD45RO+ PDhi CD8+ T cells were flow-sorted for subsequent ATAC-Seq analysis.
Statistical analyses
Statistical analyses on flow cytometric data were performed using unpaired two‐tailed Student’s t tests (Prism 6.0, GraphPad Software). A P value of <0.05 was considered statistically significant.
Sample preparation for ATAC-Seq and RNA-Seq
Mouse samples
Replicate samples were isolated from spleens or livers and sorted as follows:
Naïve TCRTAG Thy1.1+ T cells were sorted by flow cytometry (CD8+/CD44lo) from spleens of TCRTAGThy1.1 transgenic mice.
D5 and D7 effector, and memory TCRTAG Thy1.1+ T cells were sorted by flow cytometry (CD8+/Thy1.1+) from spleens of infected B6 (Thy1.2) host mice (see above) 5 and 7 days, or 2–3 months post listeria infection.
TCRTAGThy1.1+ T cells from pre-/early malignant liver lesions: naïve TCRTAG Thy1.1+ T cells were adoptively transferred into ASTxCre-ERT2 mice. 1 day later, mice were given 1mg tamoxifen i.p. At given time points post tamoxifen treatment, T cells were isolated and sorted (CD8+/Thy1.1+) from livers as described above.
TCRTAG Thy1.1+ memory T cells from established hepatocellular carcinomas in ASTxAlb:Cre mice: TCRTAG memory T cells were isolated from tumors and flow sorted (CD8+/Thy1.1+) as described above.
Human samples
Samples were flow-sorted as described in Extended Data Fig. 10a.
After flow-sorting, all samples for downstream ATAC-Seq analysis were frozen in 10% DMSO/FCS and stored at −80°C; samples for RNA-seq were directly sorted into Trizol and frozen and stored at −80°C.
Transcriptome Sequencing
RNA from sorted cells was extracted using RNeasy mini kit (Qiagen) per instructions provided by the manufacturer. After ribogreen quantification and quality control of Agilent BioAnalyzer, 6–15 ng of total RNA underwent amplification (12 cycles) using the SMART-seq V4 (Clontech) ultralow input RNA kit for sequencing. 10ng of amplified cDNA was used to prepare Illumina hiseq libraries with the Kapa DNA library preparation chemistry (Kapa Biosystems) using 8 cycles of PCR. Samples were barcoded and run on a Hiseq 2500 1T in a 50bp/50bp Paired end run, using the TruSeq SBS Kit v3 (Illumina). An average of 51 million paired reads were generated per sample and the percent of mRNA bases was 62.5% on average.
ATAC Sequencing
Chromatin profiling was performed by ATAC-Seq as described previously11. Briefly, 12,000 to 50,000 cells were washed in cold PBS and lysed. Transposition was performed at 42°C for 45 min. After purification of the DNA with the MinElute PCR purification kit (Qiagen), material was amplified for 5 cycles. Additional PCR cycles were evaluated by real time PCR. Final product was cleaned by Ampure Beads at a 1.5× ratio. Libraries were sequenced on a Hiseq 2500 1T in a 50bp/50bp Paired end run, using the TruSeq SBS Kit v3 (Illumina). An average of 47×106 paired reads were generated per sample.
ATAC data and preprocessing
Raw ATAC-Seq reads were trimmed and filtered for quality using Trim Galore! v0.4.0 (http://www.bioinformatics.babraham.ac.uk/projects/trim_galore/), powered by CutAdapt v1.8.1 (http://dx.doi.org/10.14806/ej.17.1.200) and FastQC v0.11.3 (http://www.bioinformatics.babraham.ac.uk/projects/fastqc/). Paired-end reads were aligned using Bowtie2 v2.2.536 against either mm10 or hg38 and non-uniquely mapping reads were removed. To correct for the fact that the Tn5 transposase binds as a dimer and inserts two adapters in the Tn5 tagmentation step37, all positive-strand reads were shifted 4bp downstream and all negative-strand reads were shifted 5bp upstream to center the reads on the transposon binding event11. We then pooled the shifted reads by sample type and identified peaks using MACS238 with a threshold of FDR-corrected P < 1e-2 using the Benjamini-Hochberg procedure for multiple hypothesis correction. As called peaks may be due to noise in the assay and not reflect true chromatin accessibility, we calculated an irreproducible discovery rate (IDR)39 for all pairs of replicates across a cell type. The IDR is an estimate of the threshold where two ranked lists of results, in this case peak calls ranked by P value, no longer represent reproducible events. Using this measure, we excluded peaks that were not reproducible (IDR < 5e-3) across at least one pair of replicates in each mouse or human cell type.
ATAC-Seq atlas creation
Peaks found reproducibly in each mouse cell type were combined to create a genome-wide atlas of accessible chromatin regions. Reproducible peaks from different samples were merged if they overlapped by more than 75%. To create the atlas of accessible peaks for the human samples, reproducible peaks from the normal human cell types (HN, HCM, and HEM) and the tumor-derived cells (PD1hi) were combined. There was greater variation between the human TIL samples than between T cell samples from healthy donors; this led to fewer reproducible peaks being called in the TIL samples. Like the mouse atlas, peaks overlapping by more than 75% were merged in the human atlas. Numbers of called peaks and reproducible peaks for each sample type are listed in Supplementary Data File 1.
Assignment of ATAC-Seq peaks to genes
The RefSeq transcript annotations of the hg38 version of the human genome and the mm10 version of the mouse genome were used to define the genomic location of transcription units. For genes with multiple gene models, the longest transcription unit was used for the gene locus definition. ATAC peaks located in the body of the transcription unit, together with the 2-kb regions upstream of the TSS and downstream of the 3′ end, were assigned to the gene. If a peak was found in the overlap of the transcription units of two genes, one of the genes was chosen arbitrarily. Intergenic peaks were assigned to the gene whose TSS or 3′ end was closest to the peak. In this way, each peak was unambiguously assigned to one gene. Peaks were annotated as promoter peaks if they were within 2kb of a transcription start site. Non-promoter peaks were annotated as intergenic, intronic, or exonic according to the relevant RefSeq transcript annotation.
ATAC-Seq peak atlas summary
We found a total of 75,689 reproducible ATAC-Seq peaks in the mouse samples. Examining genomic locations, 39.6% of the peaks were found in introns, 36.3% were found in intergenic regions, 22.1% were found in promoters and 2.1% were found in exons. In the human samples, we found a total of 42,104 reproducible ATAC-Seq peaks. Among these peaks, 34.0% were found in introns, 29.9% were found in intergenic regions, 34.0% were found in promoters, and 2.0% were found in exons. Chromosome-wide genomic coverage for all (autosomal) chromosomes and all samples was examined and no systemic bias was observed.
Principal Component Analysis
PCA plots were generated using read counts against all mouse or human atlas peaks. These read counts were processed using the variance-stabilizing transformation built into the DESeq2 package40.
Differential peak accessibility
Reads aligning to atlas peak regions were counted using the summarizeOverlaps function of the R packages GenomicAlignments v1.2.2 and GenomicRanges v1.18.441. Differential accessibility of these peaks was then calculated for all pairwise comparisons of cell types using DESeq2 v1.6.340.
Peak heatmaps and genome coverage plots
The ATAC-Seq peak heatmaps were created by pooling the DESeq size-factor normalized read counts per atlas peak across replicates of ATAC-Seq data and binning the region +/− 1kb around the peak summit in 20bp bins. All analysis was performed using the original uncapped read counts. Genome coverage plots were generated for each replicate of ATAC-seq and RNA-seq by calculating genome-wide coverage of aligned reads using the bedtools function genomecov42. For ATAC-seq samples, this coverage was calculated after shifting the reads to account for the Tn5-induced bias. The coverage values were then normalized using DESeq2-derived size factors and replicates were combined to create one signal track for each sample type. To improve visibility, bins with read counts greater than the 75th percentile + 1.5*IQR were capped at that value. ATAC-Seq and RNA-Seq coverage plots were generated using the Integrated Genomics Viewer (Broad)43.
Transcription factor peak assignment
Using MEME’s44 curated CisBP45 transcription factor binding motif (TFBM) reference, we scanned the mouse ATAC-Seq peak atlas with FIMO46 to find peaks likely to contain each TFBM (p < 10−4). The MEME cisBP reference for direct and inferred motifs for Mus musculus was curated by the MEME suite developers as follows: to reduce redundancy, for each transcription factor (TF) a single motif was selected according to the following precedence rules. The direct motif was chosen if there was one, otherwise the inferred motif with the highest DNA binding domain (DBD) similarity (according to CisBP) to a TF in another species with a direct motif was chosen. If there was more than one direct motif or inferred motif with the highest DBD similarity, a motif was chosen according to its provenance (CisBP’s “Motif_Type” attribute) in the following order: ChIP-seq, HocoMoco, DeBoer11, PBM, SELEX, B1H, High-throughput Selex CAGE, PBM:CSA:DIP-chip, ChIP-chip, COMPILED, DNaseI footprinting. Each motif thus determined was linked to a single TF in the CisBP database, following the same precedence rules. The final reference contained 718 motifs between 6 and 30bp in width (average width 10.7bp). Transcription factors with similar FIMO-predicted target peaks were combined into transcription factor families. Similarity of predicted target peak sets was measured using the Jaccard index (size of intersection / size of union). Transcription factors with Jaccard indices greater than 0.7 were combined for further analyses. Relative transcription factor accessibility was calculated using two one-sided Wilcoxon rank-sign tests comparing the distributions of peak heights for peaks containing FIMO predicted transcription factor binding sites. Peak height was defined as the maximum observed number of reads overlapping at any point in the defined peak region.
Footprinting Analysis
ATAC-seq footprints containing FIMO-predicted TF binding sites (p < 1e-4) were selected. Positive and negative strand ATAC-seq cut sites were counted 100bp up- and down-stream of the center of the motif site in each of the selected peaks. The mean number of ATAC-seq cut sites across matching atlas peaks was then plotted to generate the footprint figures.
Diamond Plots
In these plots, each gene is represented by a stack of diamonds corresponding to that gene’s associated accessible chromatin regions. The bottom-most peak in this stack corresponds to the log2 fold change in expression of the gene. The diamonds are colored according to the accessibility change of their ATAC-seq peak with blue indicating closing and red indicating opening. The color scale was based on the rank-order of the peak accessibility changes. In Extended Data Fig. 6d, the color scale ranges from a log2 fold change of −3.92 to 4.96 (L14/L7).
Comparison of human and mouse ATAC-Seq atlases
UCSC’s liftOver tool47 was used to convert the mouse ATAC-Seq peak atlas from mm10 coordinates to hg38 coordinates. The converted mouse atlas was then compared to the human atlas and 20,642 mouse peaks were within 100bp of a human peak. We compared the results from the UCSC liftover tool and an alternative method, bnMapper48 and confirmed that the set of peaks mapped by bnMapper and by the UCSC liftOver tool was nearly identical (57383/75689 by liftOver and 58299/75689 by bnMapper). Additionally, all 57223 peaks mapped to hg38 by both tools were mapped to the same chromosomal positions. The majority of these conserved peaks were found in promoter regions (56.4%), while relatively fewer were found in intergenic (22.4%), intronic (19.6%), and exonic (1.5%) regions. For non-promoter peaks conserved between human and mouse, Spearman correlations of log2FC were calculated between human N and human EM, CM or PD1hi TIL versus log2FC between murine N and functional E5, E7, M and dysfunctional L5 to L60.
RNA-Seq
Raw ATAC-Seq reads were trimmed and filtered for quality using Trim Galore! v0.4.0 (http://www.bioinformatics.babraham.ac.uk/projects/trim_galore/), powered by CutAdapt v1.8.1 (http://dx.doi.org/10.14806/ej.17.1.200) and FastQC v0.11.3 (http://www.bioinformatics.babraham.ac.uk/projects/fastqc/). Paired-end reads were aligned using STAR49 against either mm10 or hg38. The RefSeq transcript annotations of the hg38 version of the human genome and the mm10 version of the mouse genome were used for the genomic location of transcription units. Reads aligning to annotated exon regions were counted using the summarizeOverlaps function of the R packages GenomicAlignments v1.2.2 and GenomicRanges v1.18.441. Differential expression of genes across cell types was calculated using DESeq2 v1.6.340. FDR correction of 0.05 was imposed unless otherwise stated. A log2fold change cutoff of 1 was used in some analyses as indicated.
Pathway analysis
Enrichment of GO terms in sets of ATAC-Seq peaks was calculated using GREAT (Genomic Regions Enrichment of Annotations Tool) using default parameters50. The full ATAC-Seq atlas was used as the background set.
Membrane protein analysis
To identify membrane proteins that distinguished early (L5-L7) from late (L14-L60) dysfunctional TST, RNA-Seq data was analyzed for genes contained within the Gene Ontology category 0016020 (membrane proteins). The top 50 most up and down-regulated genes (size-factor normalized RPKM) when compared between L5-L7 v L14-L60 were plotted in a heatmap (row-normalized). Protein expression was assessed by flow cytometry for those membrane proteins for which monoclonal antibodies were available. Murine targets (clone; supplier): CD5 (53–7.3; eBioscience), CD30L (RM153; eBioscience), CD38 (90; Biolegend), and CD101 (Moushi101; eBioscience). Human targets: CD5 (L17F12; Biolegend), CD38 (HB7; eBioscience), CD101 (BB27; Biolegend).
Data reporting
No statistical methods were used to predetermine sample size. The investigators were not blinded to allocation during experiments and outcome assessment. Mice or human samples were excluded if donor or tumor-infiltrating CD8 T cells could not be found.
Data availability
All data generated and supporting the findings of this study are available within the paper. The RNA-Seq and ATAC-Seq data have been deposited in the Gene Expression Omnibus [GEO Super-Series accession number GSE89309 (GSE89307 for RNA-Seq, GSE89308 for ATAC-Seq]. Source Data are provided with the online version of the paper. Additional information and materials will be made available upon request.
Extended Data
Extended Data Figure 1. Phenotypic and functional characteristics of naïve TCRTAG CD8 T cells differentiating to effector and memory T cells during acute Listeria infection.
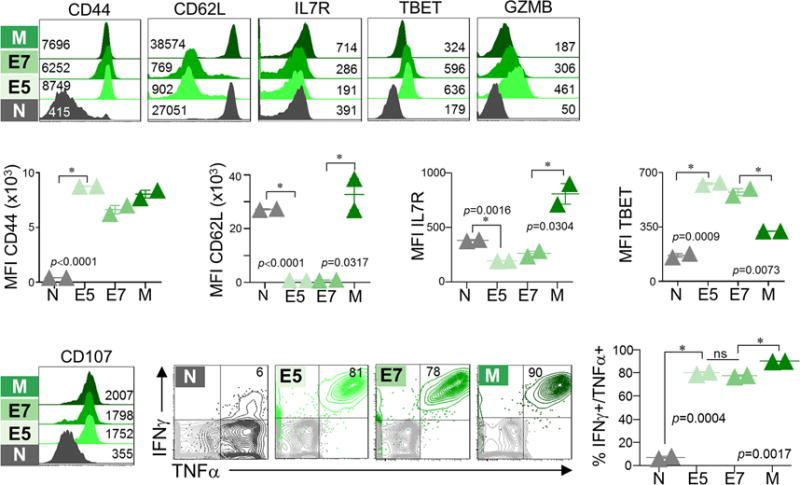
Naïve TCRTAG (N; Thy1.1+) were transferred into B6 (Thy1.2+) mice, which were immunized with LmTAG one day later. At days 5, 7, and 60+ post LmTAG, effector (E5 and E7), and memory (M) T cells were isolated from spleens and assessed for phenotype and function. Flow cytometric analysis of CD44, CD62L, IL7Rα, TBET, and GZMB expression directly ex vivo (upper panel; inset numbers show MFI), and intracellular IFNγ and TNFα production and CD107 expression after 4-hour ex vivo TAG peptide stimulation (lower panel). Flow plots are gated on CD8+ Thy1.1+ cells. For cytokine production, in grey are shown no-peptide control cells. (n=8 total, with n=2 per cell state). Each symbol represents an individual mouse. Data show mean ± s.e.m; P values calculated using unpaired, two-tailed Student’s t-test. Data are representative of more than 4 independent experiments.
Extended Data Figure 2. Fragment length distribution plots of ATAC-seq samples.
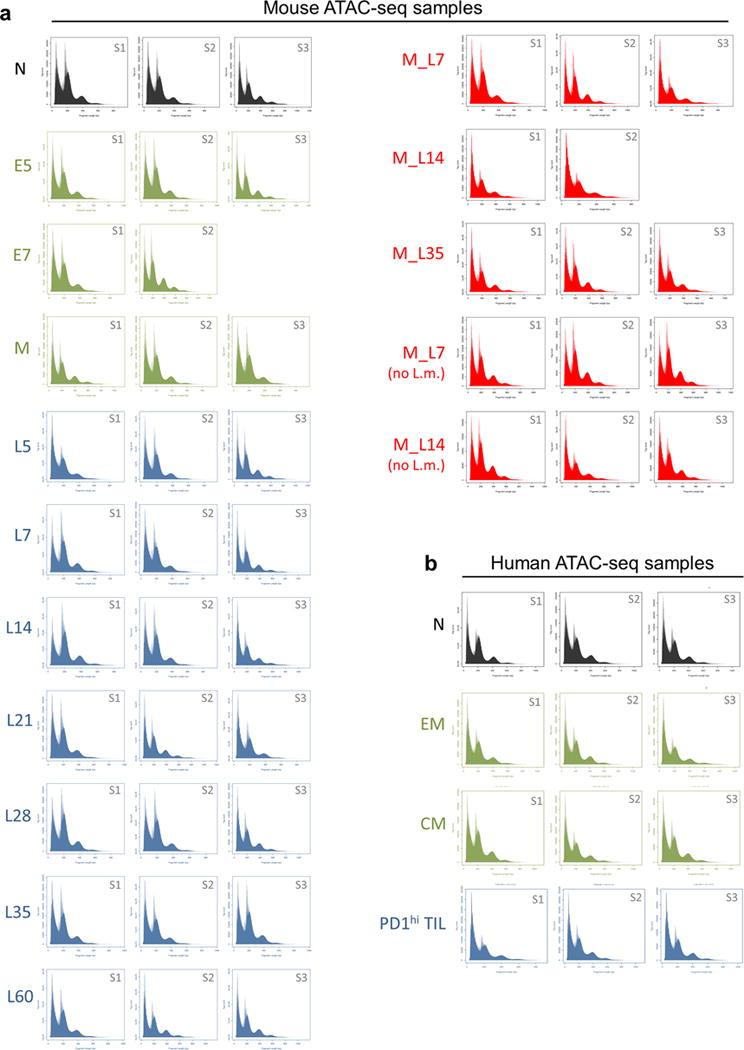
Plots are shown for all mouse (a) and human (b) CD8 T cell ATAC-seq samples displaying fragment length (bp; x-axis) and read counts (y-axis). (S1, S2, S3 = replicates per sample group).
Extended Data Figure 3. Epigenetic and transcriptional regulation of normal CD8 differentiation.
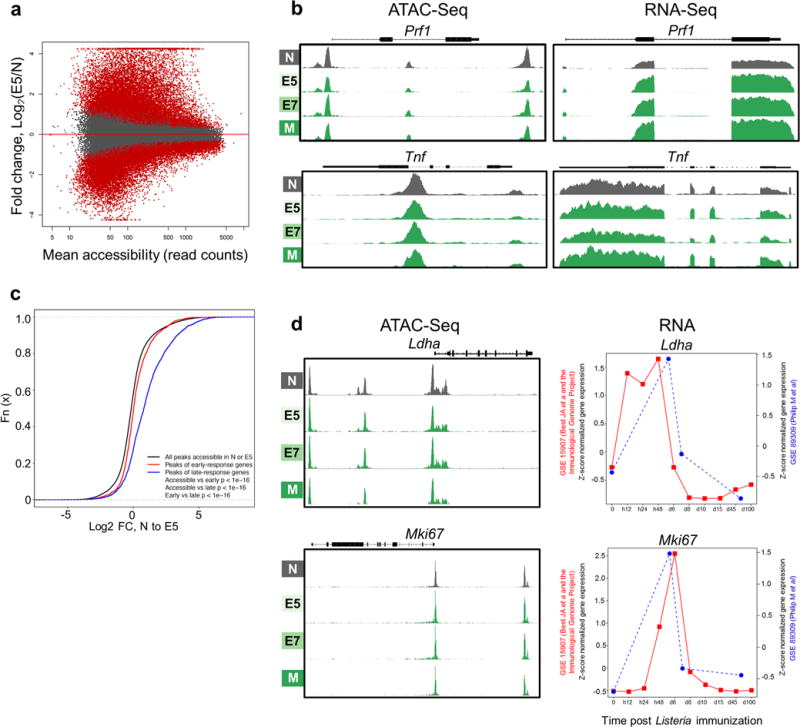
a, ATAC-Seq data reveals massive chromatin remodeling during normal CD8 T cell differentiation. MA plot of Naïve (N) and Day 5 Effectors (E5) showing log2 ratios of peak accessibility (E5/N) versus mean read counts for all atlas peaks. Significantly differentially accessible peaks are shown in red (FDR < 0.05). b, Epigenetic and transcriptional regulation of CD8 effector genes. ATAC-seq (left) and RNA-seq (right) signal profiles of Prf1 and Tnf in Naïve (N), Effectors (E5 and E7), and Memory (M) TCRTAG during acute LmTAG infection. (c – d), Epigenetic and transcriptional regulation of early CD8 response genes in TCRTAG during acute listeria infection. Published expression data from the Immunological Genome Project (JA Best et al, Nat Imm (2013); GSE 15907) were used; early-response genes increase in expression within the first 12–24 hours and late-response genes increase expression 24–48 hours after naïve T cells encounter LmOVA as determined by Best JA et al. c, Cumulative distribution function of peak accessibility changes between N and E5. Peaks associated with early-response genes show fewer changes in accessibility as compared to peaks associated with late-response genes. The black line shows all peaks accessible in N or E5, the red line shows peaks associated with early-response genes and the blue line shows peaks associated with late-response genes. d, ATAC-seq signal profiles (left) and RNA expression (right) of the early response genes Ldha (top) and Mki67 (bottom) in N, E5/E7, and M TCRTAG during acute LmTAG infection (blue line; GSE 89309; current dataset Philip M et al.) overlaid with expression data from Best JA et al./Immunological Genome Project (red line).
Extended Data Figure 4. Chromatin peak accessibility changes during normal and dysfunctional CD8 T cell differentiation.
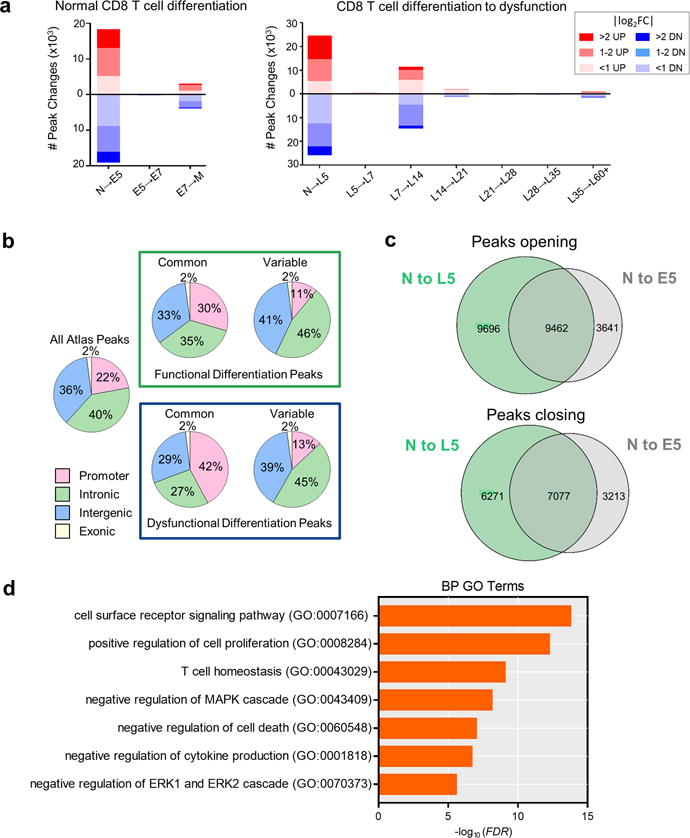
a, Number of DESeq-determined chromatin peak accessibility changes during each transition during normal CD8 T cell differentiation (Listeria infection) (right) and CD8 T cell differentiation to dysfunction during tumorigenesis (left) broken down by |log2FC|>2, |log2FC|=1–2, and |log2FC|<1. b, Chromatin accessibility peaks gained or lost during normal and dysfunctional CD8 T cell differentiation were mainly found in intergenic and intronic regions. Pie charts showing the proportions of reproducible ATAC-seq peaks in exonic, intronic, intergenic and promoter regions. (Left) Distribution for all peaks in the atlas. Green box – normal CD8 T cell differentiation during LmTAG immunization; distribution for common and variably accessible peaks in N, E5, E7, and M functional CD8 T cells. Blue box – differentiation to dysfunction in progressing tumors; distribution for common and variably accessible peaks in N, L5, L7, L14, L21, L28, L35, and L60+. Variable = significant change in at least one cell type comparison (FDR<0.05, |log2FC|>1). Common = no change in any cell type comparison. c, Venn diagrams show the number of significantly-changed peaks during the transition from Naive (N) to D5-effectors (E5) TCRTAG during acute listeria LmTAG infection versus N to L5 early malignant lesion-infiltrating TCRTAG (FDR< 0.05, |log2FC|>2) (Upper) Venn diagram shows opening peaks; (lower) Venn diagram shows closing peaks. d, Selected Biological process (BP) Gene Ontology (GO) terms enriched in peaks open in L5 relative to E5 as determined through GREAT analysis.
Extended Data Figure 5. NFATC1 targets become significantly more accessible during differentiation to dysfunction in early malignant lesions as compared to normal effector differentiation.
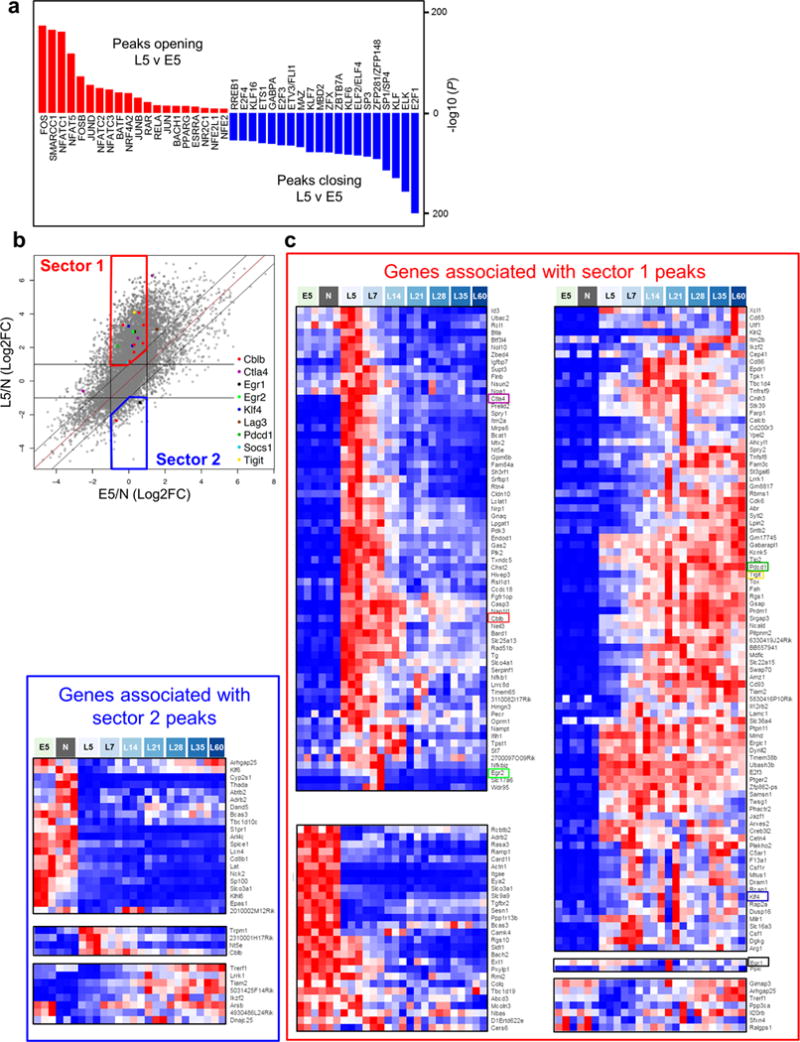
a, Top 20 most-significantly enriched TF motifs in peaks opening (red) and closing (blue) between L5 and E5. b, Scatterplot comparing the changes in peak accessibility for all differentially-accessible peaks containing the NFATC1 motif during the transition from Naive (N) to D5-Effectors (E5) TCRTAG during acute listeria LmTAG infection versus N to L5 in pre-malignant lesions (FDR< 0.05, |log2FC|>1). Highlighted are NFATC1 target peaks associated with genes encoding negative regulatory transcription factors and inhibitory receptors. Some genes, e.g. Cblb and Klf4, had multiple NFATC1 target peaks, including peaks that decreased in accessibility. c, Genes with more accessible NFATC1 target peaks during differentiation to dysfunction in malignant lesions show increased expression levels. Gene expression for genes with peaks in sector 1 and sector 2, with increased and decreased accessibility in L5 vs E5 respectively. Heatmaps show RNA-Seq expression data (row-normalized) for differentially-expressed (P< 0.01, |log2FC| > 1) genes with NFATC1 target peaks contained in Sector 1 (red box) or Sector 2 (blue box) of scatterplot presented b. The majority of Sector 1 genes (195/223, 87%) revealed increased expression in dysfunctional TST as compared to E5, while the majority of Sector 2 genes (21/33, 63%) had decreased expression. Genes are clustered by row according to expression across the samples. Interestingly, while many genes in Sector 1 had transiently increased expression in L5 and L7 (red box, upper left), many genes increased in expression at later stages of tumorigenesis at L14 and beyond (red box, upper right). This suggests that NFATC1 activation of downstream targets (negative regulators of T cell function) may not only induce early dysfunction, but may cause or contribute to the transition from plastic to fixed dysfunction.
Extended Data Figure 6. Epigenetic and transcriptional changes during the L7 to L14 transition.
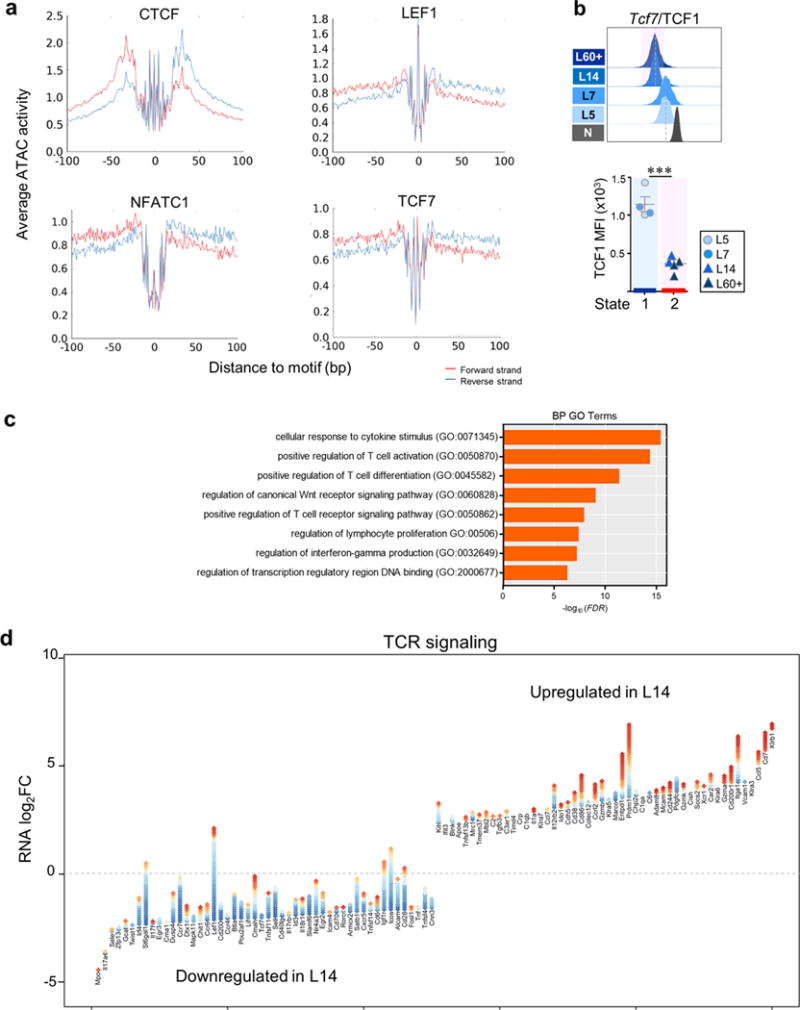
a, Transcription factor footprinting in chromatin accessible regions. ATAC cut site distributions show footprints for CTCF, LEF1, NFATC1, and TCF7 in naïve CD8 T cells. Shown is the mean number of ATAC cut sites on the forward (red) or reverse (blue) strand 100bp up and downstream of the TF motif site, calculated for atlas peaks predicted by FIMO to be bound by the respective TF (p<10−4). b, TCF1 expression (MFI; mean fluorescence intensity). Each symbol represents individual mouse. Mean ± s.e.m. shown; *** P≤0.0001 (Student’s t-test). c, Selected Biological Processes (BP) (Gene Ontology [GO] terms) enriched in genes which significantly lost chromatin accessibility during the L7 to L14 transition as determined through GREAT analysis. d, Gain and losses of regulatory elements for top 50 most differentially expressed genes associated with TCR signaling during the L7 to L14 transition. Top 25 genes associated with TCR signaling with highest and lowest logFC gene expression changes are shown. Each gene is illustrated by a stack of diamonds, where each diamond represents a chromatin peak associated with the gene. Red diamonds denote peaks gained in the transition, blue diamonds denote peaks that were lost.
Extended Data Figure 7. Pharmacological targeting of NFAT and Wnt/β-catenin signaling prevents TST differentiation to the fixed dysfunctional state in vivo.
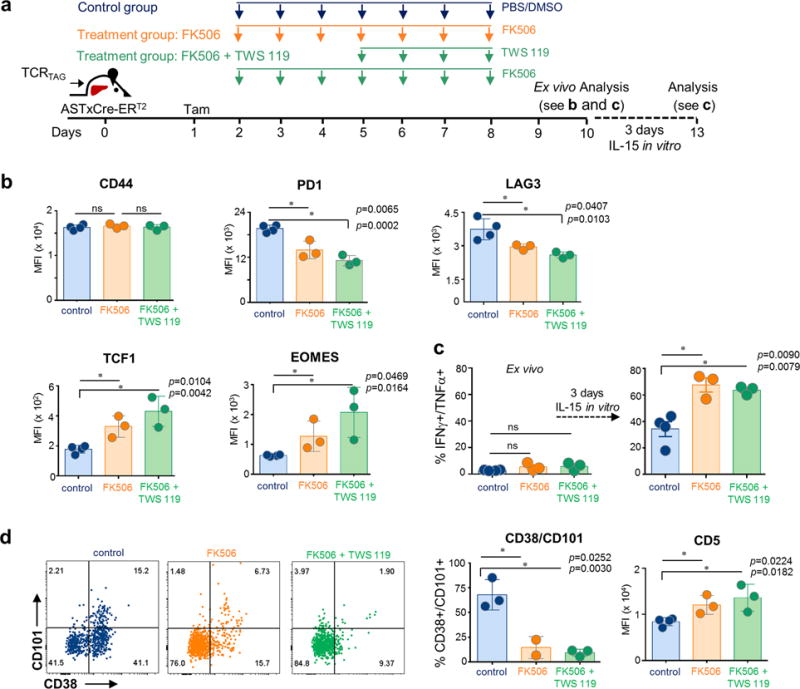
a, Experimental scheme. Naïve TCRTAG (Thy1.1+) were transferred into ASTxCre-ERT2 (Thy1.2+) mice which were treated with tamoxifen (Tam) one day later. At days 2–9 mice were treated with the calcineurin inhibitor FK506 (2.5mg/kg/mouse) alone (FK506 treatment group; orange), or in combination with the GSK3β inhibitor TWS119 (0.75mg/mouse; days 5–8) (FK506 + TWS119 treatment group; green), or PBS/DMSO (control group; blue) as indicated. At day 10, TCRTAG were isolated from livers and assessed for phenotype and function. b, Flow cytometric analysis of CD44, PD1, LAG3, TCF1, and EOMES expression of TCRTAG. c, IFNγ and TNFα production of TCRTAG isolated at day 10 (left panel; straight ex vivo), and post 3 days IL15 in vitro culture (right panel). Each symbol represents an individual mouse. Data show mean ± s.e.m; P values calculated using unpaired two-tailed t-test. d, Representative flow cytometric analysis of CD38 and CD101 expression of TCRTAG (numbers indicate %); CD38, CD101 and CD5 expression. Each symbol represents an individual mouse. Data show mean ± s.e.m; P values calculated using unpaired two-tailed t-test. These data are representative of 2 independent experiments (with total n=10 for Exp#1; n=9, Exp#2).
Extended Data Figure 8. Epigenetic and expression dynamics of membrane proteins and transcription factors associated with T cell dysfunction.
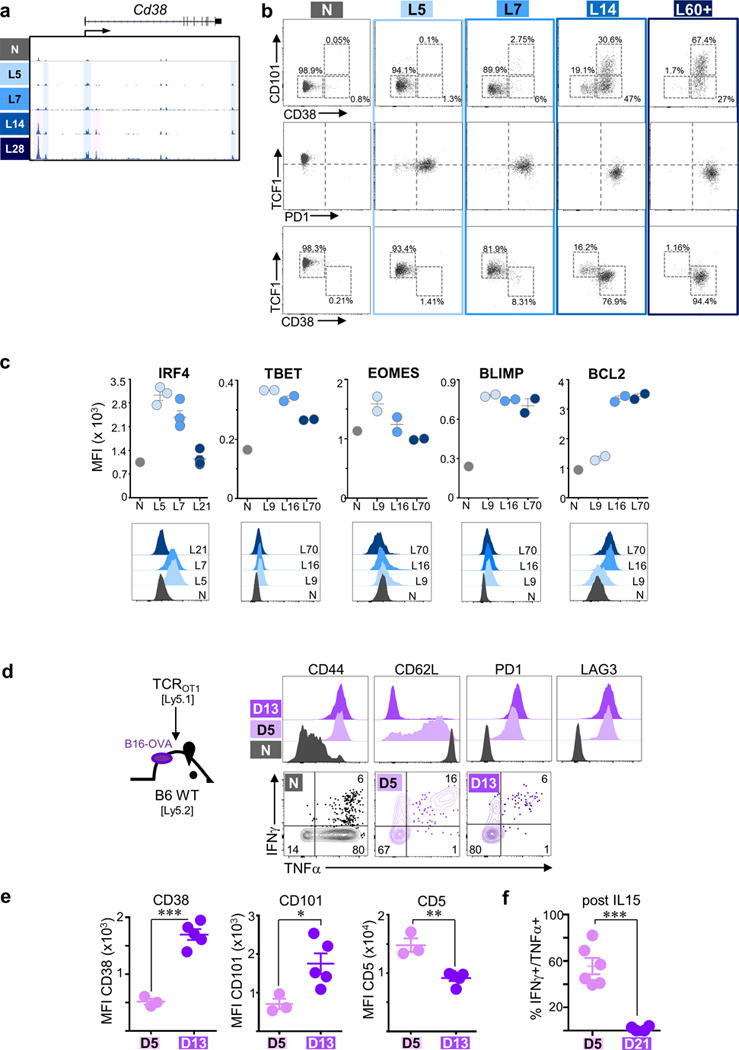
a, ATAC-Seq signal profile across the Cd38 loci with “state 2” uniquely accessible peaks highlighted in pink; activation-associated peaks highlighted in blue. b, Expression profiles of N, L5, L7, L14, and L60+ TCRTAG for CD101 versus CD38, TCF versus PD1, and TCF1 versus CD38 by flow cytometric analysis. c, Expression of transcription factors and other proteins on tumor-specific TCRTAG T cells over the course of tumorigenesis (MFI; mean fluorescence intensity). Each symbol represents an individual mouse. Data shows mean ± s.e.m. (bottom panel). Representative flow histogram overlays are shown. (d – f) TCROT1 TST in established B16-OVA tumors enter plastic and fixed dysfunctional states. d, Immunophenotype and cytokine production of TCROT1 re-isolated from established B16-OVA tumors 5 (D5) and 13 (D13) days post transfer. e, CD38, CD101 and CD5 expression on D5 and D13 TCROT-1. f, Cytokine production of D5 and D21 TCROT-1 after 3 days IL-15 in vitro culture. Each symbol represents individual mouse. Mean ± s.e.m. shown; *P=0.03, **P=0.002, ***P≤0.0003 (Student’s t-test).
Extended Data Figure 9. Chromatin state dynamics of memory TCRTAG differentiating to the dysfunctional state in solid tumors.
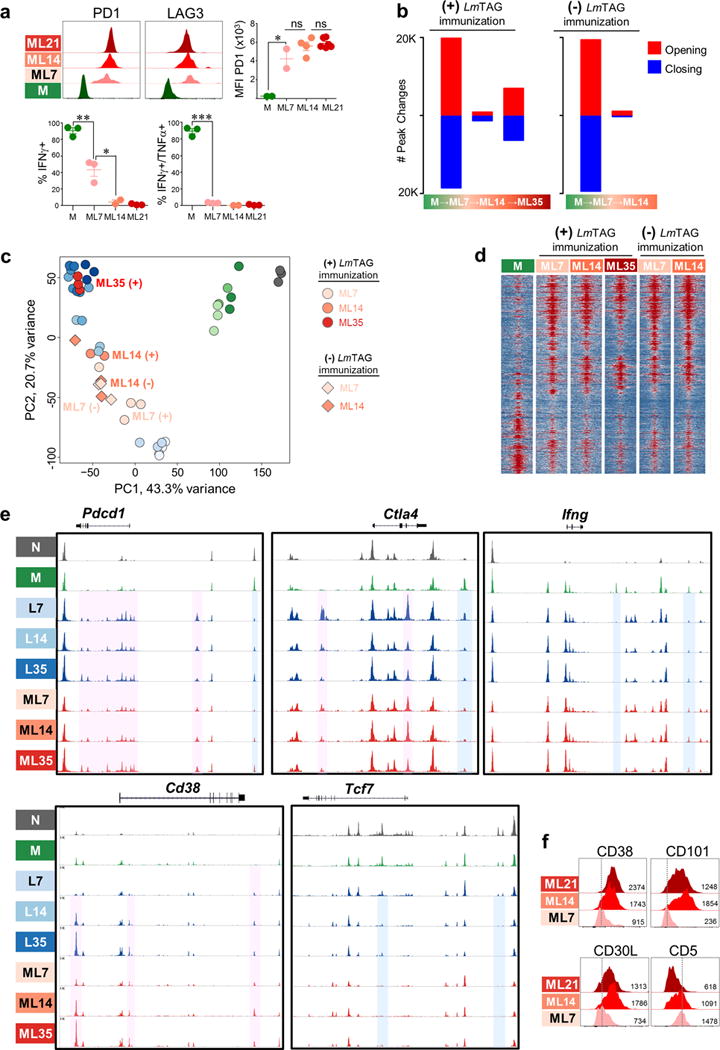
a, PD1 and LAG3 expression and cytokine production of memory TCRTAG in liver tumors. Each symbol represents individual mouse. Mean ± s.e.m. shown; *P=0.03, **P=0.006, ***P<0.0001 (Student’s t-test); representative of 4 independent experiments. b, Numbers of ATAC-seq peaks significantly opening or closing (FDR < 0.05) during each transition as memory TCRTAG differentiate to the dysfunctional state 7, 14, and 35 days post transfer into HCC-tumor bearing ASTxAlb:Cre mice with [(+); left] and without [(-); right] listeria LmTAG immunization; peaks opening (red), peaks closing (blue). c, Principal component analysis of peak accessibility during naïve TCRTAG differentiation in acute infection (green), early tumorigenesis (blue), and memory TCRTAG in established HCC (red). Circles = with LmTAG immunization; diamonds = no LmTAg immunization. d, Chromatin accessibility heatmap. Each row represents one of 11,698 selected peaks (differentially accessible between any sequential cell comparison; FDR <0.05, |log2FC|>2). Shown are +/− 1kb from the peak summit (2kb total per region). e, ATAC-seq signal profiles of Pdcd1, Ctla4, Cd38, Tcf7, and Ifng genes of Naïve (N; grey), Memory (M; green), L7, L14, L35 (blue series), and ML7, ML14, and ML35 (red series) TCRTAG. Pink boxes highlight peaks that become accessible in dysfunctional T cells compared to Naïve and Memory; blue boxes highlight peaks that become inaccessible in dysfunctional TCRTAG compared to Naïve and Memory TCRTAG. f, CD38, CD101, CD30L, and CD5 expression on ML7, ML14, ML21. Inset numbers show MFI.
Extended Data Figure 10. Chromatin states of human PD1hi tumor-infiltrating CD8+ T cells and model for CD8 TST differentiation and dysfunction in tumors.
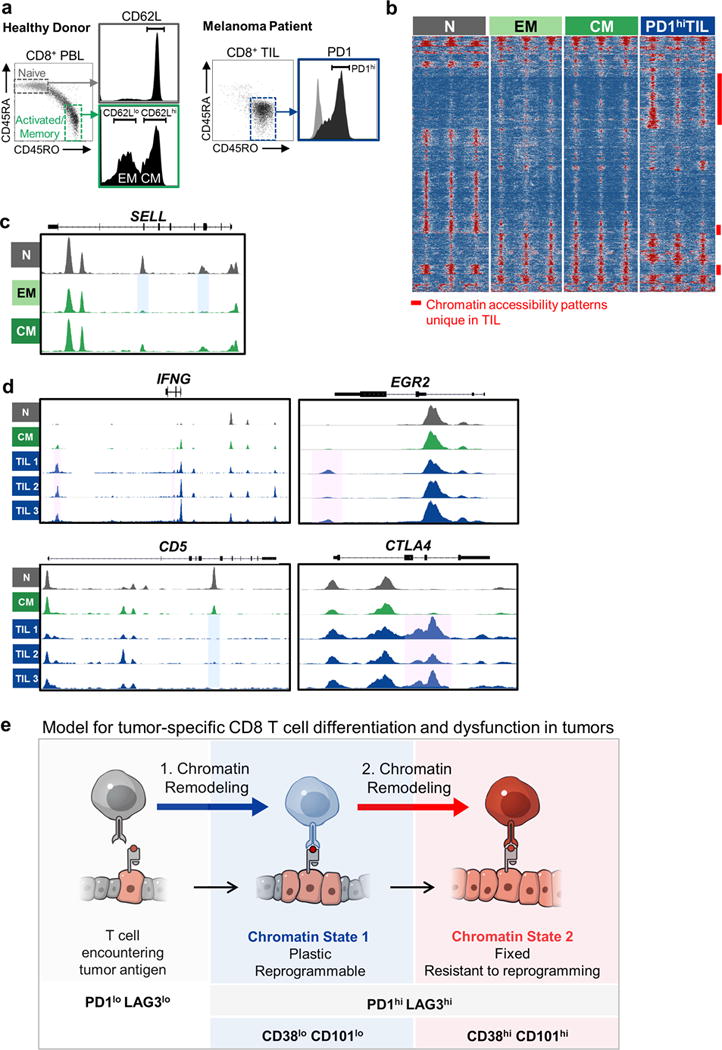
a, Sorting scheme of peripheral blood lymphocytes for Naïve (N), Effector Memory (EM), Central Memory (CM) CD8 T cell populations (left), and PD1hi CD8 TIL from melanoma and NSCLC patients. b, Differentially accessible ATAC-seq peaks grouped by DESeq-defined differential accessibility pattern. Each column represents one biological replicate. Samples shown include CD45RA+ CD45RO- (Naïve; N; grey), CD45RA- CD45RO+, CD62L- (Effector Memory; EM; light green) and CD45RA- CD45RO+, CD62L+ (Central Memory; CM; dark green) peripheral blood CD8+ T cells from healthy donors, and CD45RA- CD45RO+, PD1hi CD8+ T cells isolated and flow-sorted from human melanoma and lung tumors (PD1hi TIL; blue). Open, accessible chromatin regions are presented in red; inaccessible chromatin regions are presented in blue. c, ATAC-seq signal profiles of SELL in N, EM and CM. Blue boxes highlight peaks that remain accessible in CM or become inaccessible in EM compared to N respectively. d, ATAC-seq signal profiles of IFNG, EGR2, CD5, CTLA4. Pink and blue boxes highlight peaks that become accessible or inaccessible in PD1hi TIL compared to N or CM respectively. e, Model for tumor-specific CD8 T cell differentiation and dysfunction in tumors.
Supplementary Material
Acknowledgments
We thank Joris van der Veeken, Varintra Krisnawan, Yuri Pritykin, and Billel Gasmi for helpful discussions and technical support; Steve Reiner for helpful discussions; and the MSKCC Flow Cytometry Core. T.M., M.H., J.D.W., A.S. are members of the Parker Institute for Cancer Immunotherapy. This work was supported by NIH-NCI grants R00 CA172371 (to A.S.), K08 CA158069 (to M.P.), and U54 CA209975 (to C.S.L and A.S.), NHGRI grant U01 HG007893 (to C.S.L.), V Foundation for Cancer Research (to A.S.), the William and Ella Owens Medical Research Foundation (to A.S.), the Josie Robertson Young Investigator Award (to A.S.), and the MSKCC Core Grant P30 CA008748. The Integrated Genomics Operation Core was supported by Cycle for Survival and the Marie-Josée and Henry R. Kravis Center for Molecular Oncology.
Footnotes
Supplementary Information is available in the online version of the paper.
Author Contributions: M.P. and A.S. conceived and designed the study, carried out experiments, analyzed, and interpreted data. L.F. designed and performed all high-throughput computational analyses; C.S.L. designed and supervised computational analyses; E.H., S.C., M.S., and A.C.S. assisted with experiments; L.S. and A.V. performed ATAC-Seq; P.L. generated Listeria strains, T.M., M.H. and J.D.W. provided human samples. M.P. and A.S. wrote the manuscript, with all authors contributing to writing and providing feedback.
Author Information: The authors declare no competing financial interest.
References
- 1.Hellstrom I, Hellstrom KE, Pierce GE, Yang JP. Cellular and humoral immunity to different types of human neoplasms. Nature. 1968;220:1352–1354. doi: 10.1038/2201352a0. [DOI] [PubMed] [Google Scholar]
- 2.Khalil DN, Smith EL, Brentjens RJ, Wolchok JD. The future of cancer treatment: immunomodulation, CARs and combination immunotherapy. Nat Rev Clin Oncol. 2016;13:273–290. doi: 10.1038/nrclinonc.2016.25. [DOI] [PMC free article] [PubMed] [Google Scholar]
- 3.Snyder A, et al. Genetic basis for clinical response to CTLA-4 blockade in melanoma. The New England journal of medicine. 2014;371:2189–2199. doi: 10.1056/NEJMoa1406498. [DOI] [PMC free article] [PubMed] [Google Scholar]
- 4.Kelderman S, Schumacher TN, Haanen JB. Acquired and intrinsic resistance in cancer immunotherapy. Mol Oncol. 2014;8:1132–1139. doi: 10.1016/j.molonc.2014.07.011. [DOI] [PMC free article] [PubMed] [Google Scholar]
- 5.Rizvi NA, et al. Cancer immunology. Mutational landscape determines sensitivity to PD-1 blockade in non-small cell lung cancer. Science. 2015;348:124–128. doi: 10.1126/science.aaa1348. [DOI] [PMC free article] [PubMed] [Google Scholar]
- 6.Schietinger A, et al. Tumor-Specific T Cell Dysfunction Is a Dynamic Antigen-Driven Differentiation Program Initiated Early during Tumorigenesis. Immunity. 2016;45:389–401. doi: 10.1016/j.immuni.2016.07.011. [DOI] [PMC free article] [PubMed] [Google Scholar]
- 7.Zhang JA, Mortazavi A, Williams BA, Wold BJ, Rothenberg EV. Dynamic transformations of genome-wide epigenetic marking and transcriptional control establish T cell identity. Cell. 2012;149:467–482. doi: 10.1016/j.cell.2012.01.056. [DOI] [PMC free article] [PubMed] [Google Scholar]
- 8.Scharer CD, Barwick BG, Youngblood BA, Ahmed R, Boss JM. Global DNA methylation remodeling accompanies CD8 T cell effector function. J Immunol. 2013;191:3419–3429. doi: 10.4049/jimmunol.1301395. [DOI] [PMC free article] [PubMed] [Google Scholar]
- 9.Russ BE, et al. Distinct epigenetic signatures delineate transcriptional programs during virus-specific CD8(+) T cell differentiation. Immunity. 2014;41:853–865. doi: 10.1016/j.immuni.2014.11.001. [DOI] [PMC free article] [PubMed] [Google Scholar]
- 10.Shih HY, et al. Developmental Acquisition of Regulomes Underlies Innate Lymphoid Cell Functionality. Cell. 2016;165:1120–1133. doi: 10.1016/j.cell.2016.04.029. [DOI] [PMC free article] [PubMed] [Google Scholar]
- 11.Buenrostro JD, Giresi PG, Zaba LC, Chang HY, Greenleaf WJ. Transposition of native chromatin for fast and sensitive epigenomic profiling of open chromatin, DNA-binding proteins and nucleosome position. Nat Methods. 2013;10:1213–1218. doi: 10.1038/nmeth.2688. [DOI] [PMC free article] [PubMed] [Google Scholar]
- 12.Staveley-O’Carroll K, et al. In vivo ligation of CD40 enhances priming against the endogenous tumor antigen and promotes CD8+ T cell effector function in SV40 T antigen transgenic mice. J Immunol. 2003;171:697–707. doi: 10.4049/jimmunol.171.2.697. [DOI] [PubMed] [Google Scholar]
- 13.Brockstedt DG, et al. Listeria-based cancer vaccines that segregate immunogenicity from toxicity. Proc Natl Acad Sci U S A. 2004;101:13832–13837. doi: 10.1073/pnas.0406035101. [DOI] [PMC free article] [PubMed] [Google Scholar]
- 14.Anders S, Huber W. Differential expression analysis for sequence count data. Genome Biol. 2010;11:R106. doi: 10.1186/gb-2010-11-10-r106. [DOI] [PMC free article] [PubMed] [Google Scholar]
- 15.Araki Y, Fann M, Wersto R, Weng NP. Histone acetylation facilitates rapid and robust memory CD8 T cell response through differential expression of effector molecules (eomesodermin and its targets: perforin and granzyme B) J Immunol. 2008;180:8102–8108. doi: 10.4049/jimmunol.180.12.8102. [DOI] [PMC free article] [PubMed] [Google Scholar]
- 16.Denton AE, Russ BE, Doherty PC, Rao S, Turner SJ. Differentiation-dependent functional and epigenetic landscapes for cytokine genes in virus-specific CD8+ T cells. Proc Natl Acad Sci U S A. 2011;108:15306–15311. doi: 10.1073/pnas.1112520108. [DOI] [PMC free article] [PubMed] [Google Scholar]
- 17.Best JA, et al. Transcriptional insights into the CD8(+) T cell response to infection and memory T cell formation. Nat Immunol. 2013;14:404–412. doi: 10.1038/ni.2536. [DOI] [PMC free article] [PubMed] [Google Scholar]
- 18.Peng M, et al. Aerobic glycolysis promotes T helper 1 cell differentiation through an epigenetic mechanism. Science. 2016;354:481–484. doi: 10.1126/science.aaf6284. [DOI] [PMC free article] [PubMed] [Google Scholar]
- 19.Cuylen S, et al. Ki-67 acts as a biological surfactant to disperse mitotic chromosomes. Nature. 2016;535:308–312. doi: 10.1038/nature18610. [DOI] [PMC free article] [PubMed] [Google Scholar]
- 20.Kaech SM, Cui W. Transcriptional control of effector and memory CD8+ T cell differentiation. Nat Rev Immunol. 2012;12:749–761. doi: 10.1038/nri3307. [DOI] [PMC free article] [PubMed] [Google Scholar]
- 21.Sen DR, et al. The epigenetic landscape of T cell exhaustion. Science. 2016;354:1165–1169. doi: 10.1126/science.aae0491. [DOI] [PMC free article] [PubMed] [Google Scholar]
- 22.Pauken KE, et al. Epigenetic stability of exhausted T cells limits durability of reinvigoration by PD-1 blockade. Science. 2016;354:1160–1165. doi: 10.1126/science.aaf2807. [DOI] [PMC free article] [PubMed] [Google Scholar]
- 23.Scott-Browne JP, et al. Dynamic Changes in Chromatin Accessibility Occur in CD8+ T Cells Responding to Viral Infection. Immunity. 2016;45:1327–1340. doi: 10.1016/j.immuni.2016.10.028. [DOI] [PMC free article] [PubMed] [Google Scholar]
- 24.Macian F. NFAT proteins: key regulators of T-cell development and function. Nat Rev Immunol. 2005;5:472–484. doi: 10.1038/nri1632. [DOI] [PubMed] [Google Scholar]
- 25.Martinez GJ, et al. The transcription factor NFAT promotes exhaustion of activated CD8(+) T cells. Immunity. 2015;42:265–278. doi: 10.1016/j.immuni.2015.01.006. [DOI] [PMC free article] [PubMed] [Google Scholar]
- 26.Teague RM, et al. Interleukin-15 rescues tolerant CD8+ T cells for use in adoptive immunotherapy of established tumors. Nat Med. 2006;12:335–341. doi: 10.1038/nm1359. [DOI] [PubMed] [Google Scholar]
- 27.Li Y, et al. MART-1-specific melanoma tumor-infiltrating lymphocytes maintaining CD28 expression have improved survival and expansion capability following antigenic restimulation in vitro. J Immunol. 2010;184:452–465. doi: 10.4049/jimmunol.0901101. [DOI] [PubMed] [Google Scholar]
- 28.Flanagan WM, Corthesy B, Bram RJ, Crabtree GR. Nuclear association of a T-cell transcription factor blocked by FK-506 and cyclosporin A. Nature. 1991;352:803–807. doi: 10.1038/352803a0. [DOI] [PubMed] [Google Scholar]
- 29.Jain J, et al. The T-cell transcription factor NFATp is a substrate for calcineurin and interacts with Fos and Jun. Nature. 1993;365:352–355. doi: 10.1038/365352a0. [DOI] [PubMed] [Google Scholar]
- 30.Gattinoni L, et al. Wnt signaling arrests effector T cell differentiation and generates CD8+ memory stem cells. Nat Med. 2009;15:808–813. doi: 10.1038/nm.1982. [DOI] [PMC free article] [PubMed] [Google Scholar]
- 31.Schietinger A, Delrow JJ, Basom RS, Blattman JN, Greenberg PD. Rescued tolerant CD8 T cells are preprogrammed to reestablish the tolerant state. Science. 2012;335:723–727. doi: 10.1126/science.1214277. [DOI] [PMC free article] [PubMed] [Google Scholar]
- 32.Waugh KA, et al. Molecular Profile of Tumor-Specific CD8+ T Cell Hypofunction in a Transplantable Murine Cancer Model. J Immunol. 2016;197:1477–1488. doi: 10.4049/jimmunol.1600589. [DOI] [PMC free article] [PubMed] [Google Scholar]
METHODS REFERENCES
- 33.Stahl S, et al. Tumor agonist peptides break tolerance and elicit effective CTL responses in an inducible mouse model of hepatocellular carcinoma. Immunol Lett. 2009;123:31–37. doi: 10.1016/j.imlet.2009.01.011. [DOI] [PubMed] [Google Scholar]
- 34.Sinnathamby G, et al. Priming and activation of human ovarian and breast cancer-specific CD8+ T cells by polyvalent Listeria monocytogenes-based vaccines. J Immunother. 2009;32:856–869. doi: 10.1097/CJI.0b013e3181b0b125. [DOI] [PubMed] [Google Scholar]
- 35.Engels B, et al. Relapse or eradication of cancer is predicted by peptide-major histocompatibility complex affinity. Cancer Cell. 2013;23:516–526. doi: 10.1016/j.ccr.2013.03.018. [DOI] [PMC free article] [PubMed] [Google Scholar]
- 36.Langmead B, Salzberg SL. Fast gapped-read alignment with Bowtie 2. Nat Methods. 2012;9:357–359. doi: 10.1038/nmeth.1923. [DOI] [PMC free article] [PubMed] [Google Scholar]
- 37.Adey A, et al. Rapid, low-input, low-bias construction of shotgun fragment libraries by high-density in vitro transposition. Genome Biol. 2010;11:R119. doi: 10.1186/gb-2010-11-12-r119. [DOI] [PMC free article] [PubMed] [Google Scholar]
- 38.Zhang Y, et al. Model-based analysis of ChIP-Seq (MACS) Genome biology. 2008;9:R137. doi: 10.1186/gb-2008-9-9-r137. [DOI] [PMC free article] [PubMed] [Google Scholar]
- 39.Zigler CM, Belin TR. The Potential for Bias in Principal Causal Effect Estimation When Treatment Received Depends on a Key Covariate. Ann Appl Stat. 2011;5:1876–1892. doi: 10.1214/11-AOAS477. [DOI] [PMC free article] [PubMed] [Google Scholar]
- 40.Love MI, Huber W, Anders S. Moderated estimation of fold change and dispersion for RNA-seq data with DESeq2. Genome biology. 2014;15:550. doi: 10.1186/s13059-014-0550-8. [DOI] [PMC free article] [PubMed] [Google Scholar]
- 41.Lawrence M, et al. Software for computing and annotating genomic ranges. PLoS Comput Biol. 2013;9:e1003118. doi: 10.1371/journal.pcbi.1003118. [DOI] [PMC free article] [PubMed] [Google Scholar]
- 42.Quinlan AR, Hall IM. BEDTools: a flexible suite of utilities for comparing genomic features. Bioinformatics. 2010;26:841–842. doi: 10.1093/bioinformatics/btq033. [DOI] [PMC free article] [PubMed] [Google Scholar]
- 43.Robinson JT, et al. Integrative genomics viewer. Nat Biotechnol. 2011;29:24–26. doi: 10.1038/nbt.1754. [DOI] [PMC free article] [PubMed] [Google Scholar]
- 44.Bailey TL, et al. MEME SUITE: tools for motif discovery and searching. Nucleic Acids Res. 2009;37:W202–208. doi: 10.1093/nar/gkp335. [DOI] [PMC free article] [PubMed] [Google Scholar]
- 45.Weirauch MT, et al. Determination and inference of eukaryotic transcription factor sequence specificity. Cell. 2014;158:1431–1443. doi: 10.1016/j.cell.2014.08.009. [DOI] [PMC free article] [PubMed] [Google Scholar]
- 46.Grant CE, Bailey TL, Noble WS. FIMO: scanning for occurrences of a given motif. Bioinformatics. 2011;27:1017–1018. doi: 10.1093/bioinformatics/btr064. [DOI] [PMC free article] [PubMed] [Google Scholar]
- 47.Hinrichs AS, et al. The UCSC Genome Browser Database: update 2006. Nucleic Acids Res. 2006;34:D590–598. doi: 10.1093/nar/gkj144. [DOI] [PMC free article] [PubMed] [Google Scholar]
- 48.Denas O, et al. Genome-wide comparative analysis reveals human-mouse regulatory landscape and evolution. BMC Genomics. 2015;16:87. doi: 10.1186/s12864-015-1245-6. [DOI] [PMC free article] [PubMed] [Google Scholar]
- 49.Dobin A, et al. STAR: ultrafast universal RNA-seq aligner. Bioinformatics. 2013;29:15–21. doi: 10.1093/bioinformatics/bts635. [DOI] [PMC free article] [PubMed] [Google Scholar]
- 50.McLean CY, et al. GREAT improves functional interpretation of cis-regulatory regions. Nat Biotechnol. 2010;28:495–501. doi: 10.1038/nbt.1630. [DOI] [PMC free article] [PubMed] [Google Scholar]
Associated Data
This section collects any data citations, data availability statements, or supplementary materials included in this article.
Supplementary Materials
Data Availability Statement
All data generated and supporting the findings of this study are available within the paper. The RNA-Seq and ATAC-Seq data have been deposited in the Gene Expression Omnibus [GEO Super-Series accession number GSE89309 (GSE89307 for RNA-Seq, GSE89308 for ATAC-Seq]. Source Data are provided with the online version of the paper. Additional information and materials will be made available upon request.


