Abstract
Background
MRI has been used to acutely visualize radiofrequency (RF) ablation lesions but its accuracy in predicting chronic lesion size is unknown. The main goal of this study was to characterize different areas of enhancement in late gadolinium enhancement (LGE) MRI done immediately after ablation to predict acute edema and chronic lesion size.
Methods and Results
In a canine model (n=10), ventricular RF lesions were created, using ThermoCool SmartTouch (Biosense Webster) catheter. All animals underwent MRI (LGE and T2-weighted (T2w) edema imaging), immediately after ablation and after 1, 2, 4 and 8 weeks. Edema, microvascular obstruction (MVO) and enhanced volumes were identified in MRI and normalized to chronic histological volume. Immediately after contrast administration, the MVO region was 3.2 +/− 1.1 times larger than the chronic lesion volume in acute MRI. Even 60 mins after contrast administration, edema was 8.73 +/− 3.31 times and the enhanced area 6.14 +/− 2.74 times the chronic lesion volume. Exponential fit to the MVO volume was found to be the best predictor of chronic lesion volume at 26.14 (95% prediction interval 24.35 – 28.11) mins after contrast injection. The edema volume in LGE correlated well with edema volume in T2w MRI with an R2 of 0.99.
Conclusion
MVO region on acute LGE images acquired 26.1 min after contrast administration can accurately predict the chronic lesion volume. We also show that T1-weighted MRI images acquired immediately after contrast injection accurately shows edema resulting from RF ablation.
Keywords: catheter ablation, ablation, magnetic resonance imaging, edema, microvascular obstruction, acute ablation, chronic ablation
Journal Subject Terms: Catheter Ablation and Implantable Cardioverter-Defibrillator, Magnetic Resonance Imaging (MRI), Animal Models of Human Disease
Introduction
Radiofrequency (RF) ablation is routinely used to treat different cardiac arrhythmias.1 Ablation success depends on creating permanent lesions and so when ablating physicians check for successful pulmonary vein isolation using functional techniques. However, it is not uncommon for electrical connection to be re-established.2, 3 Prior studies have shown that the temporary isolation could be due to edema in the ablated area.4 While MRI is excellent at characterizing soft tissue and has been used to visualize ablation lesions5, 6 the ability of MRI performed acutely after lesion creation to predict final scar size is uncertain.7 Much more certain is the use of Late Gadolinium Enhancement (LGE) MRI is to detect permanent myocardial scar but only when images are acquired well after either ablation or myocardial infarction.8 A further motivation to establish lesion size from acute MRI comes from developing real time MRI based ablation solutions.9, 10 For any of these uses of acute MRIs to be effective, it is essential to know the characteristics of acutely visualized lesions and their relationship to permanent scar.
The acute myocardial response to RF ablation includes tissue injury that limits perfusion of the injured area due to disruption of blood vessels. This phenomenon is known as micro vascular obstruction (MVO) and these areas are referred to as the “no-reflow” or “low reflow” regions.11, 12 These areas of “no-reflow” enhance slowly over a period of time and is highly dependent on delay in time between contrast injection and LGE MRI acquisition. As a result, the ideal timing between contrast injection and time to image that will accurately predict the chronic lesion size is unknown. Another facet of tissue response to RF ablation is reversible acute edema which can temporarily disrupt electrical propagation.4 As with no re-flow, the extent of edema and the time line of its resolution is not fully characterized. The edema caused by RF ablation has been visualized by T2 weighted (T2w) MRI, but can also appear in LGE MRI as enhanced areas with different temporal characteristics of enhancement and resolution. In this study, we characterize the LGE-MRI for acute and maturing ablation lesions with the goal of using acute MRI to predict acute edema as well the size of chronic ablation lesion.
Methods
Electrophysiology Study and Ablation Procedure
A canine model (n=10) was used for this study. The study protocol was approved by Institutional Animal Care and Use Committee. Animals were sedated using propofol and then intubated for general anesthesia using Isoflurane (1–3%). Percutaneous femoral venous access was obtained bilaterally. A 5 Fr sheath was placed in the femoral artery for continuous arterial pressure monitoring. Left sided access was obtained by going transeptal under intra cardiac echocardiogram (ICE) and fluoroscopic guidance using a SL0 sheath and a BRK-1 (St Jude Medical) needle. A fast-anatomical map (FAM) of the left and right ventricle was made using CARTO3 (Biosense Webster). We used ThermoCool SmartTouch (Biosense Webster) catheter to deliver radiofrequency ablation lesions in the left and the right ventricle using 25W or 40W power for 30 secs under power control mode. The lesion location was marked on the FAM. A total of 3 to 4 distinct lesions were placed within the two chambers. After the ablation procedure, the animal was moved to the MRI suite and while intubated and sedated underwent MRI as described below. After the initial ablation, the animal was extubated and recovered. The animals underwent a second round of ablation after 12 weeks and these lesions are referred to as acute lesions. The initial lesions that had 3 months to mature are referred to as chronic lesions. The initial FAM was used to guide the repeat ablation to deliver lesions at distinct locations away from the initial lesions. The animals underwent a repeat MRI immediately after the second ablation. The animals were then euthanized and the heart removed for lesion assessment including Masson’s Trichrome staining.
MRI
MRI studies were performed in 3 Tesla clinical MR scanners (Verio and Trio, Siemens Healthcare, Erlangen, Germany). The MRI was repeated 1, 2, 4 and 8 weeks after ablation. LGE-MRI: Contrast (0.1 mmol/kg of Gd-BOPTA, Multihance, Bracco Diagnostic Inc., Princeton, NJ, USA) was injected and 3D LGE-MRI was acquired repeatedly after the injection to validate the ablation lesions for about an hour with increasing time delay between contrast injection and image acquisition. For the 3D LGE the protocol used was: respiratory navigated, ECG triggered, inversion recovery prepared 3D GRE pulse sequence with spatial resolution = 1.25×1.25×2.5 mm, repetition time (TR) = 3.1 ms, echo time (TE) = 1.4 ms, flip angle = 14 degrees, inversion time (TI) = 210–390 ms, and whole heart coverage. The midpoint of the scan was taken as the time of scan when tabulating the lesion size in MRI after contrast injection. Prior to contrast administration the animals also underwent a T2 weighted edema imaging using respiratory navigated, ECG triggered, double inversion (DIR) prepared 2D turbo spin echo (TSE) pulse sequence with TE=81 ms, TR=3 cardiac cycles, echo train length=21, fat suppression using SPAIR, in-plane resolution of 1.25×1.25 mm, and slice thickness of 4 mm.
Lesion Size Quantification
The harvested hearts were fixed in 10% buffered formalin solution. The hearts were then sectioned, with a slice thickness of 2 mm. Corresponding lesions in MRI, FAM and pathology were identified. Then for chronic lesions the volume of the lesion was calculated from digital images of both sides of each slice was obtained. The area of the lesion (average of the calculated area on the two sides of the slice) was multiplied with the slice thickness to etimate the lesion volume for each slice. For slices that had lesion only on one side of the slice, the depth of the lesion and area of the lesion on the surface that had the lesion was used to calculate the volume of the lesion in that slice assuming a conical shape. The volume across all the slices for each lesion was added to get the total lesion volume.
On the MR images, MVO was defined as the dark region in the middle of the enhanced region. The enhanced area was defined as the bright ring around MVO region and it includes the MVO area. We defined edema area as the bright region around the enhanced ring that had a lower degree of enhancement. Figure 1 illustrates the appearance of MVO, enhanced and edema areas on the LGE MRI. In order to calculate the volumes from MR images, the Seg3D software (SCI Institute, University of Utah) was used to segment different regions of each lesion in MRIs and compute the volume. The boundary between the different regions was manually defined for each slice. For each lesion, the volume calculated from MRIs was normalized to the actual chronic volume on pathology for that lesion to make a better comparison with the chronic lesion sizes. Further, we sent samples of chronic and acute lesions for sectioning and histology. The slices were stained using Masson’s Trichrome staining protocol.
Figure 1.
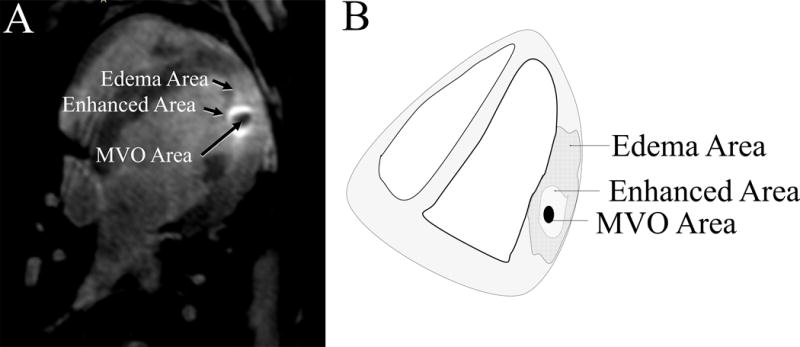
A) The appearance of MVO, enhanced and edema areas on the MRI (Week 0). The enhanced ring is the brightest region around the dark region of MVO. The Edema area is the larger area than enhances beyond the ring of highest intensity. B) The schematic for appearance of MVO, enhanced and edema areas on the MRI, shows how the regions were selected.
Statistical Analysis
As the edema, enhancement and the MVO volumes were repeatedly measured for each lesions, the correlated data structured was considered in our statistical analysis. Lesions were treated as clusters, and measurements within each lesion were considered as correlated. However, measurements across lesions were considered as independent. A generalized estimating equation (GEE) method13 was used to estimate the difference in volume between the edema and enhancement areas and to test if the difference were statistically different from zero. The “compound symmetry” (or “exchangeable”) pattern was used as the working correlation structure in the linear model using GEE.
Paired t-tests were used to compare the mean volume between the region of edema and enhancement areas. Similarly, paired t tests were performed to compare the mean volume of edema assessment in LGE MRI versus T2w MRI.
An exploratory analysis for relationship between the injection time and mvo was performed by using the scatter plots. After the exploratory analysis, we found that an exponential decay model was appropriate for the relationship between the normalized MVO volume and contrast time delay (mins). Hence, a log-linear relationship was considered between the MVO and injection time. Since the MVOs was also measured repeatedly within lesions, the correlated data structured was also considered here. A log-linear model for Gaussian data was fit, by using the GEE method, to the observed data so that the predicted curve of normalized MVO volume was an exponential function of the contrast injection time (mins).
After fitting the log-linear model, predicted curve of normalized MVO volume was plotted versus all possible values of the injection times within the range all possible observational times. The 95% prediction intervals were also plotted with the predicted curve. The 95% prediction interval was calculated using the “Delta” method based on the estimated variance-covariance matrix of the parameter coefficients in the log-linear model.14 The optimal time-delay was obtained as the time when the predicted normalized MVO volume = 1, and the interval of the optimal time delay was between the time when the lower bound of the 95% prediction interval of normalized MVO volume crosses 1 and when the upper bound of the interval crossed 1.
Statistical analytical package R (www.r-project.org) version 3.3 and Stata (Stata Corp., College Station, TX, USA) version 13 were used to perform the statistical analyses. All tests were two-sided and P-values less than 0.05 indicated statistical significant results.
Results
Thirty chronic lesions and 48 MRI sessions were analyzed. The comparison of acute and chronic lesions on the LGE MRI, pathology and histology is shown in figure 2. On the LGE MRI, the acute lesion is characterized with a hypointense MVO region in middle, encircled with an enhancement ring. In the gross pathology the acute lesions have a white central core region with a dark black ring around it (figure 2 B). Histology shows clear distinction between acute and chronic lesions. For acute lesions, as shown in figure 2C, the histology shows a central core region that has the most disruption which gradually approaches features of normal tissue as we move away from the core of the lesion. In the chronic lesion (figure 2D), we can see a very well defined boundary between the area with well-defined scar in blue and normal myocardium.
Figure 2.
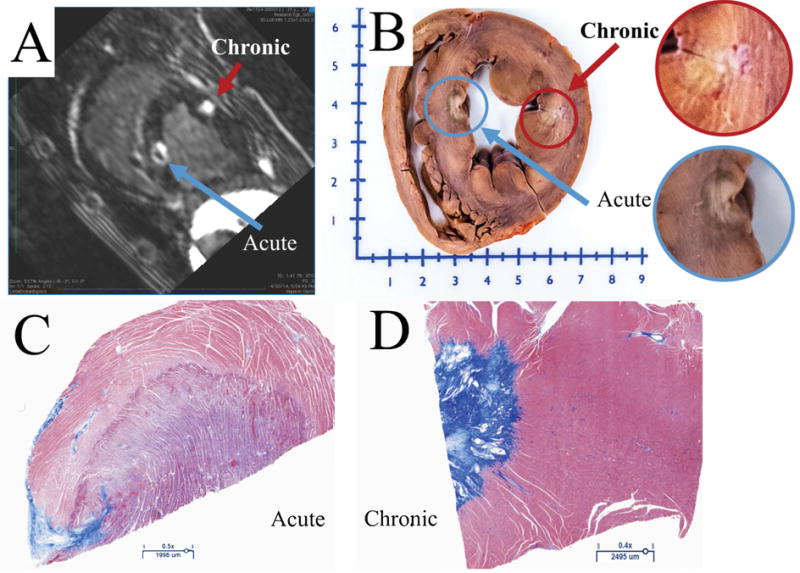
A) Short axis view from LGE-MRI scan showing acute and chronic RF lesions. The chronic lesion is characterized with a single enhanced area, while acute lesion consists of three: MVO, enhanced and edema areas. B) Gross pathology showing acute and chronic lesions. C) The histology of an acute lesion. D) The histology of a chronic lesion with Masson’s Trichrome staining.
Figure 3 illustrates the LGE-MRI appearance of a lesion after different time intervals between contrast administration and image acquisition over an 8-week period. Figure 3 shows that the MVO area is still present up to 40 mins after contrast injection at Week 0 (acquired immediately after ablation) but the whole area enhances almost completely within the first 10 mins in 4 weeks. It also shows a consistent finding of a large area beyond the MVO that enhances rapidly at week 0 but that enhancement does not take place from week 2 onwards.
Figure 3.
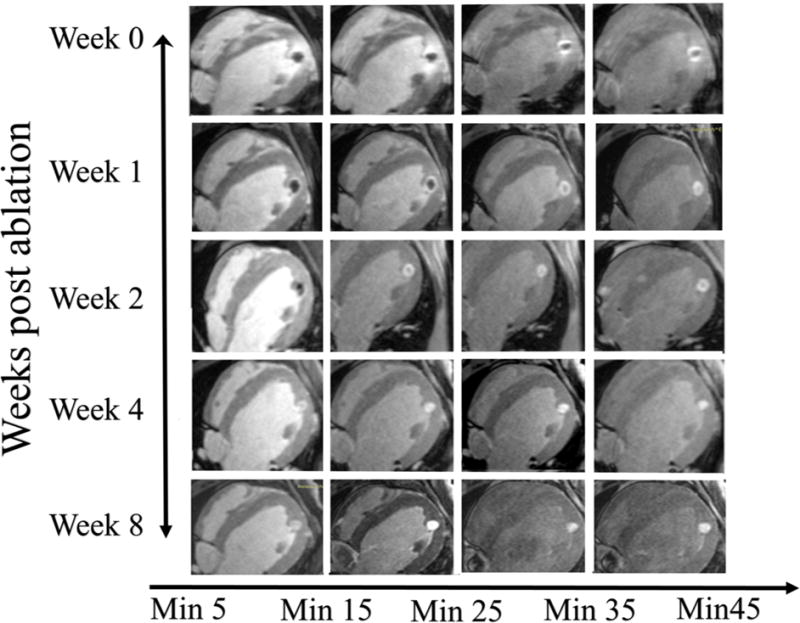
An example of the appearance of a lesion on the LGE MRI at different time points (Week 0, 1, 2, 4 and 8) and with different delays between contrast injection and image acquisition. On week 0 images have edema, enhanced and MVO regions. Edema starts to fade with delay after contrast injection while the enhanced and MVO areas are still clearly visible even after 45 mins since contrast injection. At week 1, the there is no edema and MVO volume decreases faster with time delay after contrast injection as compared to week 0. At week 2, the MVO region decreases even faster and is completely enhanced in 30 mins. By week 4 and 8 there is no MVO and lesion fully enhances as contrast is injected.
In figure 4A we plot the normalized volume of the three distinct regions, namely the edema area, the enhanced area (referring to the ring of enhancement around the MVO which starts as a bright rim and includes the MVO region) and the MVO region with the delay in time from contrast administration to LGE-MRI acquisition immediately after lesion creation. These MRI based volumes are normalized to the chronic lesion volume for the respective lesion based on the pathological assessment. The edema area (8.73 ± 3.31 normalized volume) and enhanced area (6.14 ± 2.74 normalized volume) from acute (week 0) MRI scans are both significantly larger than the actual chronic scar volume. The normalized MVO volume is also significantly larger than final scar volume right after contrast injection (3.2±1.1 at minute 5.6) but it decreases over time asymptotically approaching zero over time.
Figure 4.

A) The normalized values for, edema, enhanced and MVO volumes with time delay after contrast administration and MRI acquisition for week 0. B) Normalized MVO volume (normalized to chronic lesion size) with delay in time after contrast administration and MRI acquisition. The exponential fit crosses the y=1 line at 26.1 min indicating the ideal time delay to acquire the MVO images to predict the chronic lesion size. The 95% predicted interval curve fits are also shown.
We investigated the relationship between the chronic scar volume and the MVO volume at different delays after contrast administration (in minutes) to find the optimal time delay for predicting the chronic scar volume. We fit a log-linear model (for Gaussian data) using the GEE method in order to obtain the exponential curve of normalized MVO volume as a function of the contrast injection time delay (figure 4B) as it characterizes the contrast diffusion by which this area enhances over time. The resulting exponential curve is given by Y = 5.123e−0.0625X or ln(Y)=1.634-0.0625(X) where Y is the predicted value of normalized MVO volume and X is the time delay in minutes after contrast administration. The normalized MVO volume in images acquired after a delay of 26.14 mins (The 95% prediction interval: 24.35 to 28.11 mins) predicts the chronic lesion volume (when normalized MVO volume = 1).
There was no edema visible after a week. At the week 1 MRI, the normalized volume of enhanced area was measured as 3.4±0.35, 4 minutes after contrast injection and decreased to 2.77±.30, 60 minutes post contrast injection. During the same time, the MVO area’s normalized volume decreased from 2.10±0.41 (4 minutes post contrast injection) to 0.40±0.30 (60 minute post contrast injection). The normalized volume for enhanced area at week 2 started at 3.64 ±.35 (4 minutes post contrast injection) and decreased to 2.07 ± 0.35 (37 minutes post ablation). At, week 4, the normalized volume for enhanced area starts at 1.64±0.11 (5 minutes post contrast injection) and decreases to 1.15±0.10 (37 minutes post contrast injection). Similarly, the normalized volume for MVO started at 0.31±.10 and decreased to 0.03±0.04. At week 8, the normalized volume for enhanced area started at 1.03±0.03 (4 minutes after contrast injection) and decreased to 0.85±0.04 (58 minutes after contrast injection). 8 weeks after ablation there is hardly any MVO area and the enhanced area was close to the chronic lesion volume. Figure 5 shows the volumes of the enhanced area and the MVO area as seen in LGE-MRI at weeks 1, 2, 4 and 8 and as it changes with time after contrast injection. A total of 248 pairs of normalized volumes were used to compare the mean volume between the region of edema and enhancement. Table 1A summarize the volume of edema and enhancement areas at the 248 measurements in the longitudinal data summary format, as the 248 measurements are from 34 lesions. The mean normalized volume of the edema region was 8.53 (95% CI: 8.12 to 8.94), and the mean normalized volume of the enhancement region was 5.92 (95% CI: 5.59 to 6.24). The difference in normalized volumes between the two regions is 2.61 (95% CI: 2.41 to 2.82). The generalized estimating equation (GEE) method was used to estimate the difference in normalized volume between edema and enhancement regions, in which lesions are treated as clusters and exchangeable correlation structure was used for the repeated volume measurements within each lesion. Our result from GEE method showed a statistically significant difference in volume between the two regions (P<0.001), with an estimated difference of 2.681 (95% CI: 2.358 – 3.002; Table 1 B).
Figure 5.
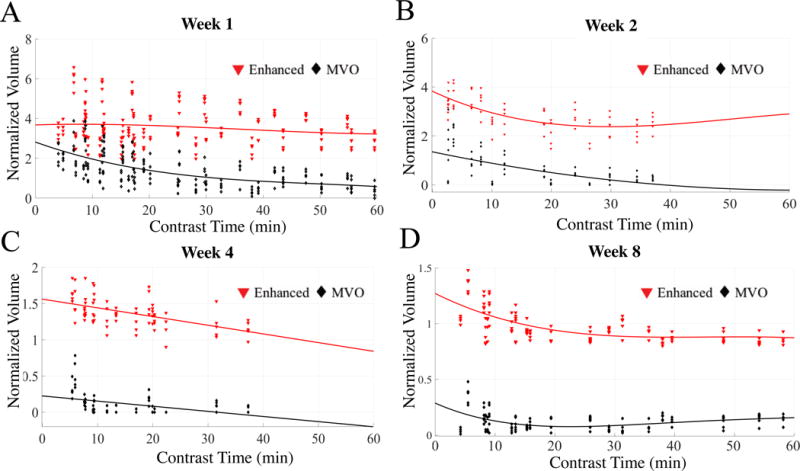
Normalized volumes of the enhanced and MVO area at week 1 (A), week 2 (B), week 4 (C) and week 8 (D) after lesion formation with delay in time after contrast injection and MRI acquisition. A) The enhanced and MVO volumes at week 1 are much larger than chronic lesion volume. B) Enhanced and MVO areas at week 2 show similar trend as week 1 but the decay in MVO volume is much faster and is completely enhanced by 30 mins. C) The enhanced and MVO volumes are much smaller by week 4. D) By week 8 the enhanced region starts to approximate the chronic lesion size.
Table 1.
| (A) Summary of Edema and Enhancement measurements | |||||
|---|---|---|---|---|---|
| Variable | Mean | SD. | Min | Max | Observations |
| Edema | |||||
| overall | 8.536 | 3.283 | 3.470 | 24.240 | N = 248 |
| between | 1.592 | 5.564 | 12.893 | n = 33 | |
| within | 2.862 | 2.483 | 19.883 | ||
| Enhancement | |||||
| overall | 5.919 | 2.594 | 1.931 | 20.04 | N = 248 |
| between | 1.595 | 3.134 | 9.531 | ||
| within | 2.032 | 1.114 | 16.428 | ||
| (B) GEE Model: Estimate and 95% CI of difference between edema and enhancement measurements | ||||
|---|---|---|---|---|
| Estimate | Robust SE | P-Value | 95% Conf. Interval | |
| Diff. between Edema & Enhancement | 2.681 | 0.164 | <0.001 | 2.358 – 3.002 |
To further assess the LGE-MRI derived edema area we compared it to the T2w edema imaging for acute lesions. Figure 6 shows examples of the area of enhancement seen in the T2w and the corresponding area in LGE-MRI showing a good correlation. Figure 7 shows the quantitative comparison between the area of enhancement on T2w MRI and LGE-MRI derived edema area. We also used the paired t tests to compare the mean volume of edema assessment in LGE MRI and that in T2w MRI. The volumes were 967.31 mm3 and 954.60 mm3 for LGE-MRI derived edema and T2w MRI enhancement, respectively, and correlated well with a R2 of 0.99 (figure 7).
Figure 6.
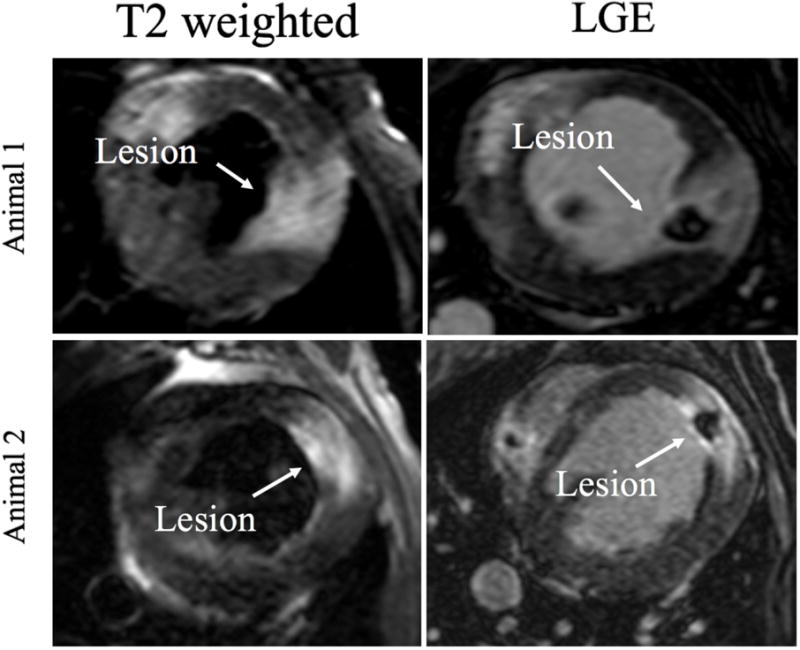
T2w(left) and LGE (right) images at week 0 for two corresponding lesions. Edema on T2w images (arrow pointing to the lesion) corresponds well to the area of enhancement in LGE MRI.
Figure 7.
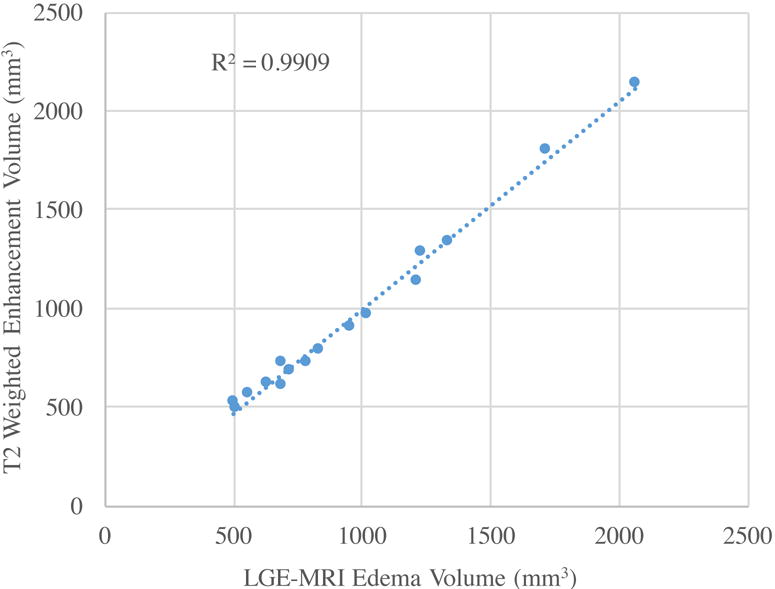
Plot showing the correlation between areas of enhancement in T2w MRI and the LGE-MRI acquired at week 0.
Discussion
In the last few years we have made significant progress in developing new technology for better lesion creation like catheters with contact force information or using different forms of energy.15 Despite all these advances we still use indirect parameters to assess lesion creation including functional assays to test for conduction block. MRI has excellent soft tissue visualization capabilities and has been used to characterize ablation lesions before.5, 6 There is a growing effort to develop real time electrophysiological systems to both create ablation lesions and verify the tissue changes in real time.16 Here, for the first time we show that LGE-MRI done acutely after ablation can quantify edema in the tissue and correlate the acute MRI findings with chronic lesion formation.
LGE-MRI done acutely after radiofrequency ablation shows an area of no enhancement (MVO region) at the core of the lesion. Here we show that this region can take more than 60 mins to fully enhance in acute MRIs. The MVO region decreases with time after contrast administration in an exponential manner. We have also shown that the size of the MVO region in images acquired 26.1 mins after contrast injection closely predicts the final scar size (figure 4B). We can eliminate wait time after ablation by using the no-reflow region as indicator for creation of a permanent scar and can also use it to estimate the size of the lesion based on the enhancement dynamics. The MVO region itself represents the core of the lesion where all vasculature is destroyed and hence enhancement in that area is likely to be a diffusive process. This study was done in a canine model so we should be cautious in extrapolating it to humans as changes in myocardial vascularity can affect the contrast kinetics. But as the MVO region enhancement is likely to be a diffuse process, changes in tissue vascularity in the surrounding tissue are going to play a diminished role in contrast kinetics.
A prior study estimating the MVO region immediately post contrast also showed good correlation with scar seen 3 months later.11 That study done in the left atrium also showed scar coming from other regions including normal, untreated regions, but that is more likely due to changes in atrial size and shape between scans done months apart.11
Non-contrast T1 weighted imaging has also been described to characterize tissue changes acutely after ablation.17, 18 The areas that enhance in the acute non-contrast T1 weighted imaging correlate with regions of necrosis in histology but further studies are needed to show its correlation with chronic scar. We have outlined a detailed characterization of the LGE MRI imaging of acute and chronic ablation lesions showing edema and the MVO region that will result in scar including contrast kinetics that can be used to estimate chronic scar size.
Edema creation is an integral part of any radiofrequency ablation but there is no quantitative means of assessing it during clinical procedures. This edema does play a significant role in long term outcomes after ablation and is thought to be at least partly responsible for electrical reconnection between ablated areas.4 Using the traditional functional approaches for testing isolation has not always translated to long term scar and this has been shown to be a cause for arrhythmia recurrence.19, 20 LGE-MRI is normally not associated with visualizing edematous areas and traditionally we have used T2w MRI images to assess edema. Due to the unique nature of acute ablation lesions and the rim of enhancement that is created around a central core of the ablation lesion here we show that we can use LGE-MRI to identify edematous areas in the ablated myocardial tissue (figures 6 and 7). The area of higher intensity around the enhanced rim matches well with the enhanced area in the T2w MRIs. The mechanism of enhancement of this area is likely very different from the mechanism of enhancement of the MVO area as it enhances quite rapidly after contrast injection and also normalizes well before the MVO area is even fully enhanced (Figure 3). When evaluating histology of acute lesions (figure 2C) there is a large area extending almost a centimeter beyond the core of the lesion where the normal tissue architecture is disrupted. This histological tissue changes after acute ablation has been characterized before as a core of severe coagulation necrosis with a peripheral zone of contraction band necrosis.5 This zone is further surrounded by a rim of intact myocardial cells exhibiting edema.5 We see the same changes and this rim of tissue with edema but intact cells likely explains the quick wash in and wash out of the contrast in this edema region. The edematous area recovers well within a week as there is hardly any edema area seen even in week 1 scans. To further validate our area of enhancement in LGE-MRI we compared that area to T2w area and there is good agreement between the two. This further indicates that acquiring just an LGE-MRI within minutes after ablation can show areas of edema along with areas of permanent damage that will result in scar. This will go a long way in making immediate post ablation scans more efficient as we get closer to implementing real time MRI ablation systems.
Conclusion
We have characterized the acute and chronic LGE-MRI response of ablation lesions. LGE-MRI images acquired immediately after ablation can not only predict area and size of permanent scar but can also be used to identify edema. The very large area of edema recovers with a week but the lesion maturation process takes 8 weeks. We have also shown that edema as seen in LGE MRI correlated well with T2w MRI and is in agreement with the large area of tissue edematous as seen in histology of acute lesions.
Supplementary Material
WHAT IS KNOWN?
Radiofrequency ablation lesions can be visualized acutely using Late Gadolinium Enhancement MRI with a central region of no enhancement (MVO region) surrounded by a ring of enhancement.
Reversible edematous is also well recognized feature of ablation that can disrupt electrical propagation.
WHAT THE STUDY ADDS?
The acute post ablation T1-weighted MRI acquired immediately after contrast administration can characterize edema in acute lesions.
The central no enhancement MVO region, acquired 26 mins after contrast administration reliably predicts chronic lesion size.
Acknowledgments
Funding Sources: This work was partly supported in part by a Biosense Webster research grant to University of Utah with Ravi Ranjan as the PI. Ravi Ranjan is also supported by NIH grant K23HL115084 and Seg3D software development was supported by the National Institute of General Medical Sciences of the NIH under grant number P41 GM103545-18
Disclosures: Ravi Ranjan has research grants from St. Jude Medical, Medtronic and Biosesnse Webster and is a consultant to St. Jude Medical.
References
- 1.Aliot EM, Stevenson WG, Almendral-Garrote JM, Bogun F, Calkins CH, Delacretaz E, Bella PD, Hindricks G, Jais P, Josephson ME, Kautzner J, Kay GN, Kuck KH, Lerman BB, Marchlinski F, Reddy V, Schalij MJ, Schilling R, Soejima K, Wilber D. EHRA/HRS Expert Consensus on Catheter Ablation of Ventricular Arrhythmias: developed in a partnership with the European Heart Rhythm Association (EHRA), a Registered Branch of the European Society of Cardiology (ESC), and the Heart Rhythm Society (HRS); in collaboration with the American College of Cardiology (ACC) and the American Heart Association (AHA) Europace. 2009;11:771–817. doi: 10.1093/europace/eup098. [DOI] [PubMed] [Google Scholar]
- 2.Ouyang F, Antz M, Ernst S, Hachiya H, Mavrakis H, Deger FT, Schaumann A, Chun J, Falk P, Hennig D, Liu X, Bansch D, Kuck KH. Recovered pulmonary vein conduction as a dominant factor for recurrent atrial tachyarrhythmias after complete circular isolation of the pulmonary veins: lessons from double Lasso technique. Circulation. 2005;111:127–135. doi: 10.1161/01.CIR.0000151289.73085.36. [DOI] [PubMed] [Google Scholar]
- 3.Cheema A, Dong J, Dalal D, Marine JE, Henrikson CA, Spragg D, Cheng A, Nazarian S, Bilchick K, Sinha S, Scherr D, Almasry I, Halperin H, Berger R, Calkins H. Incidence and time course of early recovery of pulmonary vein conduction after catheter ablation of atrial fibrillation. Journal of cardiovascular electrophysiology. 2007;18:387–391. doi: 10.1111/j.1540-8167.2007.00760.x. [DOI] [PubMed] [Google Scholar]
- 4.Ranjan R, Kato R, Zviman MM, Dickfeld TM, Roguin A, Berger RD, Tomaselli GF, Halperin HR. Gaps in the Ablation Line as a Potential Cause of Recovery from Electrical Isolation and their Visualization using MRI. Circulation Arrhythmia and electrophysiology. 2011;4:279–286. doi: 10.1161/CIRCEP.110.960567. [DOI] [PMC free article] [PubMed] [Google Scholar]
- 5.Dickfeld T, Kato R, Zviman M, Lai S, Meininger G, Lardo AC, Roguin A, Blumke D, Berger R, Calkins H, Halperin H. Characterization of radiofrequency ablation lesions with gadolinium-enhanced cardiovascular magnetic resonance imaging. J Am Coll Cardiol. 2006;47:370–378. doi: 10.1016/j.jacc.2005.07.070. [DOI] [PMC free article] [PubMed] [Google Scholar]
- 6.Dickfeld T, Kato R, Zviman M, Nazarian S, Dong J, Ashikaga H, Lardo AC, Berger RD, Calkins H, Halperin H. Characterization of acute and subacute radiofrequency ablation lesions with nonenhanced magnetic resonance imaging. Heart rhythm. 2007;4:208–214. doi: 10.1016/j.hrthm.2006.10.019. [DOI] [PMC free article] [PubMed] [Google Scholar]
- 7.Kim RJ, Chen EL, Lima JA, Judd RM. Myocardial Gd-DTPA kinetics determine MRI contrast enhancement and reflect the extent and severity of myocardial injury after acute reperfused infarction. Circulation. 1996;94:3318–26. doi: 10.1161/01.cir.94.12.3318. [DOI] [PubMed] [Google Scholar]
- 8.Kim RJ, Fieno DS, Parrish TB, Harris K, Chen EL, Simonetti O, Bundy J, Finn JP, Klocke FJ, Judd RM. Relationship of MRI delayed contrast enhancement to irreversible injury, infarct age, and contractile function. Circulation. 1999;100:1992–2002. doi: 10.1161/01.cir.100.19.1992. [DOI] [PubMed] [Google Scholar]
- 9.Nazarian S, Kolandaivelu A, Zviman MM, Meininger GR, Kato R, Susil RC, Roguin A, Dickfeld TL, Ashikaga H, Calkins H, Berger RD, Bluemke DA, Lardo AC, Halperin HR. Feasibility of real-time magnetic resonance imaging for catheter guidance in electrophysiology studies. Circulation. 2008;118:223–9. doi: 10.1161/CIRCULATIONAHA.107.742452. [DOI] [PMC free article] [PubMed] [Google Scholar]
- 10.Schmidt EJ, Mallozzi RP, Thiagalingam A, Holmvang G, d’Avila A, Guhde R, Darrow R, Slavin GS, Fung MM, Dando J, Foley L, Dumoulin CL, Reddy VY. Electroanatomic mapping and radiofrequency ablation of porcine left atria and atrioventricular nodes using magnetic resonance catheter tracking. Circulation Arrhythmia and electrophysiology. 2009;2:695–704. doi: 10.1161/CIRCEP.109.882472. [DOI] [PubMed] [Google Scholar]
- 11.McGann C, Kholmovski E, Blauer J, Vijayakumar S, Haslam T, Cates J, DiBella E, Burgon N, Wilson B, Alexander A, Prastawa M, Daccarett M, Vergara G, Akoum N, Parker D, MacLeod R, Marrouche N. Dark regions of no-reflow on late gadolinium enhancement magnetic resonance imaging result in scar formation after atrial fibrillation ablation. J Am Coll Cardiol. 2011;58:177–185. doi: 10.1016/j.jacc.2011.04.008. [DOI] [PMC free article] [PubMed] [Google Scholar]
- 12.Judd RM, Lugo-Olivieri CH, Arai M, Kondo T, Croisille P, Lima JA, Mohan V, Becker LC, Zerhouni EA. Physiological basis of myocardial contrast enhancement in fast magnetic resonance images of 2-day-old reperfused canine infarcts. Circulation. 1995;92:1902–10. doi: 10.1161/01.cir.92.7.1902. [DOI] [PubMed] [Google Scholar]
- 13.Fitzmaurice GM, Laird NM, Ware JH. Applied Longitudinal Data Analysis. 2nd. Wiley; 2001. [Google Scholar]
- 14.Casella G, Berger RL. Statistical Inference. 2nd. Pacific Grove, CA: Brooks/Cole Pub. Co.; 2002. [Google Scholar]
- 15.Thiagalingam A, D’Avila A, Foley L, Guerrero JL, Lambert H, Leo G, Ruskin JN, Reddy VY. Importance of catheter contact force during irrigated radiofrequency ablation: evaluation in a porcine ex vivo model using a force-sensing catheter. Journal of cardiovascular electrophysiology. 2010;21:806–11. doi: 10.1111/j.1540-8167.2009.01693.x. [DOI] [PubMed] [Google Scholar]
- 16.Kholmovski EG, Coulombe N, Silvernagel J, Angel N, Parker D, Macleod R, Marrouche N, Ranjan R. Real-Time MRI-Guided Cardiac Cryo-Ablation: A Feasibility Study. Journal of cardiovascular electrophysiology. 2016;27:602–8. doi: 10.1111/jce.12950. [DOI] [PMC free article] [PubMed] [Google Scholar]
- 17.Celik H, Ramanan V, Barry J, Ghate S, Leber V, Oduneye S, Gu Y, Jamali M, Ghugre N, Stainsby JA, Shurrab M, Crystal E, Wright GA. Intrinsic contrast for characterization of acute radiofrequency ablation lesions. Circulation Arrhythmia and electrophysiology. 2014;7:718–27. doi: 10.1161/CIRCEP.113.001163. [DOI] [PubMed] [Google Scholar]
- 18.Guttman MA, Tao S, Fink S, Kolandaivelu A, Halperin HR, Herzka DA. Non-contrast-enhanced T1 -weighted MRI of myocardial radiofrequency ablation lesions. Magnetic resonance in medicine: official journal of the Society of Magnetic Resonance in Medicine/Society of Magnetic Resonance in Medicine. 2017 doi: 10.1002/mrm.26750. [DOI] [PMC free article] [PubMed] [Google Scholar]
- 19.Parmar BR, Jarrett TR, Burgon NS, Kholmovski EG, Akoum NW, Hu N, Macleod RS, Marrouche NF, Ranjan R. Comparison of left atrial area marked ablated in electroanatomical maps with scar in MRI. Journal of cardiovascular electrophysiology. 2014;25:457–63. doi: 10.1111/jce.12357. [DOI] [PMC free article] [PubMed] [Google Scholar]
- 20.Parmar BR, Jarrett TR, Kholmovski EG, Hu N, Parker D, MacLeod RS, Marrouche NF, Ranjan R. Poor scar formation after ablation is associated with atrial fibrillation recurrence. J Interv Card Electrophysiol. 2015;44:247–256. doi: 10.1007/s10840-015-0060-y. [DOI] [PMC free article] [PubMed] [Google Scholar]
Associated Data
This section collects any data citations, data availability statements, or supplementary materials included in this article.


