

Summary
Patients with non-small cell lung cancer (NSCLC) that have kinase-activating epidermal growth factor receptor (EGFR) mutations are highly responsive to first- and second-generation EGFR inhibitors. However, these patients often relapse due to a secondary, drug-resistant mutation in EGFR where the gatekeeper threonine is converted to methionine (T790M). Several third-generation EGFR inhibitors have been developed that irreversibly inactivate T790M-EGFR while sparing wild-type EGFR, thus reducing epithelium-based toxicities. Using chemical proteomics, we show here that individual T790M-EGFR inhibitors exhibit strikingly distinct off-target profiles in human cells. The FDA-approved drug osimertinib (AZD9291), in particular, was found to covalently modify cathepsins in cell and animal models, which correlated with lysosomal accumulation of the drug. Our findings thus show how chemical proteomics can be used to differentiate covalent kinase inhibitors based on global selectivity profiles in living systems and identify specific off-targets of these inhibitors that may impact drug activity and safety.
Keywords: proteomics, chemical probes, kinases, T790M-EGFR, covalent inhibitors, cathepsins, lysosomal accumulation
eTOC (In Brief)
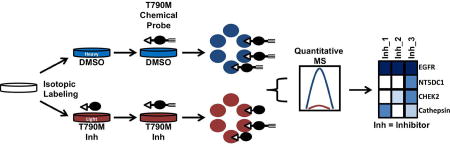
Niessen et al. explore the proteome-wide reactivity of third-generation T790M-EGFR inhibitors in human cancer cells and animal models through the development and application of chemical probes and quantitative mass spectrometry-based proteomic methods. These studies highlight the importance of performing global analyses of drug action in living systems to identify targets and off-targets that may impact efficacy and safety.
Introduction
Kinases are a major class of oncogenic signaling proteins and the focus of drug discovery programs for several types of cancer (Fleuren et al., 2016, Zhang et al., 2009). Originally developed kinase drugs are mostly reversible inhibitors that compete for binding with ATP to the kinase active site. More recently, a distinct class of drugs and chemical probes has emerged that covalently and irreversibly inhibits kinases by reacting with active-site cysteine residues (Liu et al., 2013). Key examples of covalent kinase inhibitors that have been approved as oncology drugs include: i) ibrutinib, which targets Bruton’s tyrosine kinase (BTK) to treat B cell malignancies (Winer et al., 2012); ii) afatinib, which targets the Epidermal Growth Factor Receptor (EGFR) for non-small cell lung cancers (Spicer and Rudman, 2010); and iii) osimertinib, a third-generation EGFR inhibitor designed to inhibit the drug-resistant T790M mutant form of this kinase (Wang et al., 2016). Cysteine-directed covalent drugs have also been approved for non-oncology indications, including, for instance, the multiple sclerosis therapy dimethyl fumarate (Linker and Haghikia, 2016).
Covalent drugs have several possible advantages over more conventional, reversible inhibitors, including the potential for more complete and sustained target engagement and prolonged pharmacodynamic effects dependent on the rate of protein turnover in cells (Johnson et al., 2010, Potashman and Duggan, 2009, Singh et al., 2011). These benefits, however, are counterbalanced by the risk for inadvertent or excessive covalent modification of other proteins in the proteome, which could lead to cell and/or organism toxicity. The special combination of opportunities and challenges afforded by covalent drugs has stimulated the emergence of methods to globally assess the protein reactivity of electrophilic small molecules in native biological systems (Johnson et al., 2010, Lee et al., 2014). Such approaches draw inspiration from chemical proteomic technologies such as activity-based protein profiling (ABPP) (Cravatt et al., 2008, Sanman and Bogyo, 2014, Patricelli et al., 2011) and have been used, for instance, to: i) provide target engagement assays for measuring the fraction of inhibited kinase in native biological systems (Advani et al., 2013), ii) identify targets and off-targets of covalent kinase inhibitors in human cells and to correlate these profiles with cytotoxicity (Lanning et al., 2014), and iii) more broadly map the portion of the human proteome that can interact with cysteine-directed small-molecule electrophiles (Backus et al., 2016).
We, and others, have used chemical proteomics to identify protein targets for a handful of covalent kinase drugs, including ibrutinib, afatinib, and the EGFR inhibitor canertinib (Lanning et al., 2014, Sun et al., 2016). These studies have revealed that each inhibitor possesses a unique set of off-targets that is not restricted to kinases, but rather includes proteins from many different classes, including several that contain conserved functional cysteine residues. Here, we sought to extend these initial findings by determining the proteome-wide reactivity of third-generation inhibitors for EGFR designed to selectively and irreversibly target the T790M drug-resistant mutant form of this kinase. All three inhibitors investigated – the recently approved osimertinib (Tagrisso, AZD9291; 1, Figure 1A), PF-06747775 (2, Figure 1A) and rociletinib (CO-1686; 3, Figure 1A) – were optimized for an EGFR inhibition profile that maintained good potency against the two original drug-sensitive, kinase-activating mutants (exon19Del and L858R) and the two major drug-resistant T790M mutants (exon19Del/T790M and L858R/T790M), while showing reduced activity against wild type (WT)-EGFR to minimize mechanism-based toxicity (Cross et al., 2014, Finlay et al., 2014, Tjin Tham Sjin et al., 2014, Walter et al., 2013, Planken et al., 2017). Our chemical proteomic studies reveal that, despite the highly engineered EGFR mutant inhibition profile achieved by all three third-generation inhibitors and their shared unsubstituted acrylamide reactive group, the inhibitors exhibited strikingly distinct proteome-wide reactivity profiles in human cancer cells. More in-depth characterization of the specific off-targets for each third-generation inhibitor revealed that inhibitor 1 reacts at high stoichiometry with multiple cathepsins in cell and animal models due to lysosomal accumulation of the drug. That these off-target interactions for 1 were not observed in vitro underscores the importance of performing chemical proteomic studies on drug action directly in living systems.
Figure 1. In Situ Proteome Reactivity of Third-Generation EGFR Inhibitors.

(A) Chemical structures of third-generation, T790M-EGFR-directed inhibitors (1–3) and their corresponding alkyne-modified chemical probes (4–6) and selected second-generation EGFR chemical probes (7, 8).
(B) In situ proteome reactivity of second- and third-generation EGFR probes in human cancer cells. H1975 cells, which express double-mutant L858R/T790M EGFR, were treated with designated probes (1 µM, 1 hr) and analyzed by gel-based ABPP. Sample lanes marked with * denotes half sample loaded for better visualization. Coomassie stain of gels demonstrated equal loading (Figure S2C).
(C) Competitive profiling of the proteomic reactivity of probes 4–6 with corresponding parent inhibitors 1–3. H1975 cells were pretreated with inhibitor (1–3; 10 µM, 2 hr) or DMSO followed by addition of probe (4–6; 1 µM, 4 hr) and then analyzed by gel-based ABPP. Specific competed protein targets are marked with <1–3 to indicate which of the inhibitor(s) competed probe labeling for these proteins. B indicates blank lanes. Coomassie stain of gels demonstrated equal loading (Figure S2C).
Results
Proteomic Profiling of Third-Generation EGFR Inhibitors in Human Cancer Cells
For our chemical proteomic studies, we synthesized an alkyne analogue of each third-generation EGFR inhibitor to enable detection, enrichment, and identification of covalently bound proteins using copper-catalyzed azide-alkyne cycloaddition (CuAAC or click chemistry (Rostovtsev et al., 2002)) with rhodamine-azide (for fluorescent detection) or biotin-azide (for enrichment) reporter groups (Speers and Cravatt, 2004). The co-crystal structures of double-mutant (DM)-EGFR (L858R/T790M) with inhibitors 2 and 3 and WT-EGFR with inhibitor 1 identified solvent-exposed positions (Figure S1 and (Yosaatmadja et al., 2015)) suitable for incorporation of an alkyne to furnish probes 4–6 (Figure 1A). Each inhibitor and probe pair (1/4, 2/5, 3/6) displayed similar potency for inhibition of phosphorylated EGFR (pY1068) in H1975 cells, which express L858R/T790M-EGFR, and equivalent intrinsic reactivity in a conjugation assay with glutathione (GSH) (Table S1). Moreover, competitive ABPP assays with probes 4–6 provided estimates of inhibitor 1–3 cross-reactivity with WT-EGFR, as measured in A431 cells, that matched those determined using pY1068-EGFR measurements (Table S2 and Figure S2A) and were generally consistent with other literature reports, where inhibitors 1 and 2 have been found to cross-react to a greater extent with WT-EGFR than inhibitor 3 (Planken et al., 2017). Finally, probes 4–6 showed much weaker labeling of WT-EGFR in A431 cells compared to probe 7 (Figure S2B), which was based on a second-generation inhibitor with potent WT-EGFR activity (Lanning et al., 2014). These data, taken together, indicate that the alkyne probes serve as valid surrogates for evaluating EGFR engagement and broader proteomic reactivity for the corresponding parent inhibitors. For our chemical proteomic studies, we also included representative probes based on second-generation EGFR inhibitors (7, 8) (Lanning et al., 2014), including a probe based on the approved drug afatinib (8) (Figure 1A).
For our initial studies, we treated H1975 cells in situ (cultured cells) with each probe (1 µM) for 1 hr, after which cells were lysed, fractionated, and probe-modified proteins detected by gel-based ABPP involving CuAAC to a rhodamine-azide reporter group followed by SDS-PAGE and in-gel fluorescence scanning. The three third-generation EGFR probes 4–6 showed lower proteomic reactivity compared to the afatinib-based probe 8, which, consistent with previous studies (Lanning et al., 2014), exhibited substantial protein labeling in cancer cells (Figures 1B and S2C). Among the third-generation inhibitors, probe 5 displayed the lowest overall proteomic reactivity, which enabled clear visualization of a ~170 kDa protein in the H1975 insoluble fraction (Figures 1B) that was presumed to be L858R/T790M-EGFR. Also in support of this conclusion, the 170 kDa protein reacted rapidly and to apparent completion with probes 4–6, which contrasted with the time-dependent increases in reactivity observed proteome-wide for these probes over a 24 hr incubation period in H1975 cells (Figure S3A).
Probe 5 showed a much more limited time-dependent increase in proteomic reactivity compared to probes 4 and 6 (Figure S3A). Similar results were obtained when probes were tested at a lower concentration (100 nM, Figure S3B) and in additional human cancer cell lines expressing various forms of EGFR, including H3255 (L858R-EGFR), PC-9 (Del19-EGFR), and A431 (WT-EGFR) cells (Figure S3B), where probe 5 consistently showed less proteomic reactivity compared to probes 4 and 6. Curiously, however, probes 4–6 showed similar in vitro (lysed cell preparations) proteomic labeling when tested in H1975 cell lysates (Figure S3C), indicating that the attenuated protein reactivity of probe 5 was a special in situ property of the compound.
Pre-treatment of H1975 cells with parent inhibitors 1–3 (10 µM, 2 hr) followed by corresponding probe treatment (4–6, respectively, 1 µM, 4 hr), revealed complete blockade of probe labeling for the ~170 kDa L858R/T790M-EGFR band (marked <1–3 to delineate the inhibitors that compete probe labeling, Figures 1C and S2C). This competition profile contrasted with that observed for WT-EGFR, as measured in A431 cells, where probe labeling of a 170 kDa protein (in this case, using probe 7 that targets WT-EGFR (Lanning et al., 2014)) was competed by second-generation inhibitors such as afatinib, but less substantially by the third-generation T790M-EGFR inhibitors 1–3 and the recently described T790M-EGFR inhibitor PF-06459988 (Cheng et al., 2016) when tested at a concentration of 100 nM (below the IC50 values of third-generation inhibitors for WT-EGFR) (Figure S3D). Additional protein targets beyond L858R/T790M-EGFR were identified for inhibitors 1 and 3, which, for instance, blocked corresponding probe 4 and 6 labeling of 22 kDa (marked <1 and <1,3; Figure 1C) and 50 kDa (marked <3; Figure 1C) proteins, respectively, in a concentration-dependent manner (Figure S3E). In contrast, no additional competed targets were observed by gel-based profiling for inhibitor 2 (Figure 1C).
These data, taken together, indicate that individual third-generation EGFR inhibitors exhibited distinct proteomic reactivity profiles in human cancer cells. We next set out to identify the proteins that react with each EGFR inhibitor.
Proteins That React With Third-Generation EGFR Inhibitors in Cancer Cells
We identified protein targets of third-generation EGFR inhibitors in H1975 cells using the quantitative, MS-based method ABPP-SILAC (Stable Isotope Labeling by Amino acids in Cell culture) (Lanning et al., 2014, Ong et al., 2002, Ong et al., 2003). Our initial experiments compared isotopically labeled cells treated with DMSO (‘light’ amino acid-labeled cells) versus chemical probes 4–6 (1 µM, 4 hr) (‘heavy’ amino acid-labeled cells). Treated cells were fractionated into soluble and insoluble proteomes and probe-modified proteins coupled to biotin-azide by CuAAC, enriched by streptavidin chromatography, and identified and quantified by LC-MS. The MS data from soluble and insoluble proteomes were then combined for each biological replicate, and probe-enriched proteins were defined as those that displayed average heavy/light ratios > 5 (calculated from a minimum of 10 quantified peptides summed across three biological replicates, where proteins were required to have been enriched and quantified in at least two of the three replicates). Applying these criteria, probes 4, 5, and 6 enriched 53, 12, and 133 proteins, respectively (Figure 2A), that are listed in Dataset S1 (tabs 1–3). The number of enriched proteins per probe generally aligned with the respective proteomic reactivities displayed by these probes in gel-based ABPP experiments (Figure 1 and Figure S3). Among the proteins enriched by all three probes was the intended target EGFR (Figure 2A, EGFR highlighted in red).
Figure 2. Mapping Targets for Third-Generation EGFR Inhibitors by Quantitative Mass Spectrometry.

(A) MS-based identification of proteins enriched by probes 4–6. ABPP-SILAC experiments in H1975 cells treated with probe (4–6; 1 µM, 4 hr) or DMSO. Data represent the mean SILAC ratio value (probe/DMSO) for proteins across three biological replicates. Probe-enriched targets are defined as those with mean SILAC ratio values ≥ 5 (red dashed line), with an additional requirement of being detected and quantified in at least two of the three biological replicates.
(B) High-occupancy targets of inhibitors 1–3 determined by competitive ABPP-SILAC. H1975 cells were pretreated with inhibitor (1–3, 10 µM, 2 hr) or DMSO, followed by treatment with probe (4–6, respectively; 1 µM, 4 hr). Data represent the mean SILAC ratio value (DMSO + probe/inhibitor + probe) for proteins across three biological replicates. Black, blue, and red bars designate proteins competed by inhibitors 1, 2, and 3, respectively. High-occupancy competed proteins are defined as those with mean competition ratio values ≥ 5 (red dashed line), with an additional requirement of being detected and quantified in at least two of the three biological replicates. Competition ratios are plotted above and below the x-axis for the indicated inhibitors as a log2 of the mean SILAC ratio (DMSO/inhibitor). NC = Not competed. NF = Not found.
(C) Heat map illustrating competition ratios displayed in (B). Maximum quantifiable competition (SILAC competition ratio of 20) is shown in dark blue while minimum competition (SILAC competition ratio of 1) is shown in light blue. Gray designates proteins that were not enriched and detected by the indicated probe.
The second stage of our ABPP-SILAC analysis involved characterizing inhibitors 1–3 by competitive profiling, where ‘light’ and ‘heavy’ cells were pre-treated with inhibitor (10 µM, 2 hr) or DMSO, respectively, followed by the corresponding probe 4–6 (1 µM, 4 hr). These experiments identified 16 “high-occupancy” targets, defined as proteins that were substantially engaged by one or more of inhibitors 1–3 (heavy:light ratios of > 5; Figure 2B, C, Table 1, and Table S3). Only five of these high-occupancy targets were kinases, three of which – EGFR, ERBB2 and TEC – have a similarly positioned active-site cysteine residue (Leproult et al., 2011, Liu et al., 2013) and were engaged by all three inhibitors. Several other non-competed kinases were quantified in the ABPP-SILAC data sets (Dataset S1, tab 4). The remaining high-occupancy targets were from diverse protein classes, both enzymes and non-enzymes (Table 1), and showed markedly distinct sensitivities to the three inhibitors (Figure 2B, C). Inhibitor 1, for instance, strongly competed probe 4 labeling of multiple cathepsin cysteine proteases (CTSC, CTSH, CTSL1), while inhibitor 3 blocked probe 6 labeling of several proteins, including the serine/threonine kinase CHEK2, the nucleotidase NT5DC1, the reticulon protein RTN4, and the methyltransferase TRMT61A (Figure 2B, C), all of which were found to possess ligandable cysteines in a recent chemical proteomic investigation (Backus et al., 2016). In contrast, no additional high-occupancy targets were identified for inhibitor 2 beyond the three tyrosine kinases EGFR, ERBB2, and TEC (Figure 2B, C), although this inhibitor did partially engage CHEK2 (heavy:light ratio = 2.5; Figure 2B and Dataset S1).
Table 1.
High-occupancy targets of inhibitors 1–3 identified by competitive ABPP-SILAC.
| Gene name |
Protein ClassA | Active Site CysteineB | Competed TargetC |
|---|---|---|---|
| CHEK2 | Kinase | Yes* | 3 |
| CLN3 | Lysosomal membrane protein | - | 3 |
| CTSC | Cysteine Protease | Yes | 1 |
| CTSL1 | Cysteine Protease | Yes | 1 |
| CTSH | Cysteine Protease | Yes | 1 |
| EGFR | Kinase | Yes | 1, 2, 3 |
| ERBB2 | Kinase | Yes | 1,2 |
| IFI30 | Thiol Reductase | Yes | 1 |
| NT5DC1 | 5'-Nucleotidase | -* | 3 |
| RFTN1 | Lipid raft protein | - | 1 |
| RTN4 | ER membrane protein | -* | 3 |
| SCARB1 | Lipid receptor protein | - | 1 |
| TEC | Kinase | Yes | 1, 2, 3 |
| TEX264 | Uncharacterized protein | - | 1 |
| TNK1 | Kinase | Yes | 3 |
| TRMT61A | tRNA (adenine-N(1)-)-methyltransferase | -* | 3 |
Targets with a minimum of 80% competition (heavy:light ratios > 5) with at least one parent inhibitor are shown and described by:
protein class,
presence of an active-site cysteine or a ligandable cysteine (asterisks, (Backus et al., 2016)), and
inhibitors that engage the protein target with high-occupancy.
, proteins also targeted by fragment electrophiles in a global chemical proteomic analysis (Backus et al., 2016).
We next set out to further characterize the mode of engagement for representative off-targets of third-generation EGFR inhibitors.
Characterization of Protein Targets of Inhibitor 3
As noted above, several of the off-targets of third-generation EGFR inhibitors have been found in previous studies to react with cysteine-directed electrophilic compounds, including the cathepsin proteases (Bogyo et al., 2000, Greenbaum et al., 2000) and proteins targeted by fragment electrophiles in a global chemical proteomic analysis (Backus et al., 2016) (asterisked proteins, Table 1). Building on this past knowledge, we selected two proteins - NT5DC1 (5'-Nucleotidase-Domain Containing 1) and CHEK2 - for initial characterization.
We recombinantly expressed NT5DC1 and CHEK2 by transient transfection in HEK293T cells and found that both proteins strongly react with probe 6, to a lesser extent with probe 5, and showed negligible labeling by probe 4 (Figures 3A, B and S4A, B). Consistent with our ABPP-SILAC results, the reactivity of probe 6 with NT5DC1 was completely blocked by pretreatment with inhibitor 3 (10 µM), while probe 5 interactions with this target were largely unaffected by inhibitor 2 (10 µM) (Figure 3A). We calculated an IC50 value of ~360 nM for inhibitor 3 blockade of probe 6 labeling of recombinant NT5DC1 (Figure S4C). Similar results were obtained with recombinant CHEK2, where inhibitors 3 and 2 (10 µM) completely and partially blocked probe labeling of this protein, respectively (Figure 3B), and displayed corresponding IC50 values of 350 nM and ~4.0 µM (Figure S4D, E). We further confirmed that probe 6 labeling of recombinant NT5DC1 and CHEK2 was not cross-competed by inhibitors 1 or 2 (Figures 3A, B). Referring back to the gel-based ABPP results from H1975 cells, we speculate that one (or both) of the inhibitor 3-sensitive ~50 kDa proteins found in these cells may represent NT5DC1 (Figures 1C and S3E, marked <3).
Figure 3. Characterization of NT5DC1 and CHEK2 as Specific Off-Targets of Inhibitor 3.

(A) Characterization of NT5DC1 as a specific off-target of inhibitor 3/probe 6. HEK293T cells recombinantly expressing NT5DC1 were pre-treated in situ with inhibitors (1–3; 10 µM, 2 hr) followed by probes (4–6; 1 µM 4 hr) and total cellular lysate was analyzed by gel-based ABPP (upper panel). Anti-NT5DC1 western blotting was used to confirm equivalent protein expression in each sample (lower panel). Gel-based ABPP experiments and western blots were performed in duplicate or triplicate with consistent results. Representative full-length labeled gel for NT5DC1 is shown in Figure S4A. Mock transfected lanes are marked with the letter M.
(B) Characterization of CHEK2 as a specific off-target of inhibitor 3/probe 6. HEK293T cells recombinantly expressing FLAG-tagged CHEK2 were pre-treated in situ with inhibitors (1–3; 10 µM, 2 hr) followed by probes (4–6; 1 µM 4 hr) and soluble lysate was analyzed by gel-based ABPP (upper panel). Anti-Flag western blotting was used to confirm equivalent protein expression in each sample (lower panel). Gel-based ABPP experiments and western blots were performed in duplicate or triplicate with consistent results. Representative full-length labeled gel for CHEK2 is shown in Figure S4B. Mock transfected lanes are marked with the letter M.
(C) Inhibitor 3 targets C119 in NT5DC1. HEK293T cells recombinantly expressing NT5DC1 were treated in situ with DMSO or inhibitor 3 (10 µM, 4 hr). Cells were then lysed and treated with an iodoacetamide (IA)-alkyne probe (100 µM, 1 hr) and processed following previously described isoTOP-ABPP protocols (Backus et al., 2016). Shown are representative parent mass ion (MS1) ratios for tryptic peptides containing IA-reactive cysteine residues in NT5DC1, revealing that inhibitor 3 blocks IA-labeling of C119, but not other quantified cysteines in this protein.
(D) HEK293T cells recombinantly expressing FLAG-tagged WT or C231A mutant CHEK2 were treated in situ with probe 6 (1 µM, 4 hr) and analyzed by gel-based ABPP (upper panel). Anti-Flag western blotting was used to confirm equivalent protein expression in the samples (lower panel). Mock transfected lanes are marked with the letter M.
We next employed the chemical proteomic platform isoTOP-ABPP, which globally measures cysteine reactivity (Weerapana et al., 2010) and ligandability (Backus et al., 2016) in native biological systems, to identify the site of inhibitor modification in NT5DC1. HEK293T cells recombinantly expressing NT5DC1 were treated with inhibitor 3 or DMSO, and then subject to isoTOP-ABPP, which quantified six cysteines in the protein. One of these cysteines – C119 – was completely blocked in reactivity by 3, while the other five were unaffected (or, in the case of C179, partly reduced in reactivity) (Figure 3C). Attempts to further verify C119 as the site of probe 6/inhibitor 3 reactivity by mutation of this residue to alanine were confounded by the poor expression of this mutant protein, but we should note that C119 is also the site of engagement in NT5DC1 for a variety of electrophilic fragments in proteome-wide screens (Backus et al., 2016). We also identified the site of modification by inhibitor 3 for CHEK2 by MS analysis, in this case using purified protein, which exhibited similar reactivity with inhibitor 3 and probe 6 compared to CHEK2 protein heterologously expressed in HEK293T cells (Figure S4F, G), as C231 (Figure S4H), which is located on the G-loop of this kinase (Figure S4I). Inhibitor 3 also blocked the catalytic activity of CHEK2 as measured using a peptide substrate assay (> 90% at 1 µM, see Materials and Methods section). Finally, a C231A mutant of CHEK2 did not label with probe 6 (Figures 3D) or probe 5 (Figure S4J).
Characterization of Protein Targets of Inhibitor 1
Four of the high-engagement off-targets of inhibitor 1 were lysosomal enzymes – three cysteine proteases, CTSC, CTSH and CTSL1, and a thiol reductase IFI30. From this group, we further characterized inhibitor 1/probe 4 interactions with CTSC, which appeared to represent one of the more potent off-targets based on competitive ABPP-SILAC experiments performed with lower concentrations of inhibitor 1 (1 µM) in H1975 cells (Dataset S1, Table S3). Recombinant CTSC expressed by transient transfection in HEK293T cells showed robust in situ labeling by probe 4 (Figures 4A and S5A), and this labeling was blocked in a concentration-dependent manner by pretreatment with inhibitor 1 (Figure 4A and S5B), and to a lesser extend inhibitor 3, but not inhibitor 2 (Figure 4A). Consistent with the weaker or negligible inhibition of CTSC by 2 and 3, the corresponding probes 5 and 6 either did not react (probe 5) or reacted less efficiently (probe 6) with this protease (Figure 4A). Finally, referring back to the gel-based ABPP results from H1975 cells, we speculate that the inhibitor 1-sensitive, probe 4-labeled diffuse ~20 kDa band found in these cells (Figures 1C and S3E, marked <1) may represent a mixture of cathepsins. Notably, however, inhibitor 1/probe 4 did not target all lysosomal cathepsins, as we did not observe enriched or competed signals for CTSB (Dataset S1).
Figure 4. Characterization of Cathepsin Off-Targets and Lysosomotropic Activity of Inhibitor 1/Probe 4.

(A) Characterization of CTSC as a specific off-target of inhibitor 1/probe 4. HEK293T cells recombinantly expressing CTSC were treated in situ with inhibitors (1–3; 10 µM, 2 hr) followed by probes (4–6; 1 µM 4 hr) and the soluble lysate was analyzed by gel-based ABPP (upper panel). Anti-CTSC western blotting was used to confirm equivalent protein expression in the samples (lower panel). Representative full-length labeled gel for CTSC is shown in Figure S5A. Mock transfected lanes are marked with the letter M.
(B) Comparing in vitro versus in situ reactivity of probe 4 with CTSC. HEK293T cells recombinantly expressing CTSC were treated in situ (inhibitor 1: 10 µM, 2 hr; and/or probe 4: 1 µM, 4 hr) or in vitro (inhibitor 1: 10 µM, 1 hr; followed by probe 4: 5 µM, 1 hr or 1 µM, 3 hr) and analyzed by gel-based ABPP (upper panel). Anti-CTSC western blotting was used to confirm equivalent protein expression in the samples (lower panel).
(C) Competitive ABPP of CTSC in vitro versus in situ with inhibitor 1–3 using the cathepsin-directed activity-based probe DCG-04. HEK293T cells recombinantly expressing CTSC were treated in situ with inhibitors 1–3 (10 µM, 2 hr) or in vitro with inhibitors 1–3 (10 µM, 1 hr) or E64 (10 µM, 1 hr) followed by DCG-04-rhodamine labeling in vitro (1 µM, 30 min) and analyzed by gel-based ABPP (upper panel). Anti-CTSC western blotting was used to confirm equivalent protein expression in the samples (lower panel). Mock transfected lanes are marked with the letter M.
(D) In situ reactivity of CTSC with probe 4 post-lysosomal neutralization. HEK293T cells recombinantly expressing CTSC were treated with NH4Cl (10 mM, 15 min) or bafilomycin A1 (10 nM, 15 min) prior to treatment with probe 4 (1 µM, 4 hr), after which cells were lysed and analyzed by gel-based ABPP (upper panel). Anti-CTSC western blotting was used to confirm equivalent protein expression in the samples (lower panel). Mock transfected lanes are marked with the letter M.
(E) In situ reactivity of probe 4 post-lysosomal neutralization in H1975 cells. H1975 cells were treated with NH4Cl (10 mM, 15 min) or bafilomycin A1 (10 nM, 15 min) prior to probe 4 labeling in situ (1 µM, 4 hr) and analyzed by gel-based ABPP (upper panel). The T790M-EGFR band is denoted with an arrow (<) and the cathepsin band with an asterisk (*). Right panel, representative tryptic peptide MS1 ratios for the indicated proteins from ABPP-SILAC experiments evaluating probe 4 reactivity in bafilomycin- versus DMSO-treated H1975 cells. Complete MS data for bafilomycin-treated H1975 cells is displayed graphically in Figure S5G.
(F) LTR (LysoTracker Red) staining of H1975 cells treated with inhibitors 1–3. H1975 cells were treated with indicated concentrations of inhibitors 1–3 (2 hr) and LTR staining was quantified. Data represents average values + SEM for three independent experiments.
For (A–E), all gel-based ABPP experiments and western blots were performed in duplicate or triplicate with consistent results.
We were initially surprised to find that recombinant CTSC reacted very poorly with probe 4 in vitro, showing no detectable labeling at concentrations of probe 4 up to 5 µM and minimal labeling even at 50 µM (Figure 4B and Figure S5C). This outcome contrasted with the probe reactivity profiles of recombinant NT5DC1 and CHEK2, both of which showed inhibitor 3-sensitive, probe 6 reactivity in situ (Figure 3A, B) and in vitro (Figures S5D, E). We also found that in situ treatment with inhibitors 1 and 3 blocked recombinant CTSC reactivity with a fluorescent analogue of DCG-04, an ABPP probe that reacts with the catalytic cysteine of cathepsins (Greenbaum et al., 2002), indicating that the T790M-EGFR-directed inhibitors targeted the CTSC active site (Figure 4C). On the other hand, neither inhibitor blocked DCG-04 reactivity when incubated with CTSC-transfected cell lysates in vitro (Figure 4C). In contrast, the epoxide-based cathepsin inhibitor E64 completely blocked DCG-04 reactivity with CTSC in vitro (Figure 4C).
Recent studies by our lab and others have found using chemical proteomics that small molecules can accumulate in the lysosome to furnish much greater engagement of proteins than would be predicted based on in vitro experiments (Cognetta et al., 2015, Zuhl et al., 2016). We therefore tested whether lysosomal accumulation may underlie the in situ activity of inhibitor 1/probe 4 against cathepsins by treating CTSC-transfected cells with the lysosomal neutralizing agents ammonium chloride (NH4Cl, 10 mM, 15 min) or bafilomycin A1, a vacuolar H+-ATPase inhibitor (10 nM, 15 min), followed by in situ exposure to probe 4. Both lysosomal neutralizing agents blocked labeling of CTSC by probe 4 (Figure 4D), as well as by probe 6, which showed weaker reactivity with recombinant CTSC compared to probe 4 (Figure S5F), consistent with our data from H1975 cells (e.g., Figure 1C). A similar outcome was observed in H1975 cells, where labeling of the diffuse ~20 kDa band (putatively assigned as cathepsins) was abrogated by pretreatment with lysosomal neutralizing agents (Figure 4E, asterisk). In contrast, probe 4 labeling of the ~170 kDa membrane protein designated as T790M-EGFR was unaltered by lysosomal neutralizing agents (Figure 4E, arrowhead). We confirmed these gel-based ABPP results by ABPP-SILAC, which showed that enrichment of CTSC and CTSL1 by probe 4 was substantially blocked by lysosomal neutralizing agents, while EGFR enrichment was not impaired by these treatments (Figures 4E and S5G and Dataset S1). Western blotting revealed that CTSC protein levels were unaltered by lysosomal neutralizing agents, while CTSL1 protein content was dramatically decreased (Figure S5H), possibly indicating that this latter protease is destabilized by lysosomal pH disruption. We finally measured the integrity of the acidic environment of the lysosome in the presence of T790M-EGFR inhibitors 1–3 using the LysoTracker Red (LTR) dye and found that inhibitor 1, but not inhibitors 2 or 3, disrupted lysosomal acidity in H1975 cells (Figure 4F). Similar results were obtained in a second cell line ARPE19 (Figure S5I), which is commonly used to assess the lysosomal sequestering of basic inhibitors (Khoh-Reiter et al., 2015, Nadanaciva et al., 2011, Martina et al., 2014).
Inhibitor 1 Engages Cathepsins at Pharmacologically Relevant Doses In Vivo
We next asked whether inhibitor 1 substantially engaged cathepsins in vivo. For these studies, we treated mice (C57Bl/6) with inhibitor 1 at a dose (25 mg/kg, p.o., n = 4 mice) that has been shown to produce maximal blockade of tumor growth in H1975 tumor xenograft models (Cross et al., 2014). After 6 hr, animals were sacrificed and liver tissue removed and treated with ABPP probes. Using probe 4, we confirmed that inhibitor 1 treatment fully blocked WT-EGFR in mouse liver as measured by gel- or MS-based ABPP, where protein quantitation was achieved by reductive dimethylation (ReDiMe) with isotopically labeled formaldehyde (Inloes et al., 2014, Wilson-Grady et al., 2013) (Figure 5A, B and Dataset S1). This cross-reactivity with WT-EGFR may originate from a known in vivo metabolite of inhibitor 1 – AZ5104 (compound 27 in (Finlay et al., 2014)) – that exhibits enhanced potency for WT-EGFR compared to inhibitor 1 (Finlay et al., 2014) (Figure S3D). Engagement of WT-EGFR correlated with a moderate modulation of phosphorylated EGFR (Y1068) in liver tissue, whereas total EGFR content was unchanged (Figure 5A, middle and lower panels, respectively).
Figure 5. Inhibitor 1 Targets Cathepsins In Vivo.

(A) Characterization of mouse liver Egfr target engagement by inhibitor 1 in vivo. Four separate mice (marked as mouse 1–4 in the figure) were orally dosed with inhibitor 1 (25 mg/kg, 6 hr) or vehicle (8 mice total) and the insoluble liver proteomes, pH 7.4, were incubated in vitro with probe 4 (5 µM for 1 hr) and analyzed by gel-based ABPP for Egfr target engagement (arrowhead, top gel). The same samples were analyzed by western blot for Y1068 phosphorylation (middle panel; pEgfr Y1068) and total Egfr levels (bottom panel; anti-Egfr).
(B) Mapping high-occupancy in vivo targets of inhibitor 1 in mouse liver by competitive ABPP with probe 4. Quantitative (ReDiMe) MS-based proteomics of inhibitor 1 blockade of probe 4-enriched targets, where mice liver samples were treated as described in (A). Shown is a ReDiMe ratio plot of quantified proteins, where inhibitor 1-competed targets are defined as those with a mean value ≥ 5 (red dashed line) and quantified in at least 3 of the 4 biological replicates. Only Egfr met these criteria and is labeled in red. Displayed to the right is an MS1 chromatogram for a representative Egfr tryptic peptide, with the average protein ratio for Egfr displayed below it.
(C, D) Mapping cathepsin target engagement in vivo for inhibitor 1 using DCG-04 probes. Soluble liver proteomes, pH 5.0, from vehicle and inhibitor 1 (25 mg/kg, 6 hr) treated mice were treated with rhodamine-tagged DCG-04 (1 µM, 30 min) and analyzed by gel-based ABPP, two exposure are shown (C) or with biotin-tagged DCG-04 (1 µM, 1 hr) and analyzed by MS (ReDiMe)-based ABPP (D). For (C), data for the four individual mice are shown (marked as mouse 1–4 in the figure) and western blotting was used to confirm equivalent Ctsc protein expression in the samples (Anti-Ctsc; bottom panel). Two exposures (high, h; low, l) are shown for the fluorescence gel image of liver cathepsins labeled by rhodamine-tagged DCG-04. For (D), left panel, ReDiMe ratio plot of quantified proteins, where inhibitor 1-competed targets are defined as those with a mean value ≥ 2 (red dashed line) and quantified in at least 3 of the 4 biological replicates. Ctsl1, Ctsh, Ctsc, and Ctsf met these criteria and are highlighted in red. Ctss, Ctsz, and Ctsb did not meet these criteria and are highlighted in blue. Right panel, representative MS1 chromatograms for tryptic peptides from each identified cathepsin with the average protein ratios displayed below.
We initially attempted to assess cathepsin engagement in mouse liver by inhibitor 1 using a fluorescent DCG-04 probe, but limited alterations in cathepsin signal could be detected with this probe by gel-based ABPP (Figure 5C). We surmised that the diverse content of cathepsins in mouse liver may have hindered the detection of a subset of these enzymes that is sensitive to inhibitor 1. We therefore enriched cathepsins from mouse liver using a biotinylated DCG-04 probe (Greenbaum et al., 2000) and analyzed these samples by MS-based ABPP. This experiment identified several mouse cathepsins, including Ctsc, Ctsl1, Ctsf and Ctsh, for which DCG-04 enrichment was substantially blocked (≥ 2-fold) by inhibitor 1 treatment, while other cathepsins, such as Ctsb and Ctsz, were unaffected (Figure 5D and Dataset S1).
These data collectively indicate that inhibitor 1, at doses established previously to block T790M-EGFR-dependent lung tumor growth in animal models, engages both WT-EGFR and cathepsins in vivo.
Discussion
Clinical kinase inhibitors are typically assessed for selectivity across the kinome, and several valuable technologies have been developed for this purpose (Krishnamurty and Maly, 2007, Rosenblum et al., 2013). The working assumption of these studies has been that compounds achieving good selectivity within the kinome, which represents a very large (500+ member) class of structurally and functionally related enzymes, would imply good proteome-wide specificity (Barf and Kaptein, 2012). While this conclusion may apply to reversible kinase inhibitors, it is less clear how to interpret kinome-wide specificity for covalent kinase inhibitors, which typically contain cysteine-reactive electrophilic groups with the potential to impart broader proteome-wide interactions. We recently described a chemical proteomic method to determine the global protein reactivity profiles of covalent kinase inhibitors in human cell and animal models (Lanning et al., 2014), and here we apply this approach to characterize several third-generation T790M-EGFR-directed inhibitors. Consistent with previous studies of other covalent kinase inhibitors (Lanning et al., 2014, Sun et al., 2016), we found that the off-targets of T790M-EGFR inhibitors were not restricted to kinases, but included proteins from diverse families. Special features of these proteins include: i) the use of conserved cysteine residues for catalytic function (e.g., cathepsin cysteine proteases), and/or ii) the presence of ligandable cysteines, as defined by recent chemical proteomic studies (e.g., NT5DC1, CHEK2, others) (Backus et al., 2016, Wang et al., 2014). Follow-up studies point to functional/ligandable cysteines in these proteins as being the sites of cross-reactivity with T790M-EGFR-directed inhibitors (Figures 3 and S4 and S5). Extrapolating from these findings, we conclude that the portion of the human proteome possessing functional and/or ligandable cysteines represents a frequent source of off-targets for covalent kinase inhibitors, and accordingly, emerging chemical proteomic methods capable of inventorying these sites in native biological systems should prove useful for determining, and, ultimately, improving the specificity of covalent kinase inhibitors. From a technical perspective, these data provide additional evidence that cysteine-directed electrophiles (Weerapana et al., 2010) can serve as versatile activity-based probes for profiling proteins from different structural and mechanistic classes.
Some of the off-targets of individual T790M-EGFR inhibitors merit further discussion. CHEK2 (or CHK2), which was identified as a high-occupancy off-target of inhibitor 3 (and to a lesser extent, inhibitor 2) is a serine/threonine kinase involved in DNA damage response pathways (Antoni et al., 2007, Zannini et al., 2014). The functions of CHEK2 in cancer are complex and, depending on the tumor type, the kinase appears to act as a tumor suppressor or as a potential therapeutic vulnerability (Antoni et al., 2007, Zannini et al., 2014). Additionally, somatic mutations in, or chromosomal deletion of, the CHEK2 gene, have been found in many cancers (Antoni et al., 2007, Zannini et al., 2014). Whether cross-reactivity with CHEK2 would occur for inhibitor 3 at pharmacologically relevant concentrations in vivo remains unclear, but, regardless, our data designate CHEK2 as another kinase with a druggable active-site cysteine that should be monitored for potential off-target interactions in covalent kinase inhibitor programs.
The cathepsin off-targets of osimertinib (inhibitor 1), in particular CTSC, play critical roles in protein processing, specifically in the activation of immune-related serine proteases (Furber et al., 2014, Hamon et al., 2016). These off-targets were identified not only in human cancer cell lines, but also in liver tissue from mice treated with doses of osimertinib that match those used in the literature to block T790M-EGFR-driven tumor growth in xenograft models (Cross et al., 2014). Germline inactivating mutations in CTSC cause Papillon-Lefevre syndrome (Toomes et al., 1999), which manifests with severe periodontal disease and deregulated neutrophil function associated with increases in secreted and plasma proinflammatory cytokines (Roberts et al., 2016). That osimertinib and another covalent kinase inhibitor canertinib (Sun et al., 2016) cross-react with CTSC indicates a potentially complex effect of these oncology drugs on human immunology. Recently, human subjects treated with osimertinib in combination with the anti-PD1 drug durvalumab exhibited frequent (~40%) interstitial lung disease, resulting in the early halting of this clinical trial (FierceBiotech, 2015). It will be important, in future studies, to assess whether cross-reactivity with immunologically relevant cysteine proteases like CTSC affects the activity and safety of covalent kinase inhibitors when tested clinically in combination with immuno-oncology agents.
We should qualify that our chemical proteomic experiments are designed to identify covalent targets of kinase inhibitors and may fail to detect proteins that reversibly bind to these drugs. This limitation could explain, for instance, why some of the kinase off-targets reported previously for inhibitor 2, such as FER and TNK2 (Planken et al., 2017) were not detected in our studies. Likewise, we only evaluated a single cell line in this study and additional off-targets reported will likely be uncovered by extending our chemical proteomic analysis to other cell/tissue types (e.g., some of the other reported kinase off-targets of inhibitor 2 – ERBB4, BMX, BTK, and TXK – show very low or negligible expression in H1975 cells (Barretina et al., 2012, Klijn et al., 2015)).
Most screens for drug selectivity occur in vitro, often with purified collections of related proteins (Hughes et al., 2011). Our data, along with other recent studies (Lanning et al., 2014, Zuhl et al., 2016), however, underscore the importance of assaying the proteome-wide specificity of drugs in living systems. The interactions between inhibitor 1/probe 4 and cathepsin proteases, for instance, were observed in situ, but not in vitro, likely reflecting substantial lysosomal accumulation of these compounds such that a very poor biochemical affinity for off-targets is overcome by high drug concentrations within a specific organellar environment. These findings are reminiscent of previous discoveries made for cathepsin K (CTSK), where inhibitors of this enzyme were found to cross-react with other cathepsins with much greater potency in cells compared to in vitro (Desmarais et al., 2008, Falgueyret et al., 2005). Lysosomotropic CTSK inhibitors also exhibited lung toxicity in humans, a side effect that was not observed for inhibitors of this enzyme that avoided accumulation in the lysosome (Bromme and Lecaille, 2009). Our data, combined with this past work, indicate that cross-reactivity with cathepsins due to lysosomal accumulation may be not only a feature of inhibitors intended to target a specific member of this cysteine protease family, but also electrophilic drugs designed for distinct protein classes. We should further note, however, that some covalent kinase inhibitors may show cross-reactivity with cathepsins in the absence of lysosomal targeting, as the recently discovered canertinib-CTSC interaction was characterized in vitro (Sun et al., 2016).
We believe that, when viewed together, the proteome-wide reactivity profiles acquired so far for several covalent kinase inhibitors are sufficient in depth and breadth to draw some general conclusions. First, each covalent kinase inhibitor exhibits a distinct set of off-target interactions and few of these cross-reactive proteins are shared by more than one inhibitor (e.g., see Figure 2B, C). These results indicate that we are still far away from a complete map of potential off-targets for covalent kinase inhibitors. That many of these proteins, however, possess specialized cysteine residues, defined by their established functionality, intrinsic reactivity, and/or ligandability (Backus et al., 2016, Wang et al., 2014, Weerapana et al., 2010), designates them as a specific portion of the proteome that is susceptible to cross-reactivity with covalent kinase inhibitors. Even though this landscape of potential off-targets is large (e.g., many hundreds of proteins have been found to possess ligandable cysteines (Backus et al., 2016, Wang et al., 2014)), our data also suggest that some inhibitors, such as 2, can achieve excellent proteome-wide selectivity, likely by striking an optimal balance that combines strong binding affinity for mutant forms of EGFR, low lipophilicity (logP/logD), and a reactive group of tempered intrinsic electrophilicity (Planken et al., 2017). Integrating such design principles with chemical proteomic assessments of target and off-target engagement in living systems early in the ligand optimization process should facilitate the development of covalent kinases inhibitors with superior activity and selectivity. Such compounds offer exciting potential as chemical probes and drugs to treat cancer and other disorders.
Significance
Covalent inhibitors have great potential as chemical probes and therapeutic agents by providing improvements in potency, overcoming pharmacokinetic challenges, and achieving greater and more sustained target engagement in vivo compared to more classic reversible drugs. These potential benefits, however, are counterbalanced by possible safety concerns regarding the covalent modification and inhibition of additional proteins in the proteome beyond the intended target. The development of chemical proteomic methods to broadly assess covalent ligand-protein interactions in human cells is therefore an important objective. We have described herein a set of chemical probes and their use in combination with quantitative mass spectrometry to map the proteome-wide reactivity of “third-generation”, T790M-EGFR inhibitors in human cancer cell and animal models. We find that, even though these T790M-EGFR inhibitors were designed with a similar inhibition profile for the predominant clinical mutant forms of EGFR, they each display very distinct proteome reactivity profiles. Off-targets of the inhibitors are not restricted to kinases and include proteins from diverse classes, including many that possess cysteines with established functionality and/or ligandability. Osimertinib, in particular, was found to react with multiple cathepsins, and this cross-reactivity was discovered to occur selectively in cell and animal models, but not in vitro, likely due to accumulation of the drug in lysosomes. This work underscores the importance of using chemical proteomics to gain a more complete picture of the on- and off-target profiles of covalent inhibitors directly in living systems, such that probes and, ultimately, drugs with optimal selectivity can be developed for basic research and clinical value.
STAR Methods
Contact for Reagent and Resource Sharing
Further information and requests for resources and reagents should be directed to and will be fulfilled by the Lead Contact, Benjamin F. Cravatt (cravatt@scripps.edu).
Experimental Model and Subject Details
Bacterial strains
For plasmid propagation DH5α electro-competent bacterial cells were used and cultured in LB media (plus carbenicillian or kanamycin at 100µg/ml for selection) at 37°C with shaking.
For CHEK2 protein expression and purification BL21 (DE3) competent cells we used and cultured in auto-induction medium supplemented with 100µg/mL kanamycin and 100 µl/liter of antifoam.
Cell lines
The cell lines HEK293T, H1975, and A431 were purchased from the American Type Culture Collection (ATCC). H3255 was a gift from Dr. Bruce E. Johnson at the NCI. Finally, PC9 cells were purchased from RIKEN Cell Bank (Tsukuba, Ibaraki Prefecture, Japan). All Cell lines were grown at 37°C with 5% CO2 either in RPMI (PC9, H1975, H3255) supplemented with 10% fetal bovine serum and antibiotics (Penicillin-streptomycin) or DMEM (293T and A431) supplemented with 10% fetal bovine serum and antibiotics. Metabolically ‘light’ and ‘heavy’ H1975 cells were generated by passaging H1975 cells in SILAC RPMI media supplemented with 10% dialyzed FBS, antibiotics, L-proline, and either (Light media) L-Arginine-HCl (50mg/500mL), L-Lysine-2HCl (50mg/500mL), or (Heavy media) L-Arginine-HCl, 13C6,15N4 (50mg/500mL), L-Lysine-2HCl, 13C6 (50mg/500mL).
Mice
C57BL/6J 8 week old female mice were housed in specific pathogen free facility under 12 h light/12 h dark conditions. Water and food were provided ad libitum. Mice were housed 4 to a cage and randomly assigned to the experimental group.
Method Details
In situ treatment of cancer cells and proteome preparation
For gel-based analysis cells were seeded in 10 cm dishes and for MS-based analysis cells were seeded in 15 cm dishes and at 80% confluence were treated with inhibitors 1–3 (100nM – 10µM) and chemical probe 4–6 (100nM – 1µM) as defined in text (15 min – 24 hr). Cells were washed with PBS (3 × 10 mL), scraped, centrifuged (3,000 × g, 3 min) and pellets snap frozen in liquid nitrogen. For general ABPP analysis cells are lysed and separated into soluble and insoluble proteomes by probe sonication (3 × 10 bursts) and ultra-centrifugation (100,000 × g, 45 min) in PBS with added protease and phosphatase inhibitors (Cell Signaling, 5872S). For DCG-04 studies and in vitro CTSC labeling studies with probe 4 (Figure 4B), cells are lysed in NaAc pH 5.0. Protein concentrations were determined (ThermoFisher Scientific, 23227).
Gel-based ABPP of probe modified proteins
50 µL of 1 mg/mL soluble and insoluble proteome were subjected to copper-mediated azide-alkyne cycloaddition (CuAAC) conjugation to a TAMRA. Specifically, a final concentration of 10 µM TAMRA-azide (50× stock in DMSO) (Lumiprobe, C7130), 1 mM TCEP (Sigma, 75259) (50× stock in water), 100 µM TBTA (Sigma, 678937) ((17× stock in DMSO:t-butanol (ThermoFisher Scientific, 107710100) (1:4)), and 1 mM CuSO4 (Sigma, C1297) (50× stock in water) were added for 1 hr at room temperature. For DCG-04 studies, soluble proteomes (50 µg at 1 mg/mL in NaAc (pH5)) are labeled at room temperature (1µM, 30 min). Reactions were quenched with 14 µL of 4 × SDS-PAGE loading buffer and 30 µL were analyzed with Criterion™ XT Bis-Tris Precast Gels (Biorad, 345-0124) with XT MES (Biorad, 161-0789) and visualized by in-gel fluorescence using a flatbed scanner (Typhoon 9410). Covalently modified proteins are displayed in gray scale.
In situ treatment of cells for probe enrichment and competition studies (ABPP-SILAC)
For enrichment studies, cells were treated with chemical probes 4–6 (1 µM, 4hr, heavy) or an equal volume of DMSO (ThermoFisher Scientific, BP231) (light). For competition studies, cells were treated with parent inhibitor 1–3 (10 µM or 1 µM, 2hr, light) or an equal volume of DMSO (heavy) followed by corresponding chemical probe 4–6 (1 µM, 4 hr). After treatment cells were lysed and processed as described above for gel-based probe labeling studies. For lysosomal neutralization experiments the H1975 cells are treated with lysosomal neutralizing agents ammonium chloride (10 mM, 15 min), bafilomycin A1 (Tocris, 1334), a vacuolar H+-ATPase inhibitor (10 nM, 15 min) or DMSO followed by probe 4 (1 µM, 4 hr) and then cells are proceed as described above. For the A431 labeling studies cells were treated with the described probes 7 or 4–6 for 1 hr. For A431 competition study cells were treated with parent inhibitor 1–3 (1 hr) or an equal volume of DMSO followed by corresponding chemical probe 4–6 (1 µM, 1 hr). For both data sets after treatment cells were lysed and processed as described above for gel-based probe labeling studies.
ABPP-SILAC probe enrichment protocol
For identification of probe 4–6 labeled and/or inhibitor 1–3 competed proteins equal amounts of heavy or light proteome (soluble and insoluble) were used for enrichments of targets and off-targets through conjugation of a biotin group to covalently modified proteins by CuAAC. Similar experimental procedures are used for lysosomal neutralization studies. Specifically, to 2000 µg of proteome at a final concentration of 2 mg/mL, 100 µM biotin azide (ChemPep, 271605) (10× stock in DMSO), 1 mM TCEP, 100 µM TBTA and 1 mM CuSO4 were added. After incubation at room temperature for 1 hr with mixing, the samples were cooled and the proteins were precipitated by addition of ice-cold MeOH (ThermoFisher Scientific, A452-1) (2 mL), CHCl3 (ThermoFisher Scientific, A452-1) (0.5 mL), and PBS (1 mL) followed by vortexing. The phases separated by centrifugation (5,000 rpm for 10 min) and the protein discs were washed carefully with 1:1 MeOH/CHCl3 (3 × 1 mL) and then re-suspended by sonication in MeOH (2 mL). At this point samples (light and heavy) are combined. After the addition of CHCl3 (1.0 mL), the proteins were pelleted by centrifugation and dried slightly at room temperature. Protein pellets were resuspended with sonication in 1 mL, 8 M urea (JT Baker, 4111-01) 50mM Tris pH 8.0 (Teknova, T1080) (1000 µl). Proteins were reduced with 10 µM DTT (ThermoFisher Scientific, 20291) for 30 min at room temperature and alkylated with 20 µM IAA for 30 min in the dark (ThermoFisher Scientific, 90034). Samples are denatured by the addition of SDS (2.0 % final) (ThermoFisher Scientific, S0180), heated to 60°C for 5 min, cooled to room temperature, and diluted to a final volume of 12 mL with 50 mM Tris pH 8.0. Proteins are enriched over 100 µL of prewashed streptavidin resin (ThermoFisher Scientific, 20349) for 2–3 hr at room temperature with constant mixing. The resin was pelleted by centrifugation (1,000 g, 3 min), washed with 1.0% SDS/PBS (10 mL) and 50 mM Tris pH 8.0 (3 × 10 mL). Resin is transferred to an loBind protein tube (ThermoFisher Scientific, 022431081) and after one final wash all remaining buffer is removed and 200 µL of 2M Urea in 50mM Tris pH 8.0 with 1.5 µg of trypsin (ThermoFisher Scientific, 900058) is added for overnight digestion at 37°C with shaking. Digested peptides moved to a new loBind protein tube and were acidified with formic acid to a final concentration of 5% (Fluka, 94318) for MS analysis.
In vivo target engagement studies
Inhibitor 1 was resuspended in 1% Polysorbate 80 and administered via oral gavage at 25 mg/kg. After 6 hr the mice were sacrificed per IACUC-approved protocols, their livers collected and snap frozen in liquid nitrogen. The livers were then cut in half and dounce homogenized in either PBS (pH 7.4) or NaAc (pH 5.0) then lysed and separated into soluble and insoluble proteomes by probe sonication (3 × 10 bursts), soft spin (3,000 × g, 3 min) (to remove debris) and then the supernatant was ultracentifugated at (100,000 × g, 45 min). Protein concentrations were determined for each of the soluble and insoluble proteomes (ThermoFisher Scientific, 23227). For gel-based analysis samples were then labeled with described probes, DCG-04-Rhodamine (soluble fraction, 1 µM, 30 min, pH 5.0 samples) or probe 4 (insoluble fraction, 1 µM, 1 hr, pH 7.4 samples). Probe 4 gel-based samples were subjected to copper-mediated azide-alkyne cycloaddition (CuAAC) conjugation to a TAMRA as described above.
Mouse liver – probe 4
For the identification of probe 4 labeled and inhibitor 1 competed targets, by ReDiMe-ABPP, 1000 µg of proteome was used for each vehicle and inhibitor 1 treated insoluble lysates. Samples are treated with probe 4 (5 µM, 1 hr), before being subjected to copper-mediated azide-alkyne cycloaddition (CuAAC) conjugation to biotin as described above. Vehicle and inhibitor 1 samples were not combined and kept separate through-out the enrichment and digestion protocol. After trypsin digestion samples are labeled by ReDiMe as described (Inloes et al., 2014) and are combined before MS analysis.
Mouse liver – DCG-04
For the identification of probe DCG-04 labeled and inhibitor 1 competed protein targets, by ReDiMe-ABPP, 1000 µg of proteome was used for each vehicle and inhibitor 1 treated soluble lysates. Samples were treated with DCG-04 (5 µM, 1 hr) before enrichment. Vehicle and inhibitor 1 samples are not combined and kept separate through-out the enrichment and digestion protocol. After trypsin digestion samples are labeled by ReDiMe as described (Inloes et al., 2014) and are combined before MS analysis.
LC/LC-MS/MS and ABPP-SILAC data analysis
Mass spectrometry was performed using a Thermo Orbitrap Velos mass spectrometer, using a previously described protocol (Lanning et al., 2014). Peptides were eluted using a five-step multidimensional LC-MS (MudPIT protocol (using 0%, 25%, 50%, 80% and 100% salt bumps of 500 mM ammonium acetate), followed by an increasing gradient of aqueous acetonitrile and 0.1% formic acid in each step), and data were collected in data-dependent acquisition mode (400–1800 mass to charge ratio (m/z) and 30 data-dependent fragmentation (MS2) scans) with dynamic exclusion enabled (repeat count of 1, exclusion duration of 20 s). Prolucid searches allowed for static modification of cysteine residues (+57.0215 m/z; iodoacetamide alkylation) and required peptides to contain at least one tryptic end. For ReDiMe samples, each data set was independently searched with light and heavy parameter files; for the light search, static modifications on lysine (+ 28.0313 m/z) and N-termini (+ 28.0313 m/z) were specified; for the heavy search, static modifications on lysine (+ 34.06312 m/z) and N-termini (+ 34.06312 m/z) were specified. For SILAC samples, datasets were searched independently with the following parameter files; for the light search, all amino acids were left at default masses; for the heavy search, static modifications on lysine (+8.0142 m/z) and arginine (+10.0082 m/z) were specified. The precursor-ion mass tolerance was set to 50 ppm. The data were searched using a human or mouse reverse-concatenated nonredundant (gene-centric) FASTA database that was assembled from the Uniprot database (http://www.uniprot.org/). The resulting matched MS2 spectra were assembled into protein identifications and then filtered using DTASelect (version 2.0.47). Final peptides lists were filtered to include peptide that are detected as singletons, where only the heavy or light isotopically labeled peptide was detected and sequenced, but which passed all other filtering parameters, were given a standard ratio of 20, which is the maximum ReDiMe or SILAC ratio reported here. The mass spectrometry proteomics data have been deposited to the ProteomeXchange Consortium via the PRIDE partner repository with the dataset identifier PXD007163.
Mass spectrometry data filtration
ABPP-SILAC experiments to define covalent protein target in H1975 cells treated with probe (4–6; 1 µM, 4 hr). Each corresponding soluble and insoluble dataset from each of the three biological replicates were combined to obtain a single median protein ratio for each protein identified. For each protein with a minimum of 10 quantified peptides and an SEM < 5.2 across the three biological replicate the mean is calculated from the three median peptide ratios. Probe-enriched targets are defined as those with a mean value ≥ 5 and displaying an enrichment value ≥ 3 in 2 of the 3 biological replicates. Competitive ABPP-SILAC experiment to define competed targets in H1975 cells which were pretreated with inhibitor (1–3, 10 µM, 2 hr) or DMSO, followed by treatment with probe (4–6, respectively; 1 µM, 4 hr). Similar criteria are applied for the inhibitor 1 competition at 1 µM (2 hr). Each corresponding soluble and insoluble dataset from each of the three biological replicates were combined to obtain a single median protein ratio for each protein identified. For each protein with a minimum of 8 quantified peptides and an SEM < 5.2 across the three biological replicates the mean is calculated from the three median peptide ratios. Competed target are define as those with a mean competition ratios ≥ 5 displaying competition ≥ 3 in 2 of the 3 biological replicates. TNK1 is uniquely designated as an enriched and competed target of inhibitor 3 due to the high quality of competition data even though it was found to have a probe enrichment SEM > 5.2. Mouse Liver Probe 4 competed proteins in vehicle versus inhibitor 1 treated livers identified by ReDiMe-ABPP MS. For each protein with a minimum of 8 quantified peptides and an SEM < 5.2 across the four biological replicates the mean is calculated from the four median peptide ratios. Probe 4 competed targets are defined as those with a mean value ≥ 5 and displayed an enrichment ratio ≥ 3 in 3 of the 4 biological replicates. Mouse Liver DCG-04 competed proteins in vehicle versus inhibitor 1 mice identified by ReDiMe-ABPP MS. For each protein with a minimum of 8 quantified peptides and an SEM < 5.2 across the four biological replicates the mean is calculated from the four median peptide ratios. DCG-04 competed targets are defined as those with a mean value ≥ 2 and displayed an enrichment ratio ≥ 2 in 3 of the 4 biological replicates.
Immunoblotting and antibodies
All primary antibodies were incubated overnight at 4°C. These included CTSC (Santa Cruz, 74590) and CTSL (Invitrogen, 415500) at 1:1000, NT5DC1 (Abnova, PAB22437) at 1:5000 and FLAG (Sigma, F1804) at 1:1000 in 1% blocking buffer (ThermoFisher, 37525). All secondary antibodies were used at 1:20,000 for 1 hr at room temperature (Cell Signaling, 7074S and 7076S). Blots were washed three times for 10 mins with TBS-T after primary and secondary antibodies and developed with SuperSignal™ West Femto Maximum Sensitivity Substrate (ThermoFisher, 34096).
pY1068-EGFR and GSH reactivity assays
Analysis of probes and parent inhibitor pairs in Table S1 for inhibition of phosphorylated EGFR (pY1068) in H1975 cells and intrinsic reactivity in a conjugation assay with glutathione (GSH) were performed as described (Cheng et al., 2016). Briefly, the intrinsic chemical reactivity was accessed by evaluating the rate of electrophilic attack of the test compound to a strong nucleophile, glutathione (GSH), this was achieved by monitoring test compound loss during the reaction via LCMS/MS detection. Each compound was tested experimentally in duplicate under the following conditions: The experiment was initiated with an aliquot (100 µL) of the test compound to a reaction buffer consisting of 37° C 1 00 mM phosphate buffer pH 7.4, in the presence or absence of 5mM GSH. The final test compound concentration was 1 µM. The 37°C reaction temperature was maintained throughout the entire experiment. Aliquots of the reaction volume (100 mL) were taken at 0, 5, 15, 30, 45, 60, 90, and 120 minutes and quenched 1:1(v:v) with 40 mM N-ethylmaleimide (NEM) in acetonitrile containing internal standard. Canertinib (CI-1033) served as the positive control in all experiments. The natural log of the test compound mass spectrum peak area ratio of the test compared to the internal standard versus time was graphed to achieve the linear regression model. This data was used to determine the slope of the parent disappearance and hence the elimination constant (kel). Half-life was calculated as ln2/ −(kel). The intrinsic reactivity of each compound was reported as the ratio of compound half-life compared to the half-life of canertinib. The reaction which did not contain GSH, was used as a control for chemical instability.
Briefly, the inhibition of phosphorylation of EGFR at Tyr1068 was measured by PathScan® Phospho-EGF Receptor (Tyr1068) Sandwich ELISA kit (7240, Cell Signaling Technology). NCI-H1975 cells were seeded in flat-bottom, tissue culture treated plates (655182 Greiner Bio-One), in full serum media (100 µl/well), at 50,000/well, and incubated overnight at 37°C, 5% CO2 to adhere. The next day, cells were treated with inhibitor 1–3 or probe 4–6 freshly diluted in 96-well, U-bottom plates (3365, Corning). Each compound was prepared from a 100% DMSO stock solution (10 mM). Compounds were first serial diluted (1:3) in 100% DMSO with an 11-point serial dilution curve. They were then intermediately diluted two more times in media containing 10% FBS. A volume (25 µl) from the last dilution plate was added to the cell plate. The highest compound concentration was 10 µM (final), with a 0.5% final DMSO (#276855, Sigma) concentration. Plates were then incubated for 2 hours at 37°C, 5% CO2. Immediately before lysis, ice-cold lysis buffer was prepared: 1× Cell Lysis Buffer (9803, Cell Signaling Technology), 1× Protease/Phosphatase Inhibitor Cocktail (5872, Cell Signaling Technology), 1 mM Phenylmethanesulfonyl Fluoride - PMSF (52332, CalBiochem), in water. Media was removed at the end of the 2 hour incubation, ice-cold lysis buffer was added (100 µl/well), and the plates were shaken for 20–30 minutes at 4°C. Lysate (90 µl) was added to each well, then plates were incubated for 2 hours at room temperature or overnight at 4°C with gentle shaking. After incubation, wells were washed 6 times using plate washer containing 1× PBST wash buffer. Detection Antibody (100 µl/well) was added to each well and incubated for 1 hour at 37°C. After incubation, wells were washed as described. HRP-Linked Secondary Antibody (100 µl/well) was added to each well and incubated for 30 minutes at 37°C. After incubation, wells were washed as described. TMB Substrate (100 µl/well) was added to each well and incubated for 30 minutes at room temperature maximum. Stop Solution (100 µl/well) was added to each well. Plates were read on a PerkinElmer EnVision Excite Multilabel Reader Method for Absorbance at 450nm. Data was analyzed with Activity Base software tool.
High content LysoTracker ® Red (LTR) staining
ARPE-19 (5000 cells/well) and H1975 cells (8000 cells/well) are seeded in 96-well plates and allowed to attach overnight. After the overnight incubation the cell media is changed (complete media) to include inhibitors (1–3) for 2 hr. The final DMSO concentration is 0.5% in vehicle control wells and compound treated wells. After treatment cells were then stained with LysoTracker® Red probes (Life Technologies, Carlsbad, CA) containing 60 nM LTR and 5 µg/ml Hoechst 33342 (Life Technologies, Carlsbad, CA) for 5 minutes before imaging. The resultant images (> 6 images or more/well) were automatically captured and quantified using Thermo Fisher Scientific ArrayScan XTI (Thermo Fisher Scientific, Waltham, MA). Quantification of fluorescence intensity was conducted using cell health profiling algorithm, and the result is calculated as fold increase over vehicle control.
Co-crystallization of EGFR with CO-1686
Generation of crystal structure of inhibitor 3 with L858R/T790M-EGFR was accomplished using methods as extensively described (Cheng et al., 2016, Planken et al., 2017). Briefly, EGFR kinase domain (spanning residues 696 – 1022 with L858R, T790M and V948R mutations) at 9 mg/mL was incubated with Inhibitor 3 (0.25 mM) for at least an hour and then set up for crystallization at 13°C in sitting drop configuration. Crystallization condition consisted of 0.1 M Tris pH 8.5, 0.1 M potassium sulfate and 22 – 23 % PEG 4000. Crystals were frozen in mother liquor supplemented with 20 % glycerol as cryoprotectant.
Data collection and refinement: Data were collected at APS beamline 17ID at −175°C, and processed using autoPROC. Structure was solved by molecular replacement using Phaser; previously determined EGFR co-crystal structure with PF-6747775 (PDBID: 5UGC) served as a search model. The structure was refined using CNX with final round of refinement using BUSTER.
Biochemical CHEK2 kinase assay
The inhibition of CHEK2 by inhibitors 3 was assess using Invitrogen’s screening service that employs a FRET-based kinase assays to assess inhibitor potency at a Km concentration of ATP. The FRET-based Z´-LYTE® assay employs a fluorescence-based, coupled-enzyme format, taking advantage of the differential sensitivity of phosphorylated and non-phosphorylated peptides to proteolytic cleavage. Using this assay, we found that inhibitor 3 (1 µM) blocked > 90% of the activity of CHEK2.
Analysis of recombinantly expressed proteins by gel-based ABPP and determination of in situ IC50 values in 293T cells
CTSC (Sino biological catalog number HG10484-CF), NT5DC1 (GE Heathcare Dharmacon Inc MHS6278-202759455) were both purchased in mammalian expression vectors. CHEK2 cDNA was purchased from the GE Dharmacon MGC library (MHS6278-202828624) in a pOTB7 vector, and then subcloned into pflag-CMV6c (N-terminal flag) vector. Site directed mutagenesis was done with the C231A primers (TGAGAACCTTCACCACGGCGACCTCTCCATTTCGACCGA and ACTCTTGGAAGTGGTGCCGCTGGAGAGGTAAAGCTGGCT) using fusion polymerase, and verified via DNA sequencing.. 293T cells were seeded in 10 cm dishes 24 hr before transfection such that they were 80% confluent when transfected with FuGENE®6 (Promega, E2691, CTSC, NT5DC1) or PEI (CHEK2). For FuGENE®6 specifically, 18 µL of FuGENE®6 were added directly to 300 µL of serum-free DMEM, mixed and incubated at room-temperature for 5 min. 5 µg of NT5DC1, CTSC cDNA or empty vector were then added, mixed and incubated at room-temperature for an additional 15 min. For PEI, a 3:1 ratio of PEI:DNA was incubated for 15 minutes. The DNA-FuGENE/ or PEI:DNA complex was added drop-wise to the 293T cells and incubated for 48 h. After 48 h, the media was replaced with serum free DMEM and inhibitors 1–3 and/or probe 4–6 were added as defined in text. Cells were washed, harvested, prepped for gel-based analysis as described above.
CHEK2 protein expression and purification
Full-length human checkpoint kinase 2 (CHEK2) transcript variant 1 gene (NCBI Reference Sequence: NM_007194.3) was subcloned into pET-24(a)+ vector (Novagen, Cat. # 69772), resulting in a translated full-length CHEK2 protein sequence following by a C-terminal polyhistidine tag. The resulting plasmid was transformed into BL21 (DE3) competent cells (ThermoFisher, Cat. # C600003). Expression of recombinant protein was carried out by using a 2.5-liter Ultra-Yield flask (Thomson Instruments, Cat. # 931136-B) containing 1 liter of auto-induction medium (Magic Media, ThermoFisher, Cat. # K6803) supplemented with 100ug/mL kanamycin and 100 ul/liter of antifoam that had been inoculated with 10 mL of an overnight culture grown in selective LB medium. Culture was grown at 37°C and 250 rpm for 6 h prior to lowering the temperature to 18°C and continuing overnight. Cells were harvested by centrifugation (7,000 × g, 10 min), and the pellet stored at −80°C overnight prior to processing. One liter of culture was sufficient to produce multimilligram quantities of purified protein.
All purification steps were performed on ice or at 4°C. Frozen cell pellets were resuspended in lysis buffer (50 mM Tris-HCl, pH 8.0, 150 mM NaCl, 0.25 mM tris(2-carboxyethyl)phosphine (TCEP)) by using approximately 10 mL buffer per gram of cell paste. The resuspended material was passed twice through a microfluidizer (Microfluidics, 110Y) at 90 lb/in2, and then centrifuged (5,000 × g, 1 hr). The supernatant fraction was incubated with 3 mL of nickel-chelating resin (ProBond, ThermoFisher, Cat # R80101) for approximately 3 hr with mixing. The resin containing bound CHEK2 was captured by passage through a gravity flow column, and the resin washed twice with 4 column volumes of wash buffer (50 mM Tris-HCl, pH 8.0, 400 mM NaCl, 40 mM imidazole-HCl, pH 8.0, 0.25 mM TCEP). Bound protein was step eluted from the column by using 4 column volumes of elution buffer (50 mM Tris-HCl, pH 8.0, 400 mM NaCl, 250 mM imidazole-HCl, pH 8.0, 0.25 mM TCEP). Eluate was dialyzed against storage buffer (25 mM Tris-HCl, pH 8.0, 250 mM NaCl), flash-frozen in liquid nitrogen in small aliquots, and stored at −80°C for up to one month.
CHEK2 in vitro labeling and MS analysis
1 µM of full-length purified CHEK2 (LJEC-706B1.1) is incubated with inhibitor 1–3 (100 nM–10 µM, 2 hr) or DMSO, followed by probe 4–6 (1 µM, 2 hr). After incubation samples are treated as described above and 1.1 µg of total CHEK2 protein is loaded per lane. Gels are stained with commassie staining overnight to ensure equal protein loading. For inhibitor 3 site of modification, 5 µM CHEK2 was incubated with inhibitor 3 (5 µM, 2 hr). Samples were desalted two times to remove unreacted inhibitor 3 (P89882, Zebra Spin Desalting Column), resuspended in 8M urea 50mM Tris pH 8.0, reduced, alkylated using described procedures and digested with trypsin overnight. Finally samples were desalted and analyzed by MS. Prolucid searches allowed for static modification of cysteine residues (+57.0215 m/z; iodoacetamide alkylation) and required peptides to contain at least one tryptic end. Cysteines were also searched as a differential modification of 498.19911 (to find inhibitor 3 modified peptides and to account for the static modification of alkylation already applied). 78 peptides with 596 spectral counts were identified to represent 53% sequence coverage of CHEK2. Two different peptides were identified as being covalently modified by inhibitor 3, C231 (TLGSGACGEVK, sequenced 3×) and C385 (TLCGTPTYLAPEVLVSVGTAGYNR, sequenced 1 ×), all with Δ ppm < 5. As cysteine 385 is not in the active site of CHEK2 (internal structural data) and resides on the surface of CHEK2, C231 was considerable a more relevant site of modification.
isoTOP-ABPP experiments for site-of labeling of NT5DC1
5×10⁶ 293T cells were seeded into a 15-cm dish 24 hr prior to transfection using PEI. Specifically, 1 mL of serum free DMEM was added to 10 µg of either NT5DC1 cDNA or empty vector. 30 µL of PEI was added, mixed, and incubated at room temperature for 15 min. The DNA-PEI complex was added drop-wise to the 293T cells and incubated for 48 h. After 48 h, the media was replaced with serum free DMEM and inhibitor 3 (10 µM, 4 hr) or control (DMSO). Cells were washed with cold PBS, scraped, and pelleted by centrifugation (1,400 × g, 3 min, 4°C), and stored at −80°C until use. Cell pellets were prepared as detailed above. The isoTOP sample prep was carried out as previously described (Backus et al., 2016, Weerapana et al., 2010). Briefly, the samples were labeled with iodoacetamide alkyne (100 µM, 1 hr). Samples were then conjugated by CuAAC to either the light (NT5DC1 transfected) or heavy (DMSO treated) TEV tags (100 µM). The samples were then pelleted, resuspended, combined, and subjected to streptavidin enrichment for 2 hr at room temperature. The proteins bound to the strepavidin beads were then subjected to reduction (10 mM DTT), alkylation (20 mM iodoacetamide) and trypsin digestion (2 µg, Promega, sequencing grade, overnight at 37°C). The beads were separated from the digest with Micro Bio-Spin columns (Bio-Rad) by centrifugation, washed, and transferred to fresh eppendorf tubes. The beads were then washed in 140 µL TEV buffer (50 mM Tris, pH 8, 0.5 mM EDTA, 1 mM DTT) and then resuspended in 140 µL TEV buffer. 5 µL TEV protease (80 µM) was added and the reactions were rotated overnight at 29 °C. The TEV digest was separated from the beads with Micro BioSpin columns by centrifugation. The samples were then acidified to a final concentration of 5% (v/v) formic acid and stored at −80 °C prior to analysis by MS using described procedures (Backus et al., 2016, Weerapana et al., 2010).
Synthesis of chemical probes
Starting materials and other reagents were purchased from commercial suppliers and were used without further purification unless otherwise indicated. 1H NMR spectra were recorded on a Bruker instrument operating at 400 MHz unless otherwise indicated. 1H NMR spectra are obtained as DMSO-d6 or CDCl3 solutions as indicated (reported in ppm), using chloroform as the reference standard (7.25 ppm) or DMSO-d6 (2.50 ppm). Other NMR solvents were used as needed. When peak multiplicities are reported, the following abbreviations are used: s = singlet, d = doublet, t = triplet, m = multiplet, br =broadened, dd = doublet of doublets, dt = doublet of triplets. Coupling constants, when given, are reported in hertz. The mass spectra were obtained using liquid chromatography mass spectrometry (LC-MS) on an Agilent instrument using atmospheric pressure chemical ionization (APCI) or electrospray ionization (ESI). High resolution mass measurements were carried out on an Agilent TOF 6200 series with ESI. All test compounds showed > 95% purity as determined by combustion analysis or by high-performance liquid chromatography (HPLC). HPLC conditions were as follows: XBridge C18 column @ 80 °C, 4.6 mm × 150 mm, 5 µm, 5%–95% MeOH/H2O buffered with 0.2% formic acid/0.4% ammonium formate, 3 min run, flow rate 1.2 mL/min, UV detection (λ = 254, 224 nm). Combustion analyses were performed by Atlantic Microlab, Inc. (Norcross, Georgia). Inhibitors 1–3, AZD5104, PF-06274484 and PF6459988 were synthesized as described previously (Planken et al., 2017, Cheng et al., 2016, Butterworth et al., 2013, Lee et al., 2015, Fakhoury et al., 2005). For specific synthetic details for Probes 4–6, please see supplemental information (Methods S1).
Quantification and Statistical Analysis
All data fitting and statistical analysis for is situ IC50’s were performed using GraphPad Prism version 6.00 for Windows, GraphPad Software, La Jolla California USA, www.graphpad.com. Statistical values including the exact n are also reported in the Figure Legends.
Data and Software Availability
The RAW proteomics data have been deposited in the PRIDE database under project accession number PXD007163.
The crystal structure of EGFR kinase domain (L858R, T790M, V948R) in complex with the covalent inhibitor CO-1686 is under ID 5UWD in the PDB.
Supplementary Material
(Tab 1–3): For probes 4–6 a focused look at proteins selectively enriched >5 fold above background with a minimum of 10 quantified peptides, quantified in two of three biological replicates and having an SEM <5.2. (Tab 4): Summary of all kinase identified in probe 4–6-treated samples, including probe-enriched and background kinases (Tab 5–10): MS-based proteomic data sets (including biological replicates) for ABPP-SILAC analysis of probe 4–6 enrichment in H1975 cells with each experiment displayed in a separate tab including both processed (MOD) and unprocessed (RAW) data. (Tab 11–18): MS-based proteomic data sets (including biological replicates) for ABPP-SILAC competition analysis of inhibitors 1–3 with corresponding probes 4–6 in H1975 cells (summarized in Table S3) where each experiment is displayed in a separate tab including both processed (MOD) and unprocessed (RAW) data. (Tab 19): Compiled cysteine proteases identified by MS analysis from H1975 cells enriched with probe 4 from Tab 6. (Tab 20): Compiled targets from the ABPP-SILAC analysis of soluble proteome of H1975 cells treated with lysosomal neutralizing agents followed by in situ probe 4 (1 µM, 4 hr) treatment. (Tab 21–24): MS-based proteomic data sets (including biological replicates) for experiments in Tab 20 where each experiment is displayed in a separate tab including both processed (MOD) and unprocessed (RAW) data. (Tab 25) Compiled cysteine proteases identified from mouse livers treated with either vehicle or 25 mg/kg inhibitor 1 (6 hr) and enriched with probe DCG-04. (Tab 26–27): MS-based proteomic data sets (including biological replicates) for probe 4 enrichments from mouse livers treated with either vehicle or 25 mg/kg inhibitor 1 (6 hr) including both processed (MOD) and unprocessed (RAW) data. (Tab 28–29): MS-based proteomic data sets (including biological replicates) for DCG-04 enrichments from mouse livers treated with either vehicle or 25 mg/kg inhibitor 1 (6 hr) including both processed (MOD) and unprocessed (RAW) data.
(Tab 1–6): Sequence and ratios for all peptides identified in probe 4 enrichments in H1975 cells. (Tab 7–12): Sequence and ratios for all peptides identified in 1 µM inhibitor 1 competition experiments with probe 4 in H1975 cells. (Tab 13–18): Sequence and ratios for all peptides identified in 10 µM inhibitor 1 competition experiments with probe 4 in H1975 cells. (Tab 19–24): Sequence and ratios for all peptides identified in probe 5 enrichments in H1975 cells. (Tab 25–30): Sequence and ratios for all peptides identified in 10 µM inhibitor 2 competition experiments with probe 5 in H1975 cells. (Tab 31–36): Sequence and ratios for all peptides identified in probe 6 enrichments in H1975 cells. (Tab 37–42): Sequence and ratios for all peptides identified in 10 µM inhibitor 3 competition experiments with probe 6 in H1975 cells. Median protein values for tabs 1–42 can be found in Dataset S1, with the insoluble and soluble proteome fractions combined. (Tab 43–46): Sequence and ratios for all peptides identified in livers from mice treated with either vehicle or 25 mg/kg inhibitor 1 (6 hr) and enriched with probe DCG-04. (Tab 47–50): Sequence and ratios for all peptides identified in livers from mice treated with either vehicle or 25 mg/kg inhibitor 1 (6 hr) and enriched with probe 4. (Tab 51–52): Sequence and ratios for all peptides in soluble proteome of H1975 cells treated with bafilomycin A1 followed by in situ treatment with probe 4. (Tab 53–55): Sequence and ratios for all peptides identified from the soluble proteome of H1975 cells treated with NH4Cl followed by in situ treatment with probe 4.
Highlights.
Targets of covalent T790M-EGFR inhibitors identified in cancer cells
Individual T790M-EGFR inhibitors have distinct off-targets
Functional and ligandable cysteines are common sites of inhibitor reactivity
Osimertinib inhibits cathepsins in living systems due to lysosomal accumulation
Acknowledgments
We would like to thank Rupert Vessey and Scott Weinrich for helpful discussions. We would also like to thank Russell Dushin and Frank Loganzo for the DCG-04 probes used in this work, Elaine Tseng for her work with the GSH reactivity assay, and Kenneth Lum for help with data processing and formatting. This work was supported by the National Institutes of Health (CA087660), National Cancer Institute (M.M.D., CA211526), Pfizer and the Skaggs Institute for Chemical Biology. Inhibitor 2 (PF-06747775) is commercially available via Sigma Aldrich (catalog # PZ0302).
Footnotes
Publisher's Disclaimer: This is a PDF file of an unedited manuscript that has been accepted for publication. As a service to our customers we are providing this early version of the manuscript. The manuscript will undergo copyediting, typesetting, and review of the resulting proof before it is published in its final citable form. Please note that during the production process errors may be discovered which could affect the content, and all legal disclaimers that apply to the journal pertain.
Contributions
S.N., M.M.D and B.F.C. designed the experiments; S.N. and M.M.D. performed the experiments and analyzed data; S.B., Z.E.P., S.L., C.A., and M.R.L assisted with experiments; O.B., K.S.G., K.R., performed protein and crystal structure generation; S.P., and D.B., provided chemical probe design, synthesis and characterization. M.M.H. and B.F.C. provided inter-institutional leadership and coordination; and S.N., M.M.D., J.C.K., and B.F.C. wrote the manuscript.
Competing financial interests
The authors declare competing financial interests. J.C.K., S.N., S.L., S.P., D.B., R.A.F., C.A. O.B., K.S.G., K.R., and M.M.H. are employees of Pfizer. The research was partially funded by Pfizer.
References
- Advani RH, Buggy JJ, Sharman JP, Smith SM, Boyd TE, Grant B, Kolibaba KS, Furman RR, Rodriguez S, Chang BY, Sukbuntherng J, Izumi R, Hamdy A, Hedrick E, Fowler NH. Bruton tyrosine kinase inhibitor ibrutinib (PCI-32765) has significant activity in patients with relapsed/refractory B-cell malignancies. J Clin Oncol. 2013;31:88–94. doi: 10.1200/JCO.2012.42.7906. [DOI] [PMC free article] [PubMed] [Google Scholar]
- Antoni L, Sodha N, Collins I, Garrett MD. CHK2 kinase: cancer susceptibility and cancer therapy - two sides of the same coin? Nat Rev Cancer. 2007;7:925–36. doi: 10.1038/nrc2251. [DOI] [PubMed] [Google Scholar]
- Backus KM, Correia BE, Lum KM, Forli S, Horning BD, Gonzalez-Paez GE, Chatterjee S, Lanning BR, Teijaro JR, Olson AJ, Wolan DW, Cravatt BF. Proteome-wide covalent ligand discovery in native biological systems. Nature. 2016;534:570–4. doi: 10.1038/nature18002. [DOI] [PMC free article] [PubMed] [Google Scholar]
- Barf T, Kaptein A. Irreversible protein kinase inhibitors: balancing the benefits and risks. J Med Chem. 2012;55:6243–62. doi: 10.1021/jm3003203. [DOI] [PubMed] [Google Scholar]
- Barretina J, Caponigro G, Stransky N, Venkatesan K, Margolin AA, Kim S, Wilson CJ, Lehar J, Kryukov GV, Sonkin D, Reddy A, Liu M, Murray L, Berger MF, Monahan JE, Morais P, Meltzer J, Korejwa A, Jane-Valbuena J, Mapa FA, Thibault J, Bric-Furlong E, Raman P, Shipway A, Engels IH, Cheng J, Yu GK, Yu J, Aspesi P, Jr, De Silva M, Jagtap K, Jones MD, Wang L, Hatton C, Palescandolo E, Gupta S, Mahan S, Sougnez C, Onofrio RC, Liefeld T, Macconaill L, Winckler W, Reich M, Li N, Mesirov JP, Gabriel SB, Getz G, Ardlie K, Chan V, Myer VE, Weber BL, Porter J, Warmuth M, Finan P, Harris JL, Meyerson M, Golub TR, Morrissey MP, Sellers WR, Schlegel R, Garraway LA. The Cancer Cell Line Encyclopedia enables predictive modelling of anticancer drug sensitivity. Nature. 2012;483:603–7. doi: 10.1038/nature11003. [DOI] [PMC free article] [PubMed] [Google Scholar]
- Bogyo M, Verhelst S, Bellingard-Dubouchaud V, Toba S, Greenbaum D. Selective targeting of lysosomal cysteine proteases with radiolabeled electrophilic substrate analogs. Chem Biol. 2000;7:27–38. doi: 10.1016/s1074-5521(00)00061-2. [DOI] [PubMed] [Google Scholar]
- Bromme D, Lecaille F. Cathepsin K inhibitors for osteoporosis and potential off-target effects. Expert Opin Investig Drugs. 2009;18:585–600. doi: 10.1517/13543780902832661. [DOI] [PMC free article] [PubMed] [Google Scholar]
- Butterworth S, Finlay MRV, Ward RA, Kadambar VK, Chandrashekar RC, Murugan A, Redfearn HM. 2 - (2, 4, 5 - substituted -anilino) pyrimidine derivatives as egfr modulators useful for treating cancer. Google Patents 2013 [Google Scholar]
- Cheng H, Nair SK, Murray BW, Almaden C, Bailey S, Baxi S, Behenna D, Cho-Schultz S, Dalvie D, Dinh DM, Edwards MP, Feng JL, Ferre RA, Gajiwala KS, Hemkens MD, Jackson-Fisher A, Jalaie M, Johnson TO, Kania RS, Kephart S, Lafontaine J, Lunney B, Liu KK, Liu Z, Matthews J, Nagata A, Niessen S, Ornelas MA, Orr ST, Pairish M, Planken S, Ren S, Richter D, Ryan K, Sach N, Shen H, Smeal T, Solowiej J, Sutton S, Tran K, Tseng E, Vernier W, Walls M, Wang S, Weinrich SL, Xin S, Xu H, Yin MJ, Zientek M, Zhou R, Kath JC. Discovery of 1-{(3R,4R)-3-[({5-Chloro-2-[(1-methyl-1H-pyrazol-4-yl)amino]-7H-pyrrolo[2,3-d]pyrimidin-4-yl}oxy)methyl]-4-methoxypyrrolidin-1-yl}prop-2-en-1-one (PF-06459988), a Potent, WT Sparing, Irreversible Inhibitor of T790M-Containing EGFR Mutants. J Med Chem. 2016;59:2005–24. doi: 10.1021/acs.jmedchem.5b01633. [DOI] [PubMed] [Google Scholar]
- Cognetta AB, 3rd, Niphakis MJ, Lee HC, Martini ML, Hulce JJ, Cravatt BF. Selective N-Hydroxyhydantoin Carbamate Inhibitors of Mammalian Serine Hydrolases. Chem Biol. 2015;22:928–37. doi: 10.1016/j.chembiol.2015.05.018. [DOI] [PMC free article] [PubMed] [Google Scholar]
- Cravatt BF, Wright AT, Kozarich JW. Activity-based protein profiling: from enzyme chemistry to proteomic chemistry. Annu Rev Biochem. 2008;77:383–414. doi: 10.1146/annurev.biochem.75.101304.124125. [DOI] [PubMed] [Google Scholar]
- Cross DA, Ashton SE, Ghiorghiu S, Eberlein C, Nebhan CA, Spitzler PJ, Orme JP, Finlay MR, Ward RA, Mellor MJ, Hughes G, Rahi A, Jacobs VN, Red Brewer M, Ichihara E, Sun J, Jin H, Ballard P, Al-Kadhimi K, Rowlinson R, Klinowska T, Richmond GH, Cantarini M, Kim DW, Ranson MR, Pao W. AZD9291, an irreversible EGFR TKI, overcomes T790M-mediated resistance to EGFR inhibitors in lung cancer. Cancer Discov. 2014;4:1046–61. doi: 10.1158/2159-8290.CD-14-0337. [DOI] [PMC free article] [PubMed] [Google Scholar]
- Desmarais S, Black WC, Oballa R, Lamontagne S, Riendeau D, Tawa P, Duong LT, Pickarski M, Percival MD. Effect of cathepsin k inhibitor basicity on in vivo off-target activities. Mol Pharmacol. 2008;73:147–56. doi: 10.1124/mol.107.039511. [DOI] [PubMed] [Google Scholar]
- Fakhoury SA, Lee HT, Reed JE, Schlosser KM, Sexton KE, Tecle H, Winters RT. 4-phenylamino-quinazolin-6-yl-amides. Google Patents 2005 [Google Scholar]
- Falgueyret JP, Desmarais S, Oballa R, Black WC, Cromlish W, Khougaz K, Lamontagne S, Masse F, Riendeau D, Toulmond S, Percival MD. Lysosomotropism of basic cathepsin K inhibitors contributes to increased cellular potencies against off-target cathepsins and reduced functional selectivity. J Med Chem. 2005;48:7535–43. doi: 10.1021/jm0504961. [DOI] [PubMed] [Google Scholar]
- Fiercebiotech DG. AstraZeneca halts a pair of lung cancer trials over a safety scare 2015 [Google Scholar]
- Finlay MR, Anderton M, Ashton S, Ballard P, Bethel PA, Box MR, Bradbury RH, Brown SJ, Butterworth S, Campbell A, Chorley C, Colclough N, Cross DA, Currie GS, Grist M, Hassall L, Hill GB, James D, James M, Kemmitt P, Klinowska T, Lamont G, Lamont SG, Martin N, Mcfarland HL, Mellor MJ, Orme JP, Perkins D, Perkins P, Richmond G, Smith P, Ward RA, Waring MJ, Whittaker D, Wells S, Wrigley GL. Discovery of a potent and selective EGFR inhibitor (AZD9291) of both sensitizing and T790M resistance mutations that spares the wild type form of the receptor. J Med Chem. 2014;57:8249–67. doi: 10.1021/jm500973a. [DOI] [PubMed] [Google Scholar]
- Fleuren ED, Zhang L, Wu J, Daly RJ. The kinome 'at large' in cancer. Nat Rev Cancer. 2016;16:83–98. doi: 10.1038/nrc.2015.18. [DOI] [PubMed] [Google Scholar]
- Furber M, Tiden AK, Gardiner P, Mete A, Ford R, Millichip I, Stein L, Mather A, Kinchin E, Luckhurst C, Barber S, Cage P, Sanganee H, Austin R, Chohan K, Beri R, Thong B, Wallace A, Oreffo V, Hutchinson R, Harper S, Debreczeni J, Breed J, Wissler L, Edman K. Cathepsin C inhibitors: property optimization and identification of a clinical candidate. J Med Chem. 2014;57:2357–67. doi: 10.1021/jm401705g. [DOI] [PubMed] [Google Scholar]
- Greenbaum D, Baruch A, Hayrapetian L, Darula Z, Burlingame A, Medzihradszky KF, Bogyo M. Chemical approaches for functionally probing the proteome. Mol Cell Proteomics. 2002;1:60–8. doi: 10.1074/mcp.t100003-mcp200. [DOI] [PubMed] [Google Scholar]
- Greenbaum D, Medzihradszky KF, Burlingame A, Bogyo M. Epoxide electrophiles as activity-dependent cysteine protease profiling and discovery tools. Chem Biol. 2000;7:569–81. doi: 10.1016/s1074-5521(00)00014-4. [DOI] [PubMed] [Google Scholar]
- Hamon Y, Legowska M, Herve V, Dallet-Choisy S, Marchand-Adam S, Vanderlynden L, Demonte M, Williams R, Scott CJ, Si-Tahar M, Heuze-Vourc'h N, Lalmanach G, Jenne DE, Lesner A, Gauthier F, Korkmaz B. Neutrophilic Cathepsin C Is Maturated by a Multistep Proteolytic Process and Secreted by Activated Cells during Inflammatory Lung Diseases. J Biol Chem. 2016;291:8486–99. doi: 10.1074/jbc.M115.707109. [DOI] [PMC free article] [PubMed] [Google Scholar]
- Hughes JP, Rees S, Kalindjian SB, Philpott KL. Principles of early drug discovery. Br J Pharmacol. 2011;162:1239–49. doi: 10.1111/j.1476-5381.2010.01127.x. [DOI] [PMC free article] [PubMed] [Google Scholar]
- Inloes JM, Hsu KL, Dix MM, Viader A, Masuda K, Takei T, Wood MR, Cravatt BF. The hereditary spastic paraplegia-related enzyme DDHD2 is a principal brain triglyceride lipase. Proc Natl Acad Sci U S A. 2014;111:14924–9. doi: 10.1073/pnas.1413706111. [DOI] [PMC free article] [PubMed] [Google Scholar]
- Johnson DS, Weerapana E, Cravatt BF. Strategies for discovering and derisking covalent, irreversible enzyme inhibitors. Future Med Chem. 2010;2:949–64. doi: 10.4155/fmc.10.21. [DOI] [PMC free article] [PubMed] [Google Scholar]
- Khoh-Reiter S, Sokolowski SA, Jessen B, Evans M, Dalvie D, Lu S. Contribution of membrane trafficking perturbation to retinal toxicity. Toxicol Sci. 2015;145:383–95. doi: 10.1093/toxsci/kfv059. [DOI] [PubMed] [Google Scholar]
- Klijn C, Durinck S, Stawiski EW, Haverty PM, Jiang Z, Liu H, Degenhardt J, Mayba O, Gnad F, Liu J, Pau G, Reeder J, Cao Y, Mukhyala K, Selvaraj SK, Yu M, Zynda GJ, Brauer MJ, Wu TD, Gentleman RC, Manning G, Yauch RL, Bourgon R, Stokoe D, Modrusan Z, Neve RM, De Sauvage FJ, Settleman J, Seshagiri S, Zhang Z. A comprehensive transcriptional portrait of human cancer cell lines. Nat Biotechnol. 2015;33:306–12. doi: 10.1038/nbt.3080. [DOI] [PubMed] [Google Scholar]
- Krishnamurty R, Maly DJ. Chemical genomic and proteomic methods for determining kinase inhibitor selectivity. Comb Chem High Throughput Screen. 2007;10:652–66. doi: 10.2174/138620707782507368. [DOI] [PubMed] [Google Scholar]
- Lanning BR, Whitby LR, Dix MM, Douhan J, Gilbert AM, Hett EC, Johnson TO, Joslyn C, Kath JC, Niessen S, Roberts LR, Schnute ME, Wang C, Hulce JJ, Wei B, Whiteley LO, Hayward MM, Cravatt BF. A road map to evaluate the proteome-wide selectivity of covalent kinase inhibitors. Nat Chem Biol. 2014;10:760–7. doi: 10.1038/nchembio.1582. [DOI] [PMC free article] [PubMed] [Google Scholar]
- Lee JS, Yoo YH, Yoon CN. Small-molecule probes elucidate global enzyme activity in a proteomic context. BMB Rep. 2014;47:149–57. doi: 10.5483/BMBRep.2014.47.3.264. [DOI] [PMC free article] [PubMed] [Google Scholar]
- Lee K, Niu D, Petter RC, Baevsky MF, Singh J. Heterocyclic compounds and uses thereof. Google Patents 2015 [Google Scholar]
- Leproult E, Barluenga S, Moras D, Wurtz JM, Winssinger N. Cysteine mapping in conformationally distinct kinase nucleotide binding sites: application to the design of selective covalent inhibitors. J Med Chem. 2011;54:1347–55. doi: 10.1021/jm101396q. [DOI] [PubMed] [Google Scholar]
- Linker RA, Haghikia A. Dimethyl fumarate in multiple sclerosis: latest developments, evidence and place in therapy. Ther Adv Chronic Dis. 2016;7:198–207. doi: 10.1177/2040622316653307. [DOI] [PMC free article] [PubMed] [Google Scholar]
- Liu Q, Sabnis Y, Zhao Z, Zhang T, Buhrlage SJ, Jones LH, Gray NS. Developing irreversible inhibitors of the protein kinase cysteinome. Chem Biol. 2013;20:146–59. doi: 10.1016/j.chembiol.2012.12.006. [DOI] [PMC free article] [PubMed] [Google Scholar]
- Martina JA, Diab HI, Lishu L, Jeong AL, Patange S, Raben N, Puertollano R. The nutrient-responsive transcription factor TFE3 promotes autophagy, lysosomal biogenesis, and clearance of cellular debris. Sci Signal. 2014;7:ra9. doi: 10.1126/scisignal.2004754. [DOI] [PMC free article] [PubMed] [Google Scholar]
- Nadanaciva S, Lu S, Gebhard DF, Jessen BA, Pennie WD, Will Y. A high content screening assay for identifying lysosomotropic compounds. Toxicol In Vitro. 2011;25:715–23. doi: 10.1016/j.tiv.2010.12.010. [DOI] [PubMed] [Google Scholar]
- Ong SE, Blagoev B, Kratchmarova I, Kristensen DB, Steen H, Pandey A, Mann M. Stable isotope labeling by amino acids in cell culture, SILAC, as a simple and accurate approach to expression proteomics. Mol Cell Proteomics. 2002;1:376–86. doi: 10.1074/mcp.m200025-mcp200. [DOI] [PubMed] [Google Scholar]
- Ong SE, Foster LJ, Mann M. Mass spectrometric-based approaches in quantitative proteomics. Methods. 2003;29:124–30. doi: 10.1016/s1046-2023(02)00303-1. [DOI] [PubMed] [Google Scholar]
- Patricelli MP, Nomanbhoy TK, Wu J, Brown H, Zhou D, Zhang J, Jagannathan S, Aban A, Okerberg E, Herring C, Nordin B, Weissig H, Yang Q, Lee JD, Gray NS, Kozarich JW. In situ kinase profiling reveals functionally relevant properties of native kinases. Chem Biol. 2011;18:699–710. doi: 10.1016/j.chembiol.2011.04.011. [DOI] [PMC free article] [PubMed] [Google Scholar]
- Planken S, Behenna DC, Nair SK, Johnson TO, Nagata A, Almaden C, Bailey S, Ballard TE, Bernier L, Cheng H, Cho-Schultz S, Dalvie D, Deal JG, Dinh DM, Edwards MP, Ferre RA, Gajiwala KS, Hemkens M, Kania RS, Kath JC, Matthews J, Murray BW, Niessen S, Orr ST, Pairish M, Sach NW, Shen H, Shi M, Solowiej J, Tran K, Tseng E, Vicini P, Wang Y, Weinrich SL, Zhou R, Zientek M, Liu L, Luo Y, Xin S, Zhang C, Lafontaine J. Discovery of N-((3R,4R)-4-Fluoro-1-(6-((3-methoxy-1-methyl-1H-pyrazol-4-yl)amino)-9-methyl-9H- purin-2-yl)pyrrolidine-3-yl)acrylamide (PF-06747775) through Structure-Based Drug Design: A High Affinity Irreversible Inhibitor Targeting Oncogenic EGFR Mutants with Selectivity over Wild-Type EGFR. J Med Chem. 2017;60:3002–3019. doi: 10.1021/acs.jmedchem.6b01894. [DOI] [PubMed] [Google Scholar]
- Potashman MH, Duggan ME. Covalent modifiers: an orthogonal approach to drug design. J Med Chem. 2009;52:1231–46. doi: 10.1021/jm8008597. [DOI] [PubMed] [Google Scholar]
- Roberts H, White P, Dias I, Mckaig S, Veeramachaneni R, Thakker N, Grant M, Chapple I. Characterization of neutrophil function in Papillon-Lefevre syndrome. J Leukoc Biol. 2016;100:433–44. doi: 10.1189/jlb.5A1015-489R. [DOI] [PubMed] [Google Scholar]
- Rosenblum JS, Nomanbhoy TK, Kozarich JW. Functional interrogation of kinases and other nucleotide-binding proteins. FEBS Lett. 2013;587:1870–7. doi: 10.1016/j.febslet.2013.05.008. [DOI] [PubMed] [Google Scholar]
- Rostovtsev VV, Green LG, Fokin VV, Sharpless KB. A stepwise huisgen cycloaddition process: copper(I)-catalyzed regioselective "ligation" of azides and terminal alkynes. Angew Chem Int Ed Engl. 2002;41:2596–9. doi: 10.1002/1521-3773(20020715)41:14<2596::AID-ANIE2596>3.0.CO;2-4. [DOI] [PubMed] [Google Scholar]
- Sanman LE, Bogyo M. Activity-based profiling of proteases. Annu Rev Biochem. 2014;83:249–73. doi: 10.1146/annurev-biochem-060713-035352. [DOI] [PubMed] [Google Scholar]
- Singh J, Petter RC, Baillie TA, Whitty A. The resurgence of covalent drugs. Nat Rev Drug Discov. 2011;10:307–17. doi: 10.1038/nrd3410. [DOI] [PubMed] [Google Scholar]
- Speers AE, Cravatt BF. Profiling enzyme activities in vivo using click chemistry methods. Chem Biol. 2004;11:535–46. doi: 10.1016/j.chembiol.2004.03.012. [DOI] [PubMed] [Google Scholar]
- Spicer JF, Rudman SM. EGFR inhibitors in non-small cell lung cancer (NSCLC): the emerging role of the dual irreversible EGFR/HER2 inhibitor BIBW 2992. Target Oncol. 2010;5:245–55. doi: 10.1007/s11523-010-0140-y. [DOI] [PubMed] [Google Scholar]
- Sun H, Ren Y, Hou W, Li L, Zeng F, Li S, Ma Y, Liu X, Chen S, Zhang Z. Focusing on probe-modified peptides: a quick and effective method for target identification. Chem Commun (Camb) 2016;52:10225–8. doi: 10.1039/c6cc04030f. [DOI] [PubMed] [Google Scholar]
- Tjin Tham Sjin R, Lee K, Walter AO, Dubrovskiy A, Sheets M, Martin TS, Labenski MT, Zhu Z, Tester R, Karp R, Medikonda A, Chaturvedi P, Ren Y, Haringsma H, Etter J, Raponi M, Simmons AD, Harding TC, Niu D, Nacht M, Westlin WF, Petter RC, Allen A, Singh J. In vitro and in vivo characterization of irreversible mutant-selective EGFR inhibitors that are wild-type sparing. Mol Cancer Ther. 2014;13:1468–79. doi: 10.1158/1535-7163.MCT-13-0966. [DOI] [PubMed] [Google Scholar]
- Toomes C, James J, Wood AJ, Wu CL, Mccormick D, Lench N, Hewitt C, Moynihan L, Roberts E, Woods CG, Markham A, Wong M, Widmer R, Ghaffar KA, Pemberton M, Hussein IR, Temtamy SA, Davies R, Read AP, Sloan P, Dixon MJ, Thakker NS. Loss-of-function mutations in the cathepsin C gene result in periodontal disease and palmoplantar keratosis. Nat Genet. 1999;23:421–4. doi: 10.1038/70525. [DOI] [PubMed] [Google Scholar]
- Walter AO, Sjin RT, Haringsma HJ, Ohashi K, Sun J, Lee K, Dubrovskiy A, Labenski M, Zhu Z, Wang Z, Sheets M, St Martin T, Karp R, Van Kalken D, Chaturvedi P, Niu D, Nacht M, Petter RC, Westlin W, Lin K, Jaw-Tsai S, Raponi M, Van Dyke T, Etter J, Weaver Z, Pao W, Singh J, Simmons AD, Harding TC, Allen A. Discovery of a mutant-selective covalent inhibitor of EGFR that overcomes T790M-mediated resistance in NSCLC. Cancer Discov. 2013;3:1404–15. doi: 10.1158/2159-8290.CD-13-0314. [DOI] [PMC free article] [PubMed] [Google Scholar]
- Wang C, Weerapana E, Blewett MM, Cravatt BF. A chemoproteomic platform to quantitatively map targets of lipid-derived electrophiles. Nat Methods. 2014;11:79–85. doi: 10.1038/nmeth.2759. [DOI] [PMC free article] [PubMed] [Google Scholar]
- Wang S, Cang S, Liu D. Third-generation inhibitors targeting EGFR T790M mutation in advanced non-small cell lung cancer. J Hematol Oncol. 2016;9:34. doi: 10.1186/s13045-016-0268-z. [DOI] [PMC free article] [PubMed] [Google Scholar]
- Weerapana E, Wang C, Simon GM, Richter F, Khare S, Dillon MB, Bachovchin DA, Mowen K, Baker D, Cravatt BF. Quantitative reactivity profiling predicts functional cysteines in proteomes. Nature. 2010;468:790–5. doi: 10.1038/nature09472. [DOI] [PMC free article] [PubMed] [Google Scholar]
- Wilson-Grady JT, Haas W, Gygi SP. Quantitative comparison of the fasted and re-fed mouse liver phosphoproteomes using lower pH reductive dimethylation. Methods. 2013;61:277–86. doi: 10.1016/j.ymeth.2013.03.031. [DOI] [PubMed] [Google Scholar]
- Winer ES, Ingham RR, Castillo JJ. PCI-32765: a novel Bruton's tyrosine kinase inhibitor for the treatment of lymphoid malignancies. Expert Opin Investig Drugs. 2012;21:355–61. doi: 10.1517/13543784.2012.656199. [DOI] [PubMed] [Google Scholar]
- Yosaatmadja Y, Silva S, Dickson JM, Patterson AV, Smaill JB, Flanagan JU, Mckeage MJ, Squire CJ. Binding mode of the breakthrough inhibitor AZD9291 to epidermal growth factor receptor revealed. J Struct Biol. 2015;192:539–44. doi: 10.1016/j.jsb.2015.10.018. [DOI] [PubMed] [Google Scholar]
- Zannini L, Delia D, Buscemi G. CHK2 kinase in the DNA damage response and beyond. J Mol Cell Biol. 2014;6:442–57. doi: 10.1093/jmcb/mju045. [DOI] [PMC free article] [PubMed] [Google Scholar]
- Zhang J, Yang PL, Gray NS. Targeting cancer with small molecule kinase inhibitors. Nat Rev Cancer. 2009;9:28–39. doi: 10.1038/nrc2559. [DOI] [PMC free article] [PubMed] [Google Scholar]
- Zuhl AM, Nolan CE, Brodney MA, Niessen S, Atchison K, Houle C, Karanian DA, Ambroise C, Brulet JW, Beck EM, Doran SD, O'neill BT, Am Ende CW, Chang C, Geoghegan KF, West GM, Judkins JC, Hou X, Riddell DR, Johnson DS. Chemoproteomic profiling reveals that cathepsin D off-target activity drives ocular toxicity of beta-secretase inhibitors. Nat Commun. 2016;7:13042. doi: 10.1038/ncomms13042. [DOI] [PMC free article] [PubMed] [Google Scholar]
Associated Data
This section collects any data citations, data availability statements, or supplementary materials included in this article.
Supplementary Materials
(Tab 1–3): For probes 4–6 a focused look at proteins selectively enriched >5 fold above background with a minimum of 10 quantified peptides, quantified in two of three biological replicates and having an SEM <5.2. (Tab 4): Summary of all kinase identified in probe 4–6-treated samples, including probe-enriched and background kinases (Tab 5–10): MS-based proteomic data sets (including biological replicates) for ABPP-SILAC analysis of probe 4–6 enrichment in H1975 cells with each experiment displayed in a separate tab including both processed (MOD) and unprocessed (RAW) data. (Tab 11–18): MS-based proteomic data sets (including biological replicates) for ABPP-SILAC competition analysis of inhibitors 1–3 with corresponding probes 4–6 in H1975 cells (summarized in Table S3) where each experiment is displayed in a separate tab including both processed (MOD) and unprocessed (RAW) data. (Tab 19): Compiled cysteine proteases identified by MS analysis from H1975 cells enriched with probe 4 from Tab 6. (Tab 20): Compiled targets from the ABPP-SILAC analysis of soluble proteome of H1975 cells treated with lysosomal neutralizing agents followed by in situ probe 4 (1 µM, 4 hr) treatment. (Tab 21–24): MS-based proteomic data sets (including biological replicates) for experiments in Tab 20 where each experiment is displayed in a separate tab including both processed (MOD) and unprocessed (RAW) data. (Tab 25) Compiled cysteine proteases identified from mouse livers treated with either vehicle or 25 mg/kg inhibitor 1 (6 hr) and enriched with probe DCG-04. (Tab 26–27): MS-based proteomic data sets (including biological replicates) for probe 4 enrichments from mouse livers treated with either vehicle or 25 mg/kg inhibitor 1 (6 hr) including both processed (MOD) and unprocessed (RAW) data. (Tab 28–29): MS-based proteomic data sets (including biological replicates) for DCG-04 enrichments from mouse livers treated with either vehicle or 25 mg/kg inhibitor 1 (6 hr) including both processed (MOD) and unprocessed (RAW) data.
(Tab 1–6): Sequence and ratios for all peptides identified in probe 4 enrichments in H1975 cells. (Tab 7–12): Sequence and ratios for all peptides identified in 1 µM inhibitor 1 competition experiments with probe 4 in H1975 cells. (Tab 13–18): Sequence and ratios for all peptides identified in 10 µM inhibitor 1 competition experiments with probe 4 in H1975 cells. (Tab 19–24): Sequence and ratios for all peptides identified in probe 5 enrichments in H1975 cells. (Tab 25–30): Sequence and ratios for all peptides identified in 10 µM inhibitor 2 competition experiments with probe 5 in H1975 cells. (Tab 31–36): Sequence and ratios for all peptides identified in probe 6 enrichments in H1975 cells. (Tab 37–42): Sequence and ratios for all peptides identified in 10 µM inhibitor 3 competition experiments with probe 6 in H1975 cells. Median protein values for tabs 1–42 can be found in Dataset S1, with the insoluble and soluble proteome fractions combined. (Tab 43–46): Sequence and ratios for all peptides identified in livers from mice treated with either vehicle or 25 mg/kg inhibitor 1 (6 hr) and enriched with probe DCG-04. (Tab 47–50): Sequence and ratios for all peptides identified in livers from mice treated with either vehicle or 25 mg/kg inhibitor 1 (6 hr) and enriched with probe 4. (Tab 51–52): Sequence and ratios for all peptides in soluble proteome of H1975 cells treated with bafilomycin A1 followed by in situ treatment with probe 4. (Tab 53–55): Sequence and ratios for all peptides identified from the soluble proteome of H1975 cells treated with NH4Cl followed by in situ treatment with probe 4.