

Summary
Histone deacetylase (HDAC) catalytic activity is regulated by formation of co-regulator complexes and post-translational modification. Whether these mechanisms are transformed in cancer and how this affects the binding and selectivity of HDAC inhibitors (HDACi) is unclear. In this study, we developed a method that identified a 3-16-fold increase in HDACi selectivity for HDAC3 in triple negative breast cancer cells (TNBC) in comparison to luminal subtypes that was not predicted by current practice measurements with recombinant proteins. We found this increase was caused by c-Jun N-terminal kinase (JNK) phosphorylation of HDAC3, was independent of HDAC3 complex composition or subcellular localization, and was associated with a 5-fold increase in HDAC3 enzymatic activity. This study points to HDAC3 and the JNK axes as targets in TNBC, highlights how HDAC phosphorylation affects HDACi binding and selectivity, and outlines a method to identify changes in individual HDAC isoforms catalytic activity, applicable to any disease state.
eTOC Blurb
Hanigan et al. developed a method to identify relevant HDAC isoforms associated with inhibitor efficacy in breast cancer cells. They found c-Jun N-terminal kinase phosphorylation increases inhibitor binding and selectivity, and causes divergent regulation of HDAC3 in triple negative versus luminal cells.

Introduction
Aberrant changes in the epigenetic landscape of chromatin is a hallmark of cancer (Consortium, 2012). These changes are a function of the enzymes that catalyze the reading, writing, and erasing of the post translational modifications (PTM) on DNA and associated histones. Histone deacetylase (HDAC) is a family of enzymes responsible for catalyzing the removal of acetyl marks from histone proteins and, as such, have been implicated in a number of different cancers, including breast cancer (Glozak and Seto, 2007). While HDAC inhibitors (HDACi) have shown promise as breast cancer therapeutics (Munster et al., 2009, Luu et al., 2008), HDACs are intimately involved in normal cellular signaling and some of the 18 human isoforms or classes of these isoforms have been shown to be involved with tumor suppression (Taylor et al., 2011, Ropero et al., 2006, Bhaskara et al., 2010, Heideman et al., 2013, Pulukuri et al., 2007). Given the pleiotropic nature of HDACs in cancer, the current paradigm is to selectively inhibit one or more of the 18 human isoforms associated with tumor initiation and progression (Ontoria et al., 2009, Khan et al., 2008, Fournel et al., 2008, Balasubramanian et al., 2008). However, it remains unclear which isoforms are important to target for efficacy in breast cancer. Correlational studies between individual isoform expression and disease state in breast cancer have been disparate (Lapierre et al., 2016, Zhang et al., 2005b, Muller et al., 2013, Hsieh et al., 2016). In addition to expression, HDAC activity can be regulated through formation of multi-protein complexes and PTM (Zhang et al., 1999, Guenther et al., 2000, Zhang et al., 2005a, Pflum et al., 2001). Whether these mechanisms are transformed in breast cancer, or any other disease state, remains unclear owing to a lack of methodology to easily identify changes in HDAC catalytic activity. If these changes are occurring, it will also be important to ascertain how this regulation affects HDACi binding in cells, subsequently termed target engagement.
Considering that photoreactive probes have already proven to be invaluable tools to probe HDACs in live cells (Salisbury and Cravatt, 2007, Xu et al., 2009), we designed photomate, a novel photoreactive hydroxamic acid based HDAC inhibitor probe. We compared the inhibition and binding of photomate to recombinant HDACs with engagement of HDACs in a panel of diverse breast cancer cell lines. We found that a subset of HDAC isoforms was differentially engaged in a cell type dependent fashion, which was not predicted by assays with recombinant HDACs. Of particular interest, increased engagement of the class I HDAC3 was observed exclusively in TNBC cell lines. Following up on this observation, we systematically investigated the mechanisms contributing to photomate’s divergent engagement of HDAC3 and found that its phosphorylation, through c-Jun N-terminal kinase, regulated HDACi target engagement. Ultimately, these differences reflected a change in the isoforms catalytic activity. Taken together we show a mechanism by which aggressive triple negative breast cancer (TNBC) cells regulate the catalytic activity of an individual HDAC isoform. Given the efficacy of HDACi in these cell types, this isoform may serve as a pertinent drug target. In addition, we clearly show that regulation of this isoform affects inhibitor engagement and selectivity in cells, which should be useful to increase accuracy in predicting HDACi selectivity in vivo. Furthermore, the pathway responsible for this type of regulation could be used to attenuate the effect of HDACi given this pathway controls HDACi engagement.
Results
Design and synthesis of a photoreactive hydroxamate based probe (photomate)
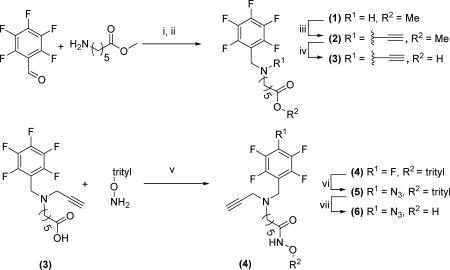
In general, hydroxamic acid-based HDAC inhibitors, such as the archetypal inhibitor suberoyl anilide hydroxamic acid (SAHA) consist of three components: a) a zinc binding group, e.g. hydroxamic acid, to chelate the catalytic zinc in the active site of HDAC; b) a surface binding “cap” group to interact with the rim of the active site of HDAC; and c) a “linker” to connect the hydroxamic acid to the “cap” group (Figure 1A). Photomate incorporates a tetraflurophenyl azide (TFPA) photoactivatable moiety, and an alkyne arm as the “cap” group, joined at a tertiary amine and connected via a 5-carbon “linker” to a hydroxamic acid. This trifunctional design allows photomate to bind to the active site of HDACs and form covalent adducts with proximal proteins upon UV irradiation of the TFPA moiety. The alkyne arm facilitates the coupling of probe-protein adducts bioorthogonally via copper catalyzed 1,3-cycloaddition to an azide-conjugated fluorescent tag for visualization or biotin tag for enrichment and analysis.
Figure 1. Photomate inhibits and labels class I and II recombinant HDACs.

A) Comparison of the archetypal pan HDAC inhibitor SAHA (Left) and photomate (right) B) IC50 measurements using recombinant class I or class II HDACs and fluorogenic substrates. C) Gel based visualization of recombinant proteins labeled with photomate (lane 1) or photomate and SAHA (lane 2) followed by click reaction with azide conjugated IRDye (gel is in greyscale). D) Relative potency or affinity as measured by pIC50 or labeling density. pIC50 or labeling density values were standardized to their mean and deviation and plotted. Data is shown as mean ± s.d. E) Gel based visualization as in B) with standard dilutions of recombinant HDAC3. All results are representative of at least 3 independent experiments.
Photomate inhibits and labels class I and II HDACs
Using a traditional assay of isoform selectivity, we first verified that photomate was an inhibitor of recombinant class I and II HDACs using a fluorogenic assay. We found photomate potently inhibits all class I HDACs with IC50 ranging from 0.109 µM (HDAC3) to 2.27 µM (HDAC8), and inhibited HDAC4, a representative class II HDAC with IC50 of 20.11 µM (Figure 1B). Next, we explored photomate binding to recombinant HDACs by photolabeling individual isoforms with photomate, or with photomate and excess SAHA (Figure 1C). Photomate-protein adducts were reacted with an azide conjugated 800CW IRDye for gel based visualization. We observed effective labeling of all the recombinant class I and representative class II HDACs (Figure 1C). Labeling of all HDAC isoforms was lost upon co-incubation with SAHA (Figure 1C), indicating the labeling was active site dependent. Additionally, we found photomate could detect at least 0.1 µg HDAC3 with this method (Figure 1E). Comparison of the relative potency or affinity based on inhibition or labeling respectively (Figure 1D) shows that photomate is nonselective for HDAC1, 2 and 3 but shows decreased potency and affinity with respect to HDAC8 and the class II HDAC4.
Photomate differentially targets HDACs depending on cell type
To characterize the HDAC isoforms targeted by photomate in a cellular context where the mechanisms that regulate HDAC activity are intact, we conducted in situ photolabeling experiments in a panel of seven breast cancer cell lines (Figure 2). Altogether these cell lines represent the spectrum of breast cancer molecular subtypes, including luminal A (MCF-7, T47D), luminal B (ZR75-1), basal A (BT-20, MDA-MB-468), basal B (MDA-MB-231) and an additional cell line that does not fit into the classical breast cancer subtypes (MDA-MB-453). Cells growing in monoculture were incubated with photomate, photomate and excess SAHA or vehicle control, followed by irradiation with 365 nm light. We reacted photomate labeled samples with an azide conjugated biotin tag for enrichment with streptavidin coated beads and identification by western blot (Figure 2) and MS/MS analysis (MCF7 cells only, Table S1, Figure 3C) or with an 800CW IRDye azide tag for gel based visualization (Figure S2). Proteins enriched in photomate labeled samples were compared to samples co-treated with excess SAHA, as well as samples treated with vehicle control and were considered specific if the fluorescence density or spectral count was decreased by greater than 50% in samples co-treated with photomate and excess SAHA and were not identified in vehicle controls. To account for variation in protein expression, we quantified the relative abundance of each class I and II HDAC in the cell lines (Figure 2B) and normalized the amount of each isoform that was specifically enriched to its relative abundance. These normalized values were then plotted with respect to the mean for each isoform across all cell types (Figure 2D, E).
Figure 2. Photomate differentially targets HDACs depending on cell type.

A) Western blot analysis photomate enriched fractions from seven breast cancer cell lines labeled in situ with photomate or photomate and excess SAHA. Samples were reacted with biotin azide tag, and enriched with streptavidin coated magnetic beads. Antibodies for all class I and II HDACs were used for detection. Blot shows enriched fraction eluted off beads. Individual HDAC isoforms across all cell lines are blown up to the right and shown in greyscale for clarity B) 10% input from each cell line used for enrichment experiments shown in A) HDAC Antibodies for all class I and II HDACs were used for detection. C) Total protein staining of gel featured in B). D) Quantification of enrichment experiments shown in A, B and C. Relative total abundance of each isoform across all cell types were normalized to total protein staining. Quantified enriched amounts of each isoform were then divided by the normalized total abundance of each isoform per cell line. These normalized values were then plotted with respect to the mean for each isoform across all cell types. All gels are representative of three individual experiments. Data is expressed as mean ± s.d. E) As in D) but only for HDAC3 and without normalizing to the mean. Significantly different (P<0.0001) values are separated by color (black and white). Data is expressed as mean ± s.d. For gel based visualization of photomate targets see Figure S2.
Figure 3. Divergent engagement of HDAC3 is independent of compartmentalization or protein complex composition.

A) Western blot analysis of MCF-7 cells labeled in situ with photomate (lane 1 and 4), photomate and SAHA (lane 3 and 5) or DMSO (lane 6), reacted with biotin azide tag, and enriched with streptavidin coated magnetic beads. Blot shows enriched fraction eluted off beads and 2.5% of input recognized by anti-HDAC1, 2 and 3 antibodies. B) Graph of the abundance of each class I HDAC in MCF-7 cells quantified by comparison of MCF-7 lysate to a standard curve of each recombinant class I HDACs; visualized by Western blot (Figure S1). C) MS/MS analysis of photomate enriched fractions, as in A). Pie chart on the right shows total number of proteins identified by MS/MS and the number that were specifically enriched when compared to a DMSO control and were decreased by at least 50% when co-treated with SAHA. On the left, bioinformatic annotation of enriched proteins. All specifically enriched proteins are shown in Table S1. D) Gel based visualization of MCF-7 cells labeled with photomate in situ followed by fractionation into cytosol (right) and nucleus (left). Probe staining is shown above, and antibody recognition of the same gel is shown below. Gels are in grey scale for clarity. E) Western blot analysis of HDAC3 co-immunoprecipitates. MDA-MB-231 cells, or MCF-7 cells were lysed and enriched with polyclonal anti-HDAC3 (Abcam) or rabbit IgG protein A bead conjugates (Lanes 2 and 3 respectively). Eluates were analyzed by western blot along with 10% of Input (Lane 1) and blotted with antibodies for complex components. F) Small interfering RNA knockdown of NCOR1 in MCF-7 cells. MCF-7 cells were transfected with siNCOR1 or siControl, followed by labeling with photomate and electrophoretic separation. Antibody recognition of transfected cells is shown above, followed by gel based visualization of photomate engagement of HDAC1and HDAC3 below. Cells were either incubated with photomate (Lane 1) or photomate and excess SAHA (Lane 2) after transfection. All results are representative of at least 3 independent experiments.
In general, we found photomate ubiquitously targeted and enriched HDAC1, 2 and 9 from every cell line (Figure 2A, D). For these isoforms, the amounts enriched from each cell line correlated well with their relative expression in that cell line. This is reflected in the small range and standard deviation of the relative enriched amounts of these HDAC isoforms across all cell lines as shown in Figure 2D. However, all other class I and II HDACs were enriched only in a subset of cell types. For HDAC4 and 7, this was a result of only a subset of cell lines expressing this isoform (T47D, MDA-MB-468). On the other hand, the amounts of HDACs 3, 6, 8, 10 and 11 enriched by photomate did not correlate with their relative expression. For example, we found significantly (P<.0001) increased amounts of HDAC3 were enriched from TNBC cell lines (black bars, Figure 2E) in comparison to luminal subtypes like MCF-7 (white bars, Figure 2E) despite increased expression in many of the luminal subtypes (Figure 2B). To illustrate this point we quantified the absolute abundance of each class I HDAC in MCF-7 cells, a cell line where we found little to no HDAC3 enrichment by Western blot (Figure 3B, Figure S1). HDAC1, 2, and 3 expression was very similar, with 1.92×10⁶, 5.14×10⁵, and 8.37×10⁵ copies/cell, respectively. Notably, HDAC2 abundance is 1.6-fold lower than that of HDAC3, yet was enriched by photomate in this cell line while HDAC3 was not (Figure 3A, Figure 3B). This finding is of particular interest given the trend differentiating TNBC and luminal subtypes but also because it contradicts our in vitro experiments showing photomate should be equipotent for HDAC1, 2 and 3. In addition, we comprehensively analyzed photomate targets in MCF-7 cells by MS/MS (Figure 3C, Table S1). This experiment matched Western blot analysis in that HDAC1 and 2 were the only HDAC targets in this cell line, and also helped characterize several other non-HDAC zinc containing enzymes or HDAC complex partners.
Divergent engagement of HDAC3 is independent of compartmentalization or protein complex composition
Given the variation in HDAC3 and other class I and II HDAC engagement, we sought to gain insight into the mechanisms contributing to this variation. We investigated HDAC3 because its inhibition is generally thought to contribute to the efficacy of all FDA approved HDACi (Mottamal et al., 2015) and the mechanisms regulating its activity have been extensively explored. As HDAC3 translocates between nucleus and cytosol, we verified if photomate and HDAC3 have overlapping subcellular distribution. To do this we labeled MCF-7 cells, a cell line where photomate did not enrich HDAC3, followed by biochemical fractionation into cytosolic and nuclear portions (Figure 3D). Prominent labeling of HDAC1 and 2 was observed in the nucleus, showing photomate can permeate the nuclear membrane. Antibody staining of the nuclear fraction showed that the majority of HDAC3 was in the nucleus as well, however, no labeling event was observed (Figure 3D).
In addition to subcellular localization, HDAC3 activity is regulated by formation of multi protein complexes. Given this has been shown to affect HDACi selectivity, we analyzed the stable components of the HDAC3 complex from cell lines that do (MDA-MB-231) or do not (MCF-7) show distinct photomate engagement of HDAC3 by co-immunoprecipitation. Figure 3E shows Western blots of the immunoprecipitates enriched by a polyclonal HDAC3 antibody (Abcam). Known stable protein partners, TBL1, GPS2 and NCOR1, were co-immunoprecipitated with HDAC3 from MCF-7 cells, however, we noticed NCOR1 was not enriched from MDA-MB-231 cells, the cell line with robust labeling of HDAC3. As NCOR1 and 2 are capable of directly activating HDAC3 enzymatic activity, we envisioned that this might also be capable of influencing photomate engagement of HDAC3. However, siRNA knock down of NCOR1 in MCF-7 cells did not result in an increase in HDAC3 labeling (Figure 3F). Together these findings suggest NCOR1 and potentially the protein complex composition are in general, not the underlying cause of the lack of HDAC3 labeling.
HDAC3 engagement is correlated with its phosphorylation status
In addition to transcriptional control of expression, subcellular localization, and co-repressor complex formation, HDAC3 is regulated by PTM. Phosphorylation of serine 424 occurs on the c-terminus of HDAC3 and increases its activity (Zhang et al., 2005a). To investigate differences in HDAC3 phosphorylation, we utilized a phospho (ser-424) HDAC3 specific antibody. We first validated the phospho HDAC3 (pHDAC3) antibodies specificity by phosphorylating recombinant HDAC3 using casein kinase II (CK2) (Zhang et al., 2005a). Figure S4A shows HDAC3, incubated with CK2 in the presence of ATP, is recognized more by the pHDAC3 antibody, over HDAC3 incubated with CK2 only.
Additionally, we found that the polyclonal HDAC3 antibody from Abcam, used previously in this paper, equally recognized both the phosphorylated and non-phosphorylated forms of HDAC3 and that an antibody from Millipore recognized only the non-phosphorylated HDAC3 (Figure S4A).
Using these antibodies, we surveyed the phosphorylation state of HDAC3 in the panel of cell lines and found significant (P<0.0001) differences in the amounts of phosphorylated HDAC3 existed across cell types (Figure S3). Comparison of photomate’s HDAC3 engagement and total pHDAC3 abundance shows a very high correlation (R2 = 0.822) suggesting a linear relationship between photomate engagement of HDAC3 and its phosphorylation state (Figure 4A). Comparison of photomate’s engagement of HDAC3 in comparison to HDAC1, normalized to their respective abundance (Figure 4B), shows that selectivity for HDAC3 is significantly increased in those cell lines with highly phosphorylated HDAC3 (P<.0001) and in comparison to in vitro experiments with recombinant HDACs.
Figure 4. HDAC3 phosphorylation directly increases inhibitor binding.

A) Comparison of HDAC3 engagement versus relative abundance of phosphorylated HDAC3 (pHDAC3) protein; as quantified by Western blot (Figure S3). Linear regression and R square are shown. B) Statistically significant differences in photomate selectivity for HDAC3 compared to HDAC1 across cell lines and in comparison to selectivity based on in vitro potency. One way Anova shows P<.0001. Data is shown as mean ± s.d. C) Gel based visualization of recombinant HDAC3 incubated with CK2 and ATP or with CK2 and vehicle followed by labeling with photomate. Probe labeling is shown at the top followed by staining with antibody staining below. D) Differential labeling of FLAG tagged HDAC3 mutants. MDA-MB-231 cells were transfected with mutant or control HDAC3 plasmids, labeled with photomate (all lanes) and enriched with FLAG antibodies. Visualization of probe or antibody signals of the immunoprecipitates are shown above, and input staining of the phosphorylated HDAC3 below. E) Enzymatic activity of HDAC3 and pHDAC3 was analyzed using a synthetic class I HDAC substrate. Activity is expressed in µM Substrate/Hour. Students t-test shows P<.0001. Data is expressed as mean ± s.d. All results are representative of at least 3 independent experiments.
HDAC3 engagement is directly affected by its phosphorylation
To test whether HDAC3 phosphorylation was capable of directly affecting photomate binding, we evaluated photomate’s ability to label recombinant phosphorylated HDAC3 in comparison to recombinant HDAC3. What we observed was over 4-fold increase in photomate labeling of phosphorylated HDAC3 (Figure 4C). This experiment shows that HDAC3 phosphorylation alone is capable of causing an increase in photomate binding to HDAC3. We verified this was also the case in cells by transfecting plasmids for either a S424A, S405A, or control FLAG tagged HDAC3 into MDA-MB-231 cells followed by photomate labeling and enrichment with FLAG antibodies. In agreement with the binding experiments using recombinant phosphorylated HDAC3, we found the S424A mutant had decreased photomate labeling in comparison to the S405A and control FLAG HDAC3, both of which became phosphorylated after expression (Figure 4D). This conclusion seems rationale as others have proposed that HDAC3 activity increases in cells upon phosphorylation (Zhang et al., 2005a). A change in HDAC3 enzymatic activity is likely due to changes in its tertiary structure which would also interfere with photomate binding. To verify that the enzymatic activity of HDAC3 is indeed increased when phosphorylated, we compared phosphorylated HDAC3’s ability to deacetylate a synthetic fluorogenic substrate to that of recombinant HDAC3. As seen in Figure 4E, the activity of phosphorylated HDAC3 is on average five times greater than that of the non-phosphorylated HDAC3. Taken together, these experiments suggest that phosphorylation of HDAC3 at serine 424 directly affects both photomate binding and HDAC3 activity in vitro and in cells.
c-Jun N-terminal kinase controls HDAC3 phosphorylation and photomate engagement of HDAC3
After establishing that phosphorylation of HDAC3 governs inhibitor binding, we sought to understand the cause of the differential HDAC3 phosphorylation between cell lines. Because CK2 readily phosphorylates recombinant HDAC3, we hypothesized that differential CK2 activity leads to the variation in HDAC3 phosphorylation. To test this hypothesis, we treated MDA-MB-231 cells with two structurally diverse kinase inhibitors that have been shown to potently inhibit CK2 activity (TBB, and LY294002) (Gray et al., 2014, Gharbi et al., 2007), followed by labeling with photomate. Neither of the compounds induced any change in HDAC3 engagement or phosphorylation state, despite significantly changing phosphorylation of CK2 substrates AKT or c-Jun (Figure S4b, Figure 6H, I). In addition to CK2, it has been shown that GSK3b, can phosphorylate HDAC3 in neurons (Bardai and D'Mello, 2011). However, addition of the GSK3b inhibitor AR-A014418 did not affect HDAC3 phosphorylation or photomate engagement (Figure S5D). This is in line with the experiment using LY294002, as it has been shown to increase GSK3b activity through AKT in MDA-MB-231 cells (Li et al., 2014). Taken together these experiments suggest that the activity of CK2 or GSK3b does not affect HDAC3 phosphorylation in MDA-MB-231 cells.
Figure 6. JNK signaling controls HDAC3 phosphorylation.

A) Gel based visualization of MDA-MB-231 cells either treated with SP600125 or vehicle and labeled in situ with photomate or photomate and excess SAHA. Recognition of photomate labeled HDAC3 with antibodies is shown below. B) Western blot analysis of MCF-7 cells treated with SP600125, labeled with photomate or photomate and excess SAHA in situ, reacted with biotin azide tag, and enriched with streptavidin coated magnetic beads. Blot shows enriched fraction eluted off the beads and 2.5% of input stained with HDAC3 antibodies. C) As in A) substituting JNK 6o for SP600125. D) Gel based visualization of TNF-α treated cells either pretrated with TCS 6o or vehicle and labeled in situ with photomate (all lanes). Recognition of photomate labeled HDAC3 with antibodies is shown below. E) Western blot analysis of recombinant HDAC3 incubated with JNK in the presence or absence of ATP. F) Graph showing pJNK abundance in each cell line as quantified from Western blot in Figure S3. Data is shown as mean ± s.d. G) pJNK is detected in HDAC3 co-immunoprecipitates or IgG control. 10% of input is shown in lane 1. H) Western blot analysis of changes in several kinase pathways induced by treatment of MDA-MB-231 cells with all inhibitors used in this study and I) Quantification of H) normalized to treatment with vehicle. All results are representative of at least 3 independent experiments. Data is expressed as mean ± s.d.
Given the TNBC cell lines show HDAC3 labeling, but estrogen receptor (ER) positive luminal cell lines do not, we initially thought ER may play a role in decreasing HDAC3 phosphorylation and photomate engagement. We tested this hypothesis by incubating MCF-7 cells with tamoxifen, at a concentration shown to antagonize ER activity in MCF-7 cells (Frasor et al., 2006), or with siRNA specific for ERα, followed by labeling with photomate (Figure S4C, D). We found no increase in HDAC3 labeling or HDAC3 phosphorylation as a result of either of these experiments indicating ER expression or activity does not affect photomate engagement of HDAC3.
While TNBC cell lines do not rely on ER signaling to proliferate, many have constitutive activation of MAPK signaling, through increased expression of epidermal growth factor receptor (EGFR), or Ras mutation (Cossu-Rocca et al., 2015). As the NCOR-HDAC3 complex has been shown to be regulated by MAPK signaling (Jonas and Privalsky, 2004) , we hypothesized that this signaling pathway may increase photomate engagement of HDAC3. To test this hypothesis, we tried either removal or addition of known MAPK stimulating agents followed by labeling with photomate in MCF-7 cells. In opposition to our hypothesis, we found that serum starvation as well as treatment with the proinflammatory cytokine TNF-α induces specific labeling of HDAC3 in MCF-7 cells (Figure 5A–D, Figure S5A, I), whereas the addition of MAPK stimulating growth factors, EGF, and IGF-1 had no effect despite inducing changes in phosphorylation of AKT (Figure 5E, Figure S5B, I). In line with our experiments from Figure 4, showing photomate engagement of HDAC3 is associated with HDAC3 phosphorylation, the increase in HDAC3 labeling induced by serum starvation corresponded with a concomitant increase in HDAC3 phosphorylation, which was labile to λ phosphatase (Figure 5A, C). Additionally, we observed that most MCF-7 cells were aligned in G0/G1 upon serum starvation prior to labeling with photomate (Figure S5C). Taken together, these experiments show mitogen removal and inflammatory cytokine stimulation induce HDAC3 phosphorylation and photomate engagement of HDAC3, whereas addition of growth factors has no effect.
Figure 5. HDAC3 phosphorylation and photomate engagement is affected by cellular stress.

A) Gel based visualization of MCF-7 cells either serum starved or grown in medium supplemented with 10% FBS and labeled in situ with photomate or photomate and SAHA. Recognition of photomate labeled HDAC3 with antibodies is shown below. B) Western blot analysis of MCF-7 cells, serum starved, labeled with photomate or photomate and SAHA in situ, reacted with biotin azide tag, and enriched with streptavidin coated magnetic beads. Blot shows enriched fraction eluted off the beads and 2.5% of input stained with HDAC3 antibodies. C) Western blot analysis of pHDAC3 in MCF-7 cells either serum starved or grown in medium supplemented with 10% FBS. Each group was incubated with lambda phosphatase to remove any phosphate groups from HDAC3. D) Gel based visualization of MCF-7 cells either treated with TNF-α or vehicle and labeled in situ with photomate or phtoomate and SAHA. Recognition of the photomate labeled HDAC3 with antibodies is shown below. E) as in D) with EGF treatment in place of TNF-α. All results are representative of at least 3 independent experiments. (For additional experiments and controls see Figure S4 and S5)
Because removal of serum or inflammatory cytokine signaling increased HDAC3 phosphorylation and photomate engagement, we hypothesized that a stress activated protein kinase pathway, either NF-κB, p38, or JNK was responsible. To test this hypothesis, we used inhibitors of IKK (IKK-16), p38 (SB202190) or JNK (SP600125) at concentrations that altered phosphorylation of known substrates of their respective enzymes (Figure 6H, I), followed by labeling with photomate. We found that the JNK inhibitor abolished the labeling of HDAC3 (Figure 6A, B, Figure S5G, H), whereas the IKK inhibitor had no change and the p38 inhibitor increased labeling (Figure S5E, F). Because the JNK inhibitor decreased labeling, we again measured the phosphorylation state of HDAC3 in comparison to control and observed a complete loss of HDAC3 phosphorylation (Figure 6A, B). In addition to SP600125, we used another structurally distinct specific JNK inhibitor (TCS 6o) in conjunction with photomate labeling and found both HDAC3 labeling and phosphorylation were decreased (Figure 6C). In agreement with JNK phosphorylating HDAC3, we identified activated JNK (phosphorylated), in MDA-MB-231 cell lysates immunoprecipitated with HDAC3 antibodies (Figure 6G). Furthermore, there were higher levels of phosphorylated JNK detected in the group of cell lines that were previously shown to have increased HDAC3 phosphorylation and photomate engagement (Figure 6F). Finally, we found recombinant JNK1 in the presence of ATP phosphorylates recombinant HDAC3 (Figure 6E). These experiments demonstrate that increased JNK activity, leads to an increase in HDAC3 phosphorylation and HDAC inhibitor engagement of HDAC3 in the basal type cell lines. To test whether JNK activity also controls HDAC3 phosphorylation in luminal subtypes, we pretreated MCF-7 cells with JNK inhibitor (TCS 6o) and stimulated with TNF-α. We observed a decrease in HDAC3 labeling and phosphorylation in comparison to cells treated with TNF-α alone, and similar levels to cells treated with neither TNF-α or JNK inhibitor (Figure 6D).
Discussion
It has been shown that HDAC activity is aberrantly regulated in cancer by specific recruitment to genomic loci, and change in expression. In addition to these mechanisms, HDAC activity depends on formation of co-repressor complexes and PTM, however, it is unclear whether these mechanisms are transformed in cancer due to a lack of methodology. In this study, we provide the first evidence that HDAC phosphorylation is transformed in TNBC cell lines by analyzing the engagement of a novel photoreactive HDAC inhibitor probe. This method not only helps to understand a mechanism by which a subset of breast cancer cell lines regulate HDAC activity, but has implications for the future design and current understanding of the way HDAC inhibitors exert their effect.
Comparison of photomate’s selectivity, based on inhibition of, or binding to recombinant HDACs, versus its engagement of HDACs in cells revealed significant differences with respect to HDAC3 that did not correlate with HDAC3 abundance. While photomate could bind to and inhibit HDAC3 under the conditions used for determination of IC50, engagement in MCF-7 cells and other luminal cell types could not be detected. In contrast to this, we found TNBC cells had increased engagement of and selectivity for HDAC3 in comparison to recombinant HDACs. Differential engagement across cell types was also observed for most other class I and II HDACs, suggesting target engagement in cells can differ from in vitro predictions for these isoforms as well. As the development of selective HDACi is often guided by studies with recombinant HDACs, this variation clearly demonstrates that the actual target in a context of interest may be misrepresented by recombinant based assays.
Investigation into the mechanisms regulating HDAC3 binding revealed that HDAC3 phosphorylation, but not subcellular distribution or protein complex composition, directly controls photomate engagement. We found increased HDAC3 phosphorylation strongly correlated with engagement of HDAC3 in the cell lines under investigation. We validated that phosphorylation could directly control inhibitor binding, irrespective of other HDAC3 complex components, by comparing photomate binding to phosphorylated and non-phosphorylated recombinant HDAC3, which showed 4-fold higher photomate binding to phosphorylated HDAC3. We found this was true in cells as well because photomate engagement of a S424A HDAC3 mutant was decreased in comparison to control phosphorylated HDAC3. Furthermore, changing HDAC3 phosphorylation through inhibition of an HDAC3 kinase also significantly affects HDAC3 engagement in cells. In addition to differences in phosphorylation, we found that all known stable HDAC3 complex components were equally accounted for apart from NCOR1. Elimination of this discontinuity, however, did not influence photomate binding in cells, but tertiary structure of the remaining components, or binding of a transient or unknown component could potentially affect photomate binding concurrently with HDAC3 phosphorylation. Based on this data, accounting for phosphorylation when conducting in vitro assays may lead to a more accurate assessment of selectivity in cells.
In addition to its effect on inhibitor binding, we found phosphorylation of recombinant HDAC3 exhibits 5-fold higher catalytic activity compared to the non-phosphorylated protein. Because TNBC cells have increased HDAC3 phosphorylation in comparison to luminal subtypes and thus increased HDAC3 catalytic activity, they may be more reliant on its catalytic activity. As we have observed photomate (Figure S2B), as well as other HDACi (Tate et al., 2012, Uehara et al., 2012), have increased efficacy in TNBC cells, HDAC3 may be a pertinent isoform to target for treatment of TNBC. However, cell type based variation in other isoforms was observed, and likely contributes to the variation in efficacy as well. A follow up study with a larger set of cell lines or patient derived samples would be necessary to determine statistically significant correlations between targeted HDACs and efficacy.
Others have observed cell type dependent effects of HDACi in transformed cells as well, which may be explained by the differences in HDACi selectivity observed in this study. For example, many cell-based and in vivo studies have shown different mechanisms of cell death in response to HDACi, including activation of intrinsic (Insinga et al., 2005, Singh et al., 2005) versus extrinsic (Chakraborty et al., 2013, Ruefli et al., 2001) apoptotic pathways, or cell cycle arrest through induction of CDKN1A (Richon et al., 2000, Sandor et al., 2000) leading to cell type dependent efficacy. To account for these differences and determine where treatment with HDACi may be beneficial, diagnostic indicators of HDACi efficacy are needed. While several genomic approaches correlating HDACi response with mutational landscape or changes in basal gene expression serve as invaluable tools to identify prognostic markers associated with HDACi efficacy (Rees et al., 2016, Garnett et al., 2012), our study compliments this approach by identifying direct changes in HDAC binding, selectivity and enzymatic activity, which may also affect HDACi efficacy.
Although we explored a number of different key pathways shown to involve HDAC3, including ER (Liu and Bagchi, 2004), CK2 (Zhang et al., 2005a), NF-κB (Gao et al., 2005), p38 (Mahlknecht et al., 2004) and other MAPK mediated signaling, we found only the JNK pathway regulates HDAC3 phosphorylation. Others have observed a connection between JNK and HDAC3 as well (Weiss et al., 2003, Zhang et al., 2002); we add that increased JNK phosphorylation leads to HDAC3 phosphorylation, which affects both enzymatic activity and inhibitor binding in basal breast cancer cells in comparison to luminal subtypes. This is in line with other observations showing luminal breast cancer cells often have inactivating mutations to MAP3K1 and MAP2K7, the kinases directly upstream from JNK that are responsible for its phosphorylation and activation (Ellis et al., 2012). We envision that measuring HDAC3 phosphorylation and/or JNK pathway mutations such as MAP3K1 and MAP2K7 could serve as diagnostic markers for predicting cellular response to treatment with HDACi. Finally, preclinical data suggests that inhibition of MAPK signaling, specifically the EGFR, in conjunction with HDACi is more effective in a broad range of cancer types (Lai et al., 2010, Bruzzese et al., 2011) and clinical trials are ongoing. Our study provides rationale for co-targeting the JNK pathway, a specific downstream component of an individual MAPK pathway, with HDAC3 to enhance the effects of HDACi in cancer therapy.
Beyond breast cancer, comparison of the differences in photomate binding to recombinant proteins against any disease state of interest should ultimately serve as a method to determine differences in catalytic activity of an individual HDAC isoform between these contexts; exposing novel drug targets and novel HDAC regulatory mechanisms.
Significance
Abnormal histone modifications are a hallmark of cancer. Histone deacetylase is a family of enzymes, comprised of 18 human isoforms that catalyze the removal of acetyl marks from histone tails. HDACs have been shown to be aberrantly recruited to specific genomic loci and expression of individual isoforms is often altered in a number of cancer types. HDAC catalytic activity is also regulated post translationally by phosphorylation, subcellular localization, and protein complex formation. However, it is unclear whether these mechanisms are utilized in cancer, as no methods to detect these changes for individual isoforms exist. Given the interest in development of isoform selective HDACi, it is also important to determine what affect this type of regulation has on HDACi target engagement. In this paper, we developed a novel method that enabled the discovery of divergent regulation of HDAC3 through phosphorylation by c-Jun N-terminal kinase (JNK) in TNBC, and observed variable cellular selectivity, which was not predicted by standard measurement with recombinant enzymes. Identification of this HDAC3 regulation and its effect on inhibitor binding will allow development of compounds targeting phosphorylated HDAC3 or combination therapies involving the JNK axis, improve prediction of HDACi selectivity in vivo, and outline a method for detecting changes in an individual HDAC isoforms catalytic activity in any disease state of interest.
Contact for Reagent and Resource Sharing
Further information and requests for reagents may be directed to Dr. Pavel Petukhov (pap4@uic.edu)
Experimental Model and Subject Details
Cellular Models
Human cell lines MCF-7 and T47-D were obtained from Dr. Debra Tonetti (University of Illinois at Chicago) and were maintained in RPMI supplemented with 2 mM L-glutamine, 10% FBS, 1% non-essential amino acids, 1% antibiotics penicillin-streptomycin and 0.01 mg/ml human recombinant insulin at 37 °C in 5% CO2. The cell line ZR75-1 was obtained from ATCC and was maintained in RPMI supplemented with 2 mM L-glutamine, 1 mM sodium pyruvate, 10% FBS, 10 mM HEPES, 1% non-essential amino acids, and 1% antibiotics penicillin-streptomycin at 37 °C in 5% CO2. The breast cancer cell lines MDA-MB-231, MDA-MB-468, MDA-MB-453 and BT20, obtained from Dr. Clodia Osipo (Loyola University Chicago), Dr. Elizaveta Benevolenskaya (University of Illinois at Chicago), Dr. Angela Tyner (University of Illinois at Chicago) and Dr. James Radosevich (University of Illinois at Chicago) respectively, were routinely maintained in IMEM media (Corning) supplemented with 2mM L-glutamine, 10 mM HEPES, 10% FBS, 1% non-essential amino acids and 1% antibiotics penicillin-streptomycin at 37 °C in 5% CO2. Cell line authentication is routinely performed for MCF-7, T47D and MDA-MB-Cells using short tandem repeat (STR) methodology. All cell lines are routinely evaluated for mycoplasma contamination.
Method Details
Fluorogenic enzymatic assays for class I HDAC isoforms
Photomate IC50 for class I recombinant HDACs was measured using previously published procedures (He et al., 2009, Neelarapu et al., 2011). All recombinant enzymes were purchased from BPS Bioscience. Photomate inhibits HDAC1, 2, 3 and 8 with LogIC50 of −6.38 ± .08, −6.88 ± 0.06, −6.96 ± 0.06, and −5.64 ± 0.06, respectively. The data is reported as the average ± s. e. (n=3).
General procedure for photolabeling in live cells
For whole cell analysis: cells were plated in 6 cm dishes and grown to 90% confluence in 2 mL culture medium. The medium was replaced with 1 mL culture medium and pretreated with competitor (SAHA, 200 µM or DMSO control where applicable and then treated with 10 µM photomate or DMSO control. After 40 min at 37 °C, the cells were cooled to 4 °C and irradiated with 366 nm light (35 J/cm2). The medium was removed and the cells gently washed twice with PBS and then covered with 1 mL PBS. Cells were scraped from plate into Eppendorf tubes, spun down at 1,000 g for 5 minutes at 4 °C, the supernatant removed and the cells resuspended in photolabeling lysis buffer (50 mM HEPES (pH 7.5), 150 mM NaCl, 0.7% Igepal, 5% glycerol, 1× protease inhibitor cocktail (Roche) and 1× phosphatase inhibitor cocktail (ThermoFisher)). Samples were homogenized by vortexing, incubated on a rotating stand at 4 °C for 1 hour, spun down at 20,000 g for 10 minutes at 4 °C and the protein concentrations were determined by bicinchoninic acid assay (BCA). For gel based visualization, 35.2 µg of total lysate was incubated with 800CW azide conjugated IRDye at a concentration of 1.5× the probe, TCEP (0.25 mM), TBTA (0.1 mM), and CuSO4 (0.50 mM) for 90 minutes at rt. Samples were then diluted with sample loading buffer, heated to 70 °C for 10 minutes and separated by gel electrophoresis. Gels were transferred to nitrocellulose membranes with iBlot transfer system (P3 for 7 minutes) and visualized with Odyssey Sa imager. Membranes were then blocked with odyssey blocking buffer for 2 hours at 4 °C, incubated with desired antibodies overnight at 4 °C, washed 3× 5 minutes with PBST, incubated with relevant species of 680RD IRDye conjugated secondary antibody for 1 hour and simultaneously visualized at 700 and 800 nm with Odyssey Sa imager. Signals that 1) were competed by SAHA by at least 50% (quantified by densitometry) and 2) co-stained with a specific class I HDAC antibody were further analyzed.
For enrichment on streptavidin coated magnetic beads, 1 mg photomate labeled cell lysate was incubated with azide conjugated biotin according to 1.5× concentration of probe, TCEP (0.25 mM), TBTA (0.1 mM), and CuSO4 (0.50 mM) for 90 minutes at rt. Samples were then left at −20 °C overnight. Precipitated protein was spun down at 6,000 × g for 4 minutes at 4 °C, and resuspended with brief sonication in 1 mL cold methanol. This was repeated twice and the pellets were resuspended in 1 mL 0.22% SDS in PBS by brief sonication and 10 minutes of heating at 60 °C. Next, 20 uL of Dynabeads M-280 (ThermoFisher) were washed 2 × with 0.22% SDS in PBS, added into each reaction and incubated for 1.5 hours at rt. Beads were removed with a magnet and then washed 2 × with 0.22% SDS in PBS (500 µL), 2 × with modified PBS (500 mM NaCl) and 2 × with PBS.
For Western blot analysis, bound proteins were then suspended in LDS loading buffer and heated at 70 °C for 10 minutes. Beads were removed with magnet and samples separated by gel electrophoresis at 100 volts. Gels were transferred to nitrocellulose membranes with iBlot transfer system (P3 for 7 minutes), blocked with odyssey blocking buffer for 2 hours at 4 °C, incubated with desired antibodies at 4 °C, washed 3× 5 minutes with PBST, incubated with relevant species of 680RD IRDye conjugated secondary antibody for 1 hour and visualized with Odyssey Sa imager.
For mass spectrometry based analysis, bound proteins were eluted in laemmli sample buffer, boiled for 10 minutes and eluant collected in a fresh Eppendorf tube. These samples were loaded onto a 15% gel and run into the gel approximately 1 inch at 20 volts (1 hour). One gel slab per lane was excised and gel pieces were destained in 50 mM NH4HCO3 in 50% ACN (v/v) until clear. Gel pieces were dehydrated with 100 µl of 100% ACN for 5 min, the liquid removed, and the gel pieces rehydrated in 10 mM DTT and incubated at 5 °C for 60 min. Gel pieces were again dehydrated in 100% ACN, liquid was removed and gel pieces were rehydrated with 55 mM IAA. Samples were incubated at room temperature, in the dark for 45 min. Gel pieces were washed with 50 mM NH4HCO3 and dehydrated with 100% ACN. Gel pieces were rehydrated with 10 ng/µl trypsin, resuspended in 50 mM NH4HCO3 on ice for 1 h. Excess liquid was removed and gel pieces were digested with trypsin at 37 °C overnight. Peptides were extracted with 50% ACN/5% FA, followed by 100% ACN. Peptides were dried to completion and resuspended in 2% ACN/0.1%FA. Peptides were cleaned with C18 ZipTips (Millipore) according to the manufacturer’s instructions, followed by LC-MS/MS analysis.
Mass Spectrometry Analysis
The tryptic peptides were dissolved in 0.1% FA, directly loaded onto a reversed-phase pre-column (Acclaim PepMap 100, Thermo Scientific). Peptide separation was performed using a reversed-phase analytical column (Acclaim PepMap RSLC, Thermo Scientific). The gradient was comprised of an increase from 6% to 35% solvent B (0.1% FA in 98% ACN) over 12 min and climbing to 80% in 4 min then holding at 80% for the last 4min, all at a constant flow rate of 400 nl/min on an EASY-nLC 1000 UPLC system, The resulting peptides were analyzed by Q ExactiveTM hybrid quadrupole-Orbitrap mass spectrometer (ThermoFisher Scientific). The peptides were subjected to NSI source followed by tandem mass spectrometry (MS/MS) in Q ExactiveTM (Thermo) coupled online to the UPLC. Intact peptides were detected in the Orbitrap at a resolution of 70,000. Peptides were selected for MS/MS using NCE setting as 28; ion fragments were detected in the Orbitrap at a resolution of 17,500. A data-dependent procedure that alternated between one MS scan followed by 20 MS/MS scans was applied for the top 20 precursor ions above a threshold ion count of 1E4 in the MS survey scan with 15.0 s dynamic exclusion. The electrospray voltage applied was 2.0 kV. Automatic gain control (AGC) was used to prevent overfilling of the Orbitrap; 5E4 ions were accumulated for generation of MS/MS spectra. For MS scans, the m/z scan range was 350 to 1800. The resulting MS/MS data were processed using Mascot search engine (v.2.3.0). Tandem mass spectra were searched against Swissprot Homo Sapeins database. Trypsin/P was specified as cleavage enzyme allowing up to 2 missing cleavages. Mass error was set to 10 ppm for precursor ions and 0.02 Da for fragment ions. Carbamidomethyl on Cys were specified as fixed modification and oxidation on Met, acetylation on Protein N-term were specified as variable modifications. Peptide ion score was set > 20. Datasets collected from probe collected samples were compared to DMSO treated samples to remove non-specific interactions. Proteins that were not enriched in DMSO treated samples were then compared to probe plus SAHA treated samples and any protein in probe treated samples that was decreased by at least 50% is shown in Table S1. This analysis was done using a custom Matlab script.
Serum starvation followed by photolabeling
0.8×10⁶ or 0.5×10⁶ MCF-7 cells were plated in 6-well plates (corning) and grown in complete medium for 2 days. After 2 days the medium was replaced with either serum free medium (into the wells plated with 0.3×10⁶ cells or complete medium (into the wells plated with 0.15×10⁶ cells). The cells were incubated for an additional 48 hours followed by the “general procedure for photolabeling in live cells”.
Treatment with inhibitors, cytokines and growth factors followed by photolabeling
0.3×10⁶ MDA-MB-231 cells were plated in 6-well plates and grown in complete medium for 2 days. inhibitors of CK2 (TBB, 50 µM), JNK (SP600125, 10 µM or TCS 6o 20 µM), p38 (SB202190, 10 µM) and IKK/NF-kB (IKK-16, 10 µM), Pi3K (LY294002, 20µM), GSK3b (AR-A014418, 20 µM) or cytokines/growth factors EGF, TNF-α, IGF-1 (all at 10 ng/mL) were added to the growth medium at the indicated concentrations and incubated for 2–12 hours. After incubation, the “general procedure for photolabeling in live cells” was carried out or cells were lysed without further treatment for analysis by Western blot.
Transfection of mutant HDAC3 followed by photolabeling
2.1×10⁶ MDA-MB-231 cells were plated in 10 cm plates (corning) and grown in complete medium for 2 days. After 2 days the medium was removed, the cells washed twice with PBS and medium containing 5% FBS without penicillin/streptomycin was added. 10 µg of S405A, S424A, or Flag-HDAC3 plasmids were diluted with 500 µL IMEM, and 500 µL of IMEM containing Lipofectamine 2000 was added and the samples incubated at room temperature for 30 minutes. Plasmid-lipofectamine complexes were added to the 10 cm plates and cells were transfected for 24 hours. The following day, the medium was removed and the cells washed twice with PBS. Complete medium was added and the cells were incubated for 2 hours with complete medium followed by the “general procedure for photolabeling in live cells”.
Western blotting
Protein samples were diluted with sample loading buffer containing DTT (Invitrogen), heated to 70 °C for 10 minutes and separated by gel electrophoresis at 100 volts. Gels were transferred to nitrocellulose membranes with iBlot transfer system (P3 for 7 minutes) and visualized with Odyssey Sa imager. Membranes were then blocked with Odyssey blocking buffer for 2 hours at 4 °C, incubated with desired antibodies overnight at 4 °C, washed 3×5 minutes with PBST, incubated with relevant species of IRDye conjugated secondary antibody for 1 hour and visualized with Odyssey Sa imager. If additional antibody probing was necessary, membranes were stripped with 0.2 N NaOH for 30 minutes and the Western blotting procedure was repeated starting from blocking with Odyssey buffer.
Quantitation of class I HDAC isoforms in breast cancer cell lines
A standard curve of individual recombinant proteins ranging from 1–20 ng as well as 30 µg cell lysate from MCF-7 cells were visualized by Western blotting procedure. Signal was quantified by densitometry, plotted and a linear regression fit using Graphpad Prism 6 software. Relative HDAC3 and phosphorylated HDAC3 abundance in the panel of breast cancer cell lines was quantified in a similar manner without use of a standard curve.
Photolabeling of recombinant proteins
Recombinant class I and II HDACs (500 ng) or standard dilutions ranging from .01 to 1.5 ng, in photolabeling lysis buffer were pretreated with competitor (SAHA 200 µM) or DMSO control for 15 minutes when applicable and then treated with photomate (10 µM) or DMSO control. After a 40-minute incubation, samples were cooled to 0 °C and irradiated with 366 nm light (35 J/cm2). Samples were then incubated with azide conjugated 800CW IRDye at a concentration 1.5× the probe, TCEP (0.25 mM), TBTA (0.1 mM), and CuSO4 (0.50 mM) for 90 minutes at rt. Samples were then diluted with loading buffer, heated to 70 °C for 10 minutes and separated by gel electrophoresis at 100 volts. Gels were transferred to nitrocellulose membranes with iBlot transfer system (P3 for 7 minutes) and visualized with Odyssey Sa imager. Membranes were then blocked with Odyssey blocking buffer for 2 hours at 4 °C, incubated with antibodies for class I HDACs overnight at 4 °C, washed 3×5 minutes with PBST, incubated with anti-rabbit 680RD IRDye conjugated secondary antibody for 1 hour and visualized with Odyssey Sa imager.
Phosphorylation of recombinant HDAC3
1 µg recombinant HDAC3 was diluted with 20 µL CK2 reaction buffer (New England Biolabs). 100 mM ATP was added, or vehicle for control reactions, followed by 200 U CK2 or 100 U JNK1. The reactions were incubated for 2 hours at 30 °C. Samples were then dialyzed into photolabeling lysis buffer for use in “photolabeling of recombinant proteins”
Enzymatic activity of HDAC3
Serial dilutions of deacetylated Fluor de Lys substrate (0–40 µM, Enzo Life Sciences) were prepared in KI-143 (25 mM Tris–HCl, pH 8.0, 137 mM NaCl, 2.7 mM KCl, and 1 mM MgCl2). The amount of acetylated fluor de lys substrate that phosphorylated HDAC3 and HDAC3 could deacetylate in 30 minutes was compared to this curve. Recombinant proteins were diluted with KI-311 (25 mM Tris–HCl, pH 8.0, 137 mM NaCl, 2.7 mM KCl, and 1 mM MgCl2, 1 mg/mL BSA) buffer to give 1 ng/µL stocks of each. 15 µL of enzyme stock and 25 µL of 5 mM substrate was added to a black half area 96 well plate (corning) alongside 50 µL of standard dilutions and incubated for 30 minutes rt. 50 µL of 1 mg/mL trypsin and 5 µM TSA in KI-143 buffer was added. The volume was made equal with KI-143 and the plate was read at excitation wavelength 360 nm and emission wav elength 460nm using a Synergy 4 hybrid microplate reader from BioTek. Activity was determined using GraphPad Prism 6. Activity of 0.84 ± .006 and 0.17 ± .005 µM substrate/hour were found for phosphorylated HDAC3 and non-phsophorylated HDAC3 respectively. The data is reported as the average ± s. e. (n=3).
Immunoprecipitations
Six 10 cm plates were seeded with 0.8×10⁶ MDA-MB-231 or MCF-7 cells and grown to 90% confluence. Cells were washed with PBS (2× 5 mL) followed by addition of 1 mL PBS. Cells were scraped from plate into Eppendorf tubes, spun down at 1000 rpm for 5 minutes at 4 °C, the supernatant removed, and the cells resuspended in hypotonic buffer (10 mM Hepes (pH 7.5), 10 mM KCl, 0.05% (for MDA-MB-231 cells) or 0.4% (for MCF-7 cells) Igepal CA-630, 1× Protease inhibitor cocktail and 1× phosphatase inhibitor cocktail) until cell walls were compromised (verified by microscopic inspection). The mixture was spun down at 1,000 g for 5 minutes to provide the cytosol (supernatant) and nuclei (pellet). The nuclei were than homogenized in 200 µL pull-down lysis buffer (20 mM Hepes (pH 7.5), 150 mM NaCl, 1.5 mM MgCl2, 0.5% Igepal CA-630, 1× protease inhibitor cocktail and 1× phosphatase inhibitor cocktail) and incubated for 1 hour at 4 °C on a rotating stand. Lysed nuclei were than centrifuged at 20,000 g for 10 minutes at 4 °C to provide nuclear fraction (supernatant). Protein concentration was determined using Bradford assay and then diluted to 2 mg/mL with pull-down lysis buffer. 0.8 mg of lysate was incubated with 35 µL protein A Dynabeads for 3 hours at rt and then stored for use at −20 °C. For antibody bead conjugation, 60 µL dynabeads (per reaction) were washed with PBS and separated into 2× 30 µL aliquots. 15 µg anti-HDAC3 (Abcam) antibodies or 15 µg rabbit IgG control, each diluted with 150 uL PBS, were added to either 30 µL washed dynabead aliquot and incubated at rt for 2 hours. Bead antibody conjugates were then washed with 2× 1 mL PBS, 1 mL 0.2 N triethnolamine (pH 8.2) and incubated with 1 mL 25 mM dimethyl pimelidate in 0.2 N triethnolamine (pH 8.2) for 45 minutes at rt. After crosslinking bead-antibody conjugates were washed with 2× 1 mL 0.2 N triethanolamine (pH 8.2), resuspended in 0.1 N triethnolamine and incubated for 30 minutes at rt. Bead conjugates were then washed with 3× 1 mL PBS, 1 mL 0.2 N glycine (pH 2.6). Bead conjugates were then resuspended in 30 µL PBS, added into 0.8 mg of a pre-cleared, 2 mg/mL nuclear extract described above, and incubated overnight at 4 °C. The following day, beads were washed with 3× 1 mL pull-down lysis buffer and eluted with 3 × 50 mL 0.2 N glycine (pH 2.6). Eluates were pooled and 37.5 µL TCA (100 w/v) solution was added followed by 15 uL 1 M Tris (pH 8.5). Samples were incubated for 1.5 hours at 4 °C and spun down at 20,000 g for 10 minutes at 4 °C. The supernatant was removed and pellet was resuspended in 20 µL Laemmli buffer. Samples were boiled for 5 minutes and electrophoretically separated. Proteins were transferred to nitrocellulose membranes with iBlot transfer system (P3 for 7 minutes), blocked with odyssey blocking buffer for 2 hours at 4 °C, incubated with antibodies overnight at 4 °C, washed 3× 5 minutes with PBST, incubated with anti-rabbit IRDye conjugated secondary antibody for 1 hour and visualized with Odyssey Sa imager.
Compound Synthesis
All chemicals were purchased from commercial sources (Aldrich, Matrix Scientific). All solvents were dried prior to use. Reactions were monitored by thin-layer chromatography (TLC) or by liquid chromatography (Waters, XSelect HSS CYANO 3.6 µm mass spectrometry (LC/MS) (Shimadzu LCMS-2020). NMR spectra were obtained in deuterated chloroform or deuterated dimethylsulfoxide on a Bruker DPX-400 MHz spectrometer. NMR chemical shifts are reported in δ ppm downfield relative to TMS and J values are reported in Hz. High resolution mass spectrometry experiments (HRMS) were performed at the Mass spectrometry, Metabolomics and Proteomics Facility at University of Illinois at Chicago on a Thermo Finnigan LTQ FT ICR Hybrid Mass Spectrometer. Abbreviations DCM, dichloromethane, EtOAc, ethyl acetate, EDC, 1-ethyl-3-(3-dimethylaminopropyl)carbodiiimide, HOBt, hydroxybenzotriazole, DMAP, 4-dimethylaminopyridine, DMF, dimethylformamide.
Methyl 6-(((perfluorophenyl)methyl)amino)hexanoate (1)
Pentafluorbenzaldehyde (10 mmol, 1.96 g) and amino methyl ester hydrochloride (10.6 mmol, 1.93 g) and Triethylamine (20 mmol, 2.02 g) was stirred in Methanol (40 mL) with molecular sieves under Nitrogen for 3 hours until imine formation was complete as monitored by TLC. After the imine had formed, the reaction was cooled to 0 °C and NaBH4 (16 mmol) was added portionwise over 20 minutes. The reaction was stirred for 24 hours, made basic by addition of 10% NaOH, and extracted with DCM (3×30mL). The DCM extract was dried over Na2SO4, and concentrated in vacuo. The crude product was purified by Silica chromatography eluting with gradient from 0–40% EtOAc in Hexanes to give compound 1 (2.6 g, 80%, colorless liquid).
1H NMR (400 MHz, CDCl3) δ 3.91 (s, 2H), 3.66 (s, 3H), 2.56 (t, J = 7.0 Hz, 2H), 2.30 (t, J = 7.4 Hz, 2H), 1.70 – 1.56 (m, 2H), 1.48 (m, 2H), 1.40 – 1.29 (m, 2H).
13C NMR (101 MHz, CDCl3) δ 174.05, 51.47, 48.57, 40.50, 33.92, 29.54, 26.71, 24.74.
19F NMR (376 MHz, CDCl3) δ −144.78 (dd, J = 22.8, 8.7 Hz, 2F), −156.24 (t, J = 20.7 Hz, 1F), −162.62 (td, J = 22.6, 8.8 Hz, 2F).
HRMS (ESI-TOF+) m/z calc’d for C14H16F5NO2 [M+H]+ : 326.1179, found: 326.1193
Methyl 6-(((perfluorophenyl)methyl)(prop-2-yn-1-yl)amino)hexanoate (2)
The secondary amine 1 (2.7 mmol, 0.88 g) was dissolved in acetonitrile (30 mL), K2CO3 (3.6 mmol, 0.5 g) and propargyl bromide (3mmol) was added, and the mixture was stirred for 12 hrs. The reaction volume was reduced in vacuo, diluted with water, and extracted with DCM (3×30 mL). The organic phase was concentrated and the crude product was purified with silica gel chromatography eluting with gradient 5–35% EtOAc in hexanes to give compound 2 (0.88 g, 90%, glassy solid).
1H NMR (400 MHz, CDCl3) δ 3.74 (s, 2H), 3.66 (s, 3H), 3.36 (s, 2H), 2.55 (t, J = 7.1 Hz, 2H), 2.29 (t, J = 7.5 Hz, 2H), 2.21 (t, J = 2.2 Hz, 1H), 1.66 – 1.54 (m, 2H), 1.49 (m, J = 14.5, 7.4 Hz, 2H), 1.32 (m, J = 15.0, 7.4 Hz, 2H).
13C NMR (101 MHz, CDCl3) δ 174.07, 73.22, 52.65, 51.45, 44.88, 41.90, 33.98, 26.96, 26.63, 24.70.
19F NMR (376 MHz, CDCl3) δ −142.06 (dd, J = 22.3, 8.1 Hz, 2F), −155.29 (t, J = 20.7 Hz, 2F), −162.41 (dt, J = 22.6, 8.0 Hz, 2F).
HRMS (ESI-TOF+) m/z calc’d for C17H18F5NO2 [M+H]+ : 364.1336, found: 364.1353
6-(((Perfluorophenyl)methyl)(prop-2-yn-1-yl)amino)hexanoic acid (3)
The tertiary amine 2 (2.4 mmol, 0.87 g) was dissolved in methanol:water (1:1, 30 mL) and NaOH (6 mmol, 0.24 g) was added. The reaction was stirred at room temperature under nitrogen for 3 hrs. Upon completion, as monitored by TLC, the reaction was brought to pH 4–5 with 10 % HCl and extracted with DCM (3×30 mL). The crude product was used in the next reaction without further purification (0.76 g, 90%, white solid).
1H NMR (400 MHz, CDCl3) δ 3.76 (s, 2H), 3.37 (s, 2H), 2.57 (t, J = 6.9 Hz, 2H), 2.33 (t, J = 7.3 Hz, 2H), 2.21 (s, 1H), 1.62 (m, 2H), 1.55 – 1.44 (m, 2H), 1.36 (m, 2H).
13C NMR (101 MHz, CDCl3) δ 179.56, 73.53, 52.75, 44.97, 42.02, 34.06, 26.99, 26.71, 24.58.
19F NMR (376 MHz, CDCl3) δ −141.91 (dd, J = 15.7, 6.8 Hz, 2F), −155.12 (t, J = 20.3 Hz, 1F), −162.34 (td, J = 21.3, 7.6 Hz, 2F).
HRMS (ESI-TOF+) m/z calc’d for C16H16F5NO2 [M+H]+ : 350.1179, found: 350.1196
6-(((Perfluorophenyl)methyl)(prop-2-yn-1-yl)amino)-N-(trityloxy)hexanamide (4)
To a mixture of intermediate 3 (2 mmol, 0.70 g), EDC (3 mmol, 0.47 g), HOBt (2.2 mmol, 0.34 g) and DMAP (2.2 mmol, 0.27 g) in CHCl3 (30 mL) was added Et3N (3 mmol) followed by immediate addition of o-tritylhydroxylamine (2.5 mmol, 0.68 g). The mixture was stirred at room temperature under nitrogen for 18 hrs. Upon completion, as monitored by TLC, the crude product was concentrated in vacuo, diluted with water, made acidic with 10 % HCl, washed with CHCl3, neutralized with 10% NaOH (pH 7) and extracted with DCM (3×30 mL). The organic layers were collected and dried over Na2SO4. The crude product was then purified by silica chromatography eluting with a gradient of 5–35% EtOAc in hexanes to give compound 4 (75%, 0.91 g, white solid).
1H NMR (400 MHz, DMSO) δ 10.13 (s, 1H), 7.32 (m, 15H), 3.69 (s, 2H), 3.28 (s, 3H), 3.14 (s, 1H), 2.37 (t, J=6.9 Hz, 2H), 1.76 (t, J = 7.2 Hz 2H), 1.26 (m, 2H), 1.16 (m, 2H), 0.94 (m, 3H).
13C NMR (101 MHz, DMSO) δ 170.65, 142.87, 129.35, 127.88, 127.77, 92.09, 78.60, 76.29, 52.56, 44.81, 41.57, 32.36, 26.75, 26.34, 24.98.
19F NMR (376 MHz, DMSO) δ −142.41 (dd, J = 24.3, 6.5 Hz, 2F), −156.15 (t, J = 22.1 Hz, 1F), −163.01 – −163.26 (m, 2F).
HRMS (ESI-TOF+) m/z calc’d for C35H31F5N2O2 [M+H]+ 607.2384, found: 607.2439.
6-((4-Azido-2,3,5,6-tetrafluorobenzyl)(prop-2-yn-1-yl)amino)-N-(trityloxy)hexanamide (5)
NaN3 (1.5 mmmol, 0.91 g), Bu4NN3 (0.077 mmol, 0.02 g) and intermediate 4 (0.75 mmol, 0.45 g) were heated in DMF at 75 °C for 18 hrs. The crude product was concentrated in vacuo, and then diluted with water. The water layer was extracted with DCM (3×30 mL) and the organic phases combined and concentrated to afford a brown solid. The solid was then passed through a short silica column eluting with 37.5% EtOAc in Hexanes to give compound 5 (0.19 g, 40%, colorless solid).
1H NMR (400 MHz, DMSO) δ 10.14 (s, 1H), 7.32 (s, 15H), 3.67 (s, 2H), 3.28 (s, 2H), 3.15 (s, 1H), 2.37 (t, J = 6.9 Hz, 2H), 1.76 (t, J = 7.2 Hz, 2H), 1.25 (m, 2H), 1.16 (m, 2H), 0.94 (m, 2H).
13C NMR (101 MHz, DMSO) δ 170.71, 142.93, 129.41, 127.94, 127.83, 112.72, 92.15, 78.69, 76.34, 52.52, 45.01, 41.71, 32.42, 26.81, 26.40, 25.03.
19F NMR (376 MHz, C6D6) δ −143.32 (dd, J = 22.1, 9.5 Hz, 2F), −152.84 (dd, J = 22.4, 9.8 Hz, 2F).
HRMS (ESI-TOF+) m/z calc’d for C35H31F4N5O2 [M+H]+ : 630.2488, found: 630.2545
6-((4-Azido-2,3,5,6-tetrafluorobenzyl)(prop-2-yn-1-yl)amino)-N-hydroxyhexanamide (6)
To a solution of Intermediate 5 (0.3 mmol, 0.19 g) in DCM was added MgBr2 (3 mmol, 0.55 g). The reaction was stirred at room temperature under nitrogen for 15 minutes and then diluted with water and extracted with DCM (3× 30 mL). The pooled extracts were concentrated, dried over Na2SO4 and purified by silica chromatography eluting with a gradient of 0–10% MeOH in DCM to give compound 6 (80%, 0.09 g, colorless solid).
1H NMR (400 MHz, DMSO) δ 10.30 (s, 1H), 8.63 (s, 1H), 3.69 (s, 2H), 3.35 – 3.27 (m, 2H), 3.13 (t, J = 2.1 Hz, 1H), 2.44 (t, J = 7.0 Hz, 2H), 1.91 (t, J = 7.3 Hz, 2H), 1.46 (m, 2H), 1.42 – 1.34 (m, 2H), 1.21 (m, 2H).
13C NMR (101 MHz, DMSO) δ 169.06, 112.27, 78.32, 75.95, 52.16, 44.61, 41.32, 32.27, 26.41, 26.24, 24.98.
19F NMR (376 MHz, DMSO) δ −143.32 (dd, J = 22.4, 9.8 Hz), −152.82 (dd, J = 22.7, 10.0 Hz).
HRMS (ESI-TOF+) m/z calc’d for C16H17F4N5O2 [M+H]+ : 388.1388, found: 388.1418
Quantification and Statistical Analysis
Statistical analyses were performed with GraphPad Prism 6 software. All data are shown as mean ± s.e. Student's t-test (two-tailed) was used to measure statistically significant differences between groups. P value < 0.0005 was considered statistically significant for this study. One way Anova was used to determine statistically significant variance. P<.0001 was considered statistically significant.
Data and Software Availability
Datasets for photomate selectivity, and Matlab script for MS/MS protein ID are available upon request.
Supplementary Material
Table S1. Proteins specifically enriched by photomate and identified by MS/MS, Related to Figure 3.
KEY RESOURCES TABLE
| REAGENT or RESOURCE | SOURCE | IDENTIFIER |
|---|---|---|
| Antibodies | ||
| Rabbit polyclonal anti-HDAC1 | Abcam | Ab7028 Lot GR225006-10 RRID:AB_305705 |
| Rabbit polyclonal anti-HDAC2 | Abcam | Ab124974 Lot GR97402-7 |
| Rabbit polyclonal anti-HDAC8 | Abcam | Ab187139 Lot GR163583-5 |
| Rabbit polyclonal anti-HDAC3 | Abcam | Ab7030 Lot GR210866 |
| Mouse Monoclonal anti-HDAC4 | Santa Cruz | Sc-46672 Lot C2817 |
| Mouse Monoclonal anti-HDAC5 | Santa Cruz | Sc-133-225 Lot J2516 |
| Rabbit Monoclonal anti-HDAC6 | Abcam | Ab117516 Lot GR164583-5 |
| Mouse Monoclonal anti-HDAC7 | Santa Cruz | Sc-74563 Lot K1416 |
| Mouse Monoclonal anti-HDAC9 | Santa Cruz | Sc-398003 Lot J2516 |
| Mouse Monoclonal anti-HDAC10 | Santa Cruz | sc-393417 Lot A2617 |
| Mouse Monoclonal anti-HDAC11 | Santa Cruz | Sc-390737 Lot B2417 |
| Mouse Monoclonal anti-HDAC3 | Santa Cruz | Sc376957 Lot K0916 |
| Mouse monoclonal anti-HDAC3 clone 3G6 | Millipore | 05-813 Lot 2726719 RRID:AB_310021 |
| Rabbit polyclonal anti-pHDAC3 (Ser424) | Cell Signaling | 3815 RRID:AB_2264084 |
| Rabbit Polyclonal anti-NCOR2 | Abcam | Ab24552 Lot GR224645-1 RRID:AB_2149005 |
| Rabbit Polyclonal anti-NCOR1 | Abcam | Ab24551 Lot GR76751-1 |
| Rabbit polyclonal anti-pAKT | Cell Signaling | 4060S Lot 16 |
| Mouse monolonal anti-AKT | Cell Signaling | 2967S Lot 17 RRID:AB_331160 |
| Rabbit polyclonal anti-TBL1 | Abcam | Ab24548 Lot GR252858 RRID:AB_2199904 |
| Mouse monoclonal anti-pc-Jun (KM-1) | Sant Cruz | Sc-822 Lot L2116 RRID:AB_627262 |
| Mouse monoclonal anti-c-Jun | Sant Cruz | Sc-74543 Lot C2417 RRID:AB_627262 |
| Rabbit polyclonal anti-c-Jun | Protein Tech | 10024-2-AP |
| Rabbit monoclonal p-P65 (Ser536) | Cell Signaling | 3033S Lot 14 RRID:AB_331284 |
| P65 | Cell Signaling | 6956P Lot 1 |
| Mouse monoclonal anti-pJNK | Cell Signaling | 9255 |
| Rabbit monoclonal anti-JNK | Cell Signaling | 9252 |
| Mouse monoclonal anti-pP38 | Cell Signaling | 92116 RRID:AB_331296 |
| Rabbit monoclonal anti-P38 | Cell Signaling | 8690 |
| Goat Anti-Mouse 680RD IRDye | LiCOR | 926-68070 |
| Goat Anti-Mouse 800CW IRDye | LiCOR | 925-32210 |
| Donkey Anti-Rabbit 800CW IRDye | LiCOR | 925-32213 |
| Anti-Rabbit IgG | Acam | Ab37415 Lot GR282404 RRID:AB_2631996 |
| Bacterial and Virus Strains | ||
| NEB 5-alpha Competent E. coli | New England Biolabs | C2987 |
| Chemicals, Peptides, and Recombinant Proteins | ||
| HDAC1 | BPS Bioscience | 50051 Lot 150528-A |
| HDAC2 | BPS Bioscience | 50002 Lot 130823-G |
| HDAC3 | BPS Bioscience | 50003 Lot 130819 |
| HDAC8 | Petukhov Laboratory, University of Illinois at Chicago | |
| CK2 | New England Biolabs | P6010S Lot 0161608 |
| Lambda Phosphatase | New England Biolabs | P0753S Lot 0131610 |
| JNK1 | ThermoFisher | PV3319 Lot 1722548B |
| Epidermal growth factor | R&D Systems | 236-EG-01M |
| TNF-alpha | R&D Systems | 210-TA |
| IL-1β | Sigma Aldrich | 19401 |
| IGF-1 | Sigma Aldrich | 18779 |
| TGF- β1 | Sigma Aldrich | T7039 |
| Photomate | This Paper | N/A |
| TCS JNK 6o | Tocris | 3222 |
| AR-A014418 | Kozikowski Lab | |
| SB202190 | Sigma Aldrich | S7067 |
| LY294002 | Selleckchem | S1105 |
| IKK VII | Sigma Aldrich | 401486 |
| TBB | Sigma Aldrich | T0826 |
| Photomate | This Paper | 336447079 |
| SAHA | Selleckchem | S1047 |
| SP600125 | Sigma Aldrich | S5567 |
| Azide-PEG3-Biotin Conjugate | Sigma Aldrich | 762024 |
| Tris(2-carboxyethyl)phosphine hydrochloride (TCEP) | Sigma Aldrich | 75259 |
| CuSO4 (II) | ThermoFisher | BP346 |
| Tris[(1-benzyl-1H-1,2,3-triazol-4-yl)methyl]amine (TBTA) | Sigma Aldrich | 678937 |
| Adenosine 5’-triphosphate disodium salt | Sigma Aldrich | FLAAS |
| IRDye 800CW Azide | LiCOR | 929-60000 |
| Protease inhibitor cocktail | Roche | 4693159001 |
| Phosphatase inhibitor mini tablets | ThermoFisher | 88667 |
| RPMI | ThermoFisher | 11875-093 |
| Improved MEM | Corning | 10-024 |
| MEM Non-Essential Amino Acids | ThermoFisher | 11140-050 |
| L-Glutamine | ThermoFisher | 25030-081 |
| Penicillin-streptomycin | ThermoFisher | 15140-122 |
| Glycerol | Invitrogen | 15514-011 |
| Tween-20 | ThermoFisher | BP337 |
| Igepal CA-630 | Sigma Aldrich | I3021 |
| HEPES | ThermoFisher | 15630-080 |
| Trypsin | ThermoFisher | 15090-046 |
| FBS | Sigma Aldrich | F0926 |
| Bovine Serum Albumin | Sigma Aldrich | A2153 |
| Glycerol | Invitrogen | 15514-011 |
| Fluor De Lys | Enzo Life Sciences | BML-KI104-005 |
| N-Boc-Acetyl-L-Lysine 7-amido-4-methylcoumarin | Chem-Impex International, Inc. | 11607 |
| ON-TARGET plus Human siNCOR SMARpool | Dharmacon | L-003518-00-0005 |
| ON-TARGET plus Non-Targeting siRNA | Dharmacon | D-001810-01 |
| Lipofectamine 2000 | Invitrogen | 11268-019 |
| Critical Commercial Assays | ||
| Pierce BCA Protein Assay kit | ThermoFisher | 23225 |
| Deposited Data | ||
| Photomate | Pubmed | 336447079 |
| Experimental Models: Cell Lines | ||
| MCF-7 | Dr. Debra Tonetti, University of Illinois at Chicago | |
| T47-D | Dr. Debra Tonetti, University of Illinois at Chicago | |
| ZR75-1 | ATCC | CRL-1500 |
| MDA-MB-231 | Dr. Claudia Osipo, Loyola University | |
| MDA-MB-468 | Dr. Elizaveta Benevolenskaya, University of Illinois at Chicago | |
| MDA-MB-453 | Dr. Angela Tyner, University of Illinois at Chicago | |
| BT-20 | Dr. James Radosevich, University of Illinois at Chicago | |
| Recombinant DNA | ||
| FLAG-HDAC3 | Dr. Edward Seto, George Washington University | |
| FLAG-HDAC3 S405A | Dr. Edward Seto, George Washington University | |
| FLAG-HDAC3 S405A/S424A | Dr. Edward Seto, George Washington University | |
| Software and Algorithms | ||
| GraphPad Prism | GraphPad Software Inc | http://www.graphpad.com/scientific-software/prism/ |
| MatLab | MathWorks | https://www.mathworks.com/ |
| Image Studio Lite | LiCor | https://www.licor.com/bio/products/software/image_studio_lite/ |
| Other | ||
| Odyssey Blocking Buffer | LiCOR | 927-40000 |
| Dynabeads M-280 Streptavidin | ThermoFisher | 11206D |
| Dynabeads Protein A | ThermoFisher | 10002D |
| Slide-A-lyzer Mini Dialysis Units | ThermoFisher | 69550 |
Highlights.
Comprehensive analysis of HDAC inhibitor selectivity reveals cell type dependence
HDAC3 activity is divergently regulated by phosphorylation in triple negative cells
c-Jun N-terminal kinase phosphorylates HDAC3
HDAC3 phosphorylation increases binding and alters selectivity of HDAC inhibitor
Acknowledgments
This study was funded by the National Cancer Institute/NIH grants R01 CA131970 and R21 CA183627 and the Alzheimer’s Drug Discovery Foundation grant ADDF #20101103. We thank A. Vaidya, L. Serrebryanny, I. Kastrati Tiffany Sharma and Jeanne Danes for experimental guidance. We thank Dr. Edward Seto for providing plasmids for the HDAC3 mutants and the UIC DNA service facility for help with sequencing. We thank G. Thatcher for thought provoking discussion.
Footnotes
Publisher's Disclaimer: This is a PDF file of an unedited manuscript that has been accepted for publication. As a service to our customers we are providing this early version of the manuscript. The manuscript will undergo copyediting, typesetting, and review of the resulting proof before it is published in its final citable form. Please note that during the production process errors may be discovered which could affect the content, and all legal disclaimers that apply to the journal pertain.
Author Contributions T.W.H. and P.A.P conceived of the project. T.W.H. designed and performed all experiments and data analysis apart from determination of IC50 and comparison of enzymatic activity, which was done by S.M.A.. The manuscript was written by T.W.H., P.A.P. and J.M.F.
Competing financial interests The authors declare no competing financial interests.
References
- Balasubramanian S, Ramos J, Luo W, Sirisawad M, Verner E, Buggy JJ. A novel histone deacetylase 8 (HDAC8)-specific inhibitor PCI-34051 induces apoptosis in T-cell lymphomas. Leukemia. 2008;22:1026–1034. doi: 10.1038/leu.2008.9. [DOI] [PubMed] [Google Scholar]
- Bardai FH, D'Mello SR. Selective toxicity by HDAC3 in neurons: regulation by Akt and GSK3beta. J Neurosci. 2011;31:1746–51. doi: 10.1523/JNEUROSCI.5704-10.2011. [DOI] [PMC free article] [PubMed] [Google Scholar]
- Bhaskara S, Knutson SK, Jiang G, Chandrasekharan MB, Wilson AJ, Zheng S, Yenamandra A, Locke K, Yuan JL, Bonine-Summers AR, Wells CE, Kaiser JF, Washington MK, Zhao Z, Wagner FF, Sun ZW, Xia F, Holson EB, Khabele D, Hiebert SW. Hdac3 is essential for the maintenance of chromatin structure and genome stability. Cancer Cell. 2010;18:436–47. doi: 10.1016/j.ccr.2010.10.022. [DOI] [PMC free article] [PubMed] [Google Scholar]
- Bruzzese F, Leone A, Rocco M, Carbone C, Piro G, Caraglia M, Di Gennaro E, Budillon A. HDAC inhibitor vorinostat enhances the antitumor effect of gefitinib in squamous cell carcinoma of head and neck by modulating ErbB receptor expression and reverting EMT. J Cell Physiol. 2011;226:2378–90. doi: 10.1002/jcp.22574. [DOI] [PubMed] [Google Scholar]
- Chakraborty AR, Robey RW, Luchenko VL, Zhan ZR, Piekarz RL, Gillet JP, Kossenkov AV, Wilkerson J, Showe LC, Gottesman MM, Collie NL, Bates SE. MAPK pathway activation leads to Bim loss and histone deacetylase inhibitor resistance: rationale to combine romidepsin with an MEK inhibitor. Blood. 2013;121:4115–4125. doi: 10.1182/blood-2012-08-449140. [DOI] [PMC free article] [PubMed] [Google Scholar]
- CONSORTIUM EP. An integrated encyclopedia of DNA elements in the human genome. Nature. 2012;489:57–74. doi: 10.1038/nature11247. [DOI] [PMC free article] [PubMed] [Google Scholar]
- Cossu-Rocca P, Orru S, Muroni MR, Sanges F, Sotgiu G, Ena S, Pira G, Murgia L, Manca A, Uras MG, Sarobba MG, Urru S, De Miglio MR. Analysis of PIK3CA Mutations and Activation Pathways in Triple Negative Breast Cancer. PLoS One. 2015;10:e0141763. doi: 10.1371/journal.pone.0141763. [DOI] [PMC free article] [PubMed] [Google Scholar]
- Ellis MJ, Ding L, Shen D, Luo J, Suman VJ, Wallis JW, Van Tine BA, Hoog J, Goiffon RJ, Goldstein TC, Ng S, Lin L, Crowder R, Snider J, Ballman K, Weber J, Chen K, Koboldt DC, Kandoth C, Schierding WS, Mcmichael JF, Miller CA, Lu C, Harris CC, Mclellan MD, Wendl MC, Deschryver K, Allred DC, Esserman L, Unzeitig G, Margenthaler J, Babiera GV, Marcom PK, Guenther JM, Leitch M, Hunt K, Olson J, Tao Y, Maher CA, Fulton LL, Fulton RS, Harrison M, Oberkfell B, Du F, Demeter R, Vickery TL, Elhammali A, Piwnica-Worms H, Mcdonald S, Watson M, Dooling DJ, Ota D, Chang LW, Bose R, Ley TJ, Piwnica-Worms D, Stuart JM, Wilson RK, Mardis ER. Whole-genome analysis informs breast cancer response to aromatase inhibition. Nature. 2012;486:353–60. doi: 10.1038/nature11143. [DOI] [PMC free article] [PubMed] [Google Scholar]
- Fournel M, Bonfils C, Hou Y, Yan PT, Trachy-Bourget MC, Kalita A, Liu J, Lu AH, Zhou NZ, Robert MF, Gillespie J, Wang JJ, Ste-Croix H, Rahil J, Lefebvre S, Moradei O, Delorme D, Macleod AR, Besterman JM, Li Z. MGCD0103, a novel isotype-selective histone deacetylase inhibitor, has broad spectrum antitumor activity in vitro and in vivo. Mol Cancer Ther. 2008;7:759–68. doi: 10.1158/1535-7163.MCT-07-2026. [DOI] [PubMed] [Google Scholar]
- Frasor J, Chang EC, Komm B, Lin CY, Vega VB, Liu ET, Miller LD, Smeds J, Bergh J, Katzenellenbogen BS. Gene expression preferentially regulated by tamoxifen in breast cancer cells and correlations with clinical outcome. Cancer Res. 2006;66:7334–40. doi: 10.1158/0008-5472.CAN-05-4269. [DOI] [PubMed] [Google Scholar]
- Gao Z, Chiao P, Zhang X, Zhang X, Lazar MA, Seto E, Young HA, Ye J. Coactivators and corepressors of NF-kappaB in IkappaB alpha gene promoter. J Biol Chem. 2005;280:21091–8. doi: 10.1074/jbc.M500754200. [DOI] [PMC free article] [PubMed] [Google Scholar]
- Garnett MJ, Edelman EJ, Heidorn SJ, Greenman CD, Dastur A, Lau KW, Greninger P, Thompson IR, Luo X, Soares J, Liu Q, Iorio F, Surdez D, Chen L, Milano RJ, Bignell GR, Tam AT, Davies H, Stevenson JA, Barthorpe S, Lutz SR, Kogera F, Lawrence K, Mclaren-Douglas A, Mitropoulos X, Mironenko T, Thi H, Richardson L, Zhou W, Jewitt F, Zhang T, O'Brien P, Boisvert JL, Price S, Hur W, Yang W, Deng X, Butler A, Choi HG, Chang JW, Baselga J, Stamenkovic I, Engelman JA, Sharma SV, Delattre O, Saez-Rodriguez J, Gray NS, Settleman J, Futreal PA, Haber DA, Stratton MR, Ramaswamy S, Mcdermott U, Benes CH. Systematic identification of genomic markers of drug sensitivity in cancer cells. Nature. 2012;483:570–5. doi: 10.1038/nature11005. [DOI] [PMC free article] [PubMed] [Google Scholar]
- Gharbi SI, Zvelebil MJ, Shuttleworth SJ, Hancox T, Saghir N, Timms JF, Waterfield MD. Exploring the specificity of the PI3K family inhibitor LY294002. Biochem J. 2007;404:15–21. doi: 10.1042/BJ20061489. [DOI] [PMC free article] [PubMed] [Google Scholar]
- Glozak MA, Seto E. Histone deacetylases and cancer. Oncogene. 2007;26:5420–32. doi: 10.1038/sj.onc.1210610. [DOI] [PubMed] [Google Scholar]
- Gray GK, Mcfarland BC, Rowse AL, Gibson SA, Benveniste EN. Therapeutic CK2 inhibition attenuates diverse prosurvival signaling cascades and decreases cell viability in human breast cancer cells. Oncotarget. 2014;5:6484–96. doi: 10.18632/oncotarget.2248. [DOI] [PMC free article] [PubMed] [Google Scholar]
- Guenther MG, Lane WS, Fischle W, Verdin E, Lazar MA, Shiekhattar R. A core SMRT corepressor complex containing HDAC3 and TBL1, a WD40-repeat protein linked to deafness. Genes Dev. 2000;14:1048–57. [PMC free article] [PubMed] [Google Scholar]
- Heideman MR, Wilting RH, Yanover E, Velds A, De Jong J, Kerkhoven RM, Jacobs H, Wessels LF, Dannenberg JH. Dosage-dependent tumor suppression by histone deacetylases 1 and 2 through regulation of c-Myc collaborating genes and p53 function. Blood. 2013;121:2038–50. doi: 10.1182/blood-2012-08-450916. [DOI] [PMC free article] [PubMed] [Google Scholar]
- Hsieh CL, Ma HP, Su CM, Chang YJ, Hung WY, Ho YS, Huang WJ, Lin RK. Alterations in histone deacetylase 8 lead to cell migration and poor prognosis in breast cancer. Life Sci. 2016;151:7–14. doi: 10.1016/j.lfs.2016.02.092. [DOI] [PubMed] [Google Scholar]
- Insinga A, Monestiroli S, Ronzoni S, Gelmetti V, Marchesi F, Viale A, Altucci L, Nervi C, Minucci S, Pelicci PG. Inhibitors of histone deacetylases induce tumor-selective apoptosis through activation of the death receptor pathway (vol 11, pg 71, 2005) Nature Medicine. 2005;11:233–233. doi: 10.1038/nm1160. [DOI] [PubMed] [Google Scholar]
- Jonas BA, Privalsky ML. SMRT and N-CoR corepressors are regulated by distinct kinase signaling pathways. J Biol Chem. 2004;279:54676–86. doi: 10.1074/jbc.M410128200. [DOI] [PMC free article] [PubMed] [Google Scholar]
- Khan N, Jeffers M, Kumar S, Hackett C, Boldog F, Khramtsov N, Qian X, Mills E, Berghs SC, Carey N, Finn PW, Collins LS, Tumber A, Ritchie JW, Jensen PB, Lichenstein HS, Sehested M. Determination of the class and isoform selectivity of small-molecule histone deacetylase inhibitors. Biochem J. 2008;409:581–9. doi: 10.1042/BJ20070779. [DOI] [PubMed] [Google Scholar]
- Lai CJ, Bao R, Tao X, Wang J, Atoyan R, Qu H, Wang DG, Yin L, Samson M, Forrester J, Zifcak B, Xu GX, Dellarocca S, Zhai HX, Cai X, Munger WE, Keegan M, Pepicelli CV, Qian C. CUDC-101, a multitargeted inhibitor of histone deacetylase, epidermal growth factor receptor, and human epidermal growth factor receptor 2, exerts potent anticancer activity. Cancer Res. 2010;70:3647–56. doi: 10.1158/0008-5472.CAN-09-3360. [DOI] [PubMed] [Google Scholar]
- Lapierre M, Linares A, Dalvai M, Duraffourd C, Bonnet S, Boulahtouf A, Rodriguez C, Jalaguier S, Assou S, Orsetti B, Balaguer P, Maudelonde T, Blache P, Bystricky K, Boulle N, Cavailles V. Histone deacetylase 9 regulates breast cancer cell proliferation and the response to histone deacetylase inhibitors. Oncotarget. 2016;7:19693–708. doi: 10.18632/oncotarget.7564. [DOI] [PMC free article] [PubMed] [Google Scholar]
- Li Y, Jia L, Ren D, Liu C, Gong Y, Wang N, Zhang X, Zhao Y. Axl mediates tumor invasion and chemosensitivity through PI3K/Akt signaling pathway and is transcriptionally regulated by slug in breast carcinoma. IUBMB Life. 2014;66:507–18. doi: 10.1002/iub.1285. [DOI] [PubMed] [Google Scholar]
- Liu XF, Bagchi MK. Recruitment of distinct chromatin-modifying complexes by tamoxifen-complexed estrogen receptor at natural target gene promoters in vivo. J Biol Chem. 2004;279:15050–8. doi: 10.1074/jbc.M311932200. [DOI] [PubMed] [Google Scholar]
- Luu TH, Morgan RJ, Leong L, Lim D, Mcnamara M, Portnow J, Frankel P, Smith DD, Doroshow JH, Wong C, Aparicio A, Gandara DR, Somlo G. A phase II trial of vorinostat (suberoylanilide hydroxamic acid) in metastatic breast cancer: a California Cancer Consortium study. Clin Cancer Res. 2008;14:7138–42. doi: 10.1158/1078-0432.CCR-08-0122. [DOI] [PMC free article] [PubMed] [Google Scholar]
- Mahlknecht U, Will J, Varin A, Herbein G. HDAC3, a class I histone deacetylase, interacts with the p38 pathway and suppresses MAPK11-Mediated ATF-2 activation and TNF gene expression. Blood. 2004;104:599a–599a. doi: 10.4049/jimmunol.173.6.3979. [DOI] [PubMed] [Google Scholar]
- Mottamal M, Zheng S, Huang TL, Wang G. Histone deacetylase inhibitors in clinical studies as templates for new anticancer agents. Molecules. 2015;20:3898–941. doi: 10.3390/molecules20033898. [DOI] [PMC free article] [PubMed] [Google Scholar]
- Muller BM, Jana L, Kasajima A, Lehmann A, Prinzler J, Budczies J, Winzer KJ, Dietel M, Weichert W, Denkert C. Differential expression of histone deacetylases HDAC1, 2 and 3 in human breast cancer--overexpression of HDAC2 and HDAC3 is associated with clinicopathological indicators of disease progression. BMC Cancer. 2013;13:215. doi: 10.1186/1471-2407-13-215. [DOI] [PMC free article] [PubMed] [Google Scholar]
- Munster PN, Marchion D, Thomas S, Egorin M, Minton S, Springett G, Lee JH, Simon G, Chiappori A, Sullivan D, Daud A. Phase I trial of vorinostat and doxorubicin in solid tumours: histone deacetylase 2 expression as a predictive marker. British Journal of Cancer. 2009;101:1044–1050. doi: 10.1038/sj.bjc.6605293. [DOI] [PMC free article] [PubMed] [Google Scholar]
- Ontoria JM, Altamura S, Di Marco A, Ferrigno F, Laufer R, Muraglia E, Palumbi MC, Rowley M, Scarpelli R, Schultz-Fademrecht C, Serafini S, Steinkuhler C, Jones P. Identification of novel, selective, and stable inhibitors of class II histone deacetylases. Validation studies of the inhibition of the enzymatic activity of HDAC4 by small molecules as a novel approach for cancer therapy. J Med Chem. 2009;52:6782–9. doi: 10.1021/jm900555u. [DOI] [PubMed] [Google Scholar]
- Pflum MK, Tong JK, Lane WS, Schreiber SL. Histone deacetylase 1 phosphorylation promotes enzymatic activity and complex formation. J Biol Chem. 2001;276:47733–41. doi: 10.1074/jbc.M105590200. [DOI] [PubMed] [Google Scholar]
- Pulukuri SM, Gorantla B, Rao JS. Inhibition of histone deacetylase activity promotes invasion of human cancer cells through activation of urokinase plasminogen activator. J Biol Chem. 2007;282:35594–603. doi: 10.1074/jbc.M705867200. [DOI] [PMC free article] [PubMed] [Google Scholar] [Retracted]
- Rees MG, Seashore-Ludlow B, Cheah JH, Adams DJ, Price EV, Gill S, Javaid S, Coletti ME, Jones VL, Bodycombe NE, Soule CK, Alexander B, Li A, Montgomery P, Kotz JD, Hon CS, Munoz B, Liefeld T, Dancik V, Haber DA, Clish CB, Bittker JA, Palmer M, Wagner BK, Clemons PA, Shamji AF, Schreiber SL. Correlating chemical sensitivity and basal gene expression reveals mechanism of action. Nat Chem Biol. 2016;12:109–16. doi: 10.1038/nchembio.1986. [DOI] [PMC free article] [PubMed] [Google Scholar]
- Richon VM, Sandhoff TW, Rifkind RA, Marks PA. Histone deacetylase inhibitor selectively induces p21WAF1 expression and gene-associated histone acetylation. Proc Natl Acad Sci U S A. 2000;97:10014–9. doi: 10.1073/pnas.180316197. [DOI] [PMC free article] [PubMed] [Google Scholar]
- Ropero S, Fraga MF, Ballestar E, Hamelin R, Yamamoto H, Boix-Chornet M, Caballero R, Alaminos M, Setien F, Paz MF, Herranz M, Palacios J, Arango D, Orntoft TF, Aaltonen LA, Schwartz S, Jr, Esteller M. A truncating mutation of HDAC2 in human cancers confers resistance to histone deacetylase inhibition. Nat Genet. 2006;38:566–9. doi: 10.1038/ng1773. [DOI] [PubMed] [Google Scholar]
- Ruefli AA, Ausserlechner MJ, Bernhard D, Sutton VR, Tainton KM, Kofler R, Smyth MJ, Johnstone RW. The histone deacetylase inhibitor and chemotherapeutic agent suberoylanilide hydroxamic acid (SAHA) induces a cell-death pathway characterized by cleavage of Bid and production of reactive oxygen species. Proceedings of the National Academy of Sciences of the United States of America. 2001;98:10833–10838. doi: 10.1073/pnas.191208598. [DOI] [PMC free article] [PubMed] [Google Scholar]
- Salisbury CM, Cravatt BF. Activity-based probes for proteomic profiling of histone deacetylase complexes. Proc Natl Acad Sci U S A. 2007;104:1171–6. doi: 10.1073/pnas.0608659104. [DOI] [PMC free article] [PubMed] [Google Scholar]
- Sandor V, Senderowicz A, Mertins S, Sackett D, Sausville E, Blagosklonny MV, Bates SE. P21-dependent g(1)arrest with downregulation of cyclin D1 and upregulation of cyclin E by the histone deacetylase inhibitor FR901228. Br J Cancer. 2000;83:817–25. doi: 10.1054/bjoc.2000.1327. [DOI] [PMC free article] [PubMed] [Google Scholar]
- Singh TR, Shankar S, Srivastava RK. HDAC inhibitors enhance the apoptosis-inducing potential of TRAIL in breast carcinoma. Oncogene. 2005;24:4609–4623. doi: 10.1038/sj.onc.1208585. [DOI] [PubMed] [Google Scholar]
- Tate CR, Rhodes LV, Segar HC, Driver JL, Pounder FN, Burow ME, Collins-Burow BM. Targeting triple-negative breast cancer cells with the histone deacetylase inhibitor panobinostat. Breast Cancer Res. 2012;14:R79. doi: 10.1186/bcr3192. [DOI] [PMC free article] [PubMed] [Google Scholar]
- Taylor BS, Decarolis PL, Angeles CV, Brenet F, Schultz N, Antonescu CR, Scandura JM, Sander C, Viale AJ, Socci ND, Singer S. Frequent alterations and epigenetic silencing of differentiation pathway genes in structurally rearranged liposarcomas. Cancer Discov. 2011;1:587–97. doi: 10.1158/2159-8290.CD-11-0181. [DOI] [PMC free article] [PubMed] [Google Scholar]
- Uehara N, Kanematsu S, Miki H, Yoshizawa K, Tsubura A. Requirement of p38 MAPK for a cell-death pathway triggered by vorinostat in MDA-MB-231 human breast cancer cells. Cancer Lett. 2012;315:112–21. doi: 10.1016/j.canlet.2011.07.032. [DOI] [PubMed] [Google Scholar]
- Weiss C, Schneider S, Wagner EF, Zhang X, Seto E, Bohmann D. JNK phosphorylation relieves HDAC3-dependent suppression of the transcriptional activity of c-Jun. EMBO J. 2003;22:3686–95. doi: 10.1093/emboj/cdg364. [DOI] [PMC free article] [PubMed] [Google Scholar]
- Xu C, Soragni E, Chou CJ, Herman D, Plasterer HL, Rusche JR, Gottesfeld JM. Chemical probes identify a role for histone deacetylase 3 in Friedreich’s ataxia gene silencing. Chem Biol. 2009;16:980–9. doi: 10.1016/j.chembiol.2009.07.010. [DOI] [PMC free article] [PubMed] [Google Scholar]
- Zhang J, Kalkum M, Chait BT, Roeder RG. The N-CoR-HDAC3 nuclear receptor corepressor complex inhibits the JNK pathway through the integral subunit GPS2. Mol Cell. 2002;9:611–23. doi: 10.1016/s1097-2765(02)00468-9. [DOI] [PubMed] [Google Scholar]
- Zhang X, Ozawa Y, Lee H, Wen YD, Tan TH, Wadzinski BE, Seto E. Histone deacetylase 3 (HDAC3) activity is regulated by interaction with protein serine/threonine phosphatase 4. Genes Dev. 2005a;19:827–39. doi: 10.1101/gad.1286005. [DOI] [PMC free article] [PubMed] [Google Scholar]
- Zhang Y, Ng HH, Erdjument-Bromage H, Tempst P, Bird A, Reinberg D. Analysis of the NuRD subunits reveals a histone deacetylase core complex and a connection with DNA methylation. Genes Dev. 1999;13:1924–35. doi: 10.1101/gad.13.15.1924. [DOI] [PMC free article] [PubMed] [Google Scholar]
- Zhang Z, Yamashita H, Toyama T, Sugiura H, Ando Y, Mita K, Hamaguchi M, Hara Y, Kobayashi S, Iwase H. Quantitation of HDAC1 mRNA expression in invasive carcinoma of the breast*. Breast Cancer Res Treat. 2005b;94:11–6. doi: 10.1007/s10549-005-6001-1. [DOI] [PubMed] [Google Scholar]
Associated Data
This section collects any data citations, data availability statements, or supplementary materials included in this article.
Supplementary Materials
Table S1. Proteins specifically enriched by photomate and identified by MS/MS, Related to Figure 3.