

Abstract
Background
Pediatric solid organ transplant recipients have 100–200 times higher risk of non-Hodgkin lymphoma (NHL) than the general pediatric population. Consequently, transplant-related NHLs may contribute considerably to the pediatric NHL burden in the US.
Methods
We conducted a cohort study using a linkage between the US transplant registry and 16 cancer registries. We calculated cancer incidence rates among people <20 years old in the transplant and general populations. Rates were applied to transplant registry and US census data to estimate pediatric NHL counts in transplant recipients and the general population.
Results
During 1990–2012, an estimated 22,270 NHLs were diagnosed in US children and adolescents, including 628 diagnoses in transplant recipients. Thus, 2.82% (95%CI=2.45–3.19%) of pediatric NHL diagnoses in the general population occurred in transplant recipients. Among transplant recipients, the most common subtypes were diffuse large B-cell lymphoma (DLBCL, 64.5% of cases) and Burkitt lymphoma (8.6%). For DLBCL and Burkitt lymphoma, transplant recipients contributed 7.62%, (95%CI=6.35–8.88%) and 0.87% (95%CI=0.51–1.23%) of diagnoses, respectively. The proportion of NHLs that occurred in transplant recipients was highest among children <5 years old (4.46%, 95%CI=3.24–5.69%) and in more recent calendar years (2010–2012: 3.73%, 95%CI=2.07–5.39%). DLBCL patterns were similar with transplant recipients contributing 19.78% of cases in children <5 years old (95%CI=12.89–26.66%) and 11.4% of cases in 2010–2012 (95%CI=5.54–17.28%).
Conclusions
Among children and adolescents, solid organ transplant recipients contribute a substantial fraction of NHL diagnoses, particularly for DLBCL. This fraction has increased over time. Prevention efforts targeted towards this group could reduce the overall pediatric NHL burden.
Keywords: non-Hodgkin lymphoma, pediatrics, organ transplantation, epidemiology, diffuse large B-cell lymphoma
Introduction
Non-Hodgkin lymphoma (NHL) is one of the most frequently diagnosed cancers in children and adolescents in the United States, making up 6–8% of cancer diagnoses among persons under 20 years old.1,2 However, NHL is still rare in the US pediatric population, with approximately 1000 cases diagnosed annually and an incidence of less than 1.5 cases per 100,000 person-years.2
Pediatric solid organ transplant recipients have 100–200 times higher NHL risk than the general pediatric population.3,4 Epstein-Barr virus (EBV) can transform and immortalize B lymphocytes, leading to the development of lymphoma.5 While a small minority of the NHLs diagnosed in the general population are attributable to EBV,6,7 most NHLs in transplant recipients are positive for EBV.8,9 The extremely high NHL risk in transplant recipients is largely attributable to use of immunosuppressant medications to prevent graft rejection, which results in poor immune control of EBV.5,10,11 In particular, lack of immune control can make transplant recipients with no prior EBV exposure particularly susceptible to NHL development following a primary EBV infection.3,5,12 Because transplantation strongly increases risk, NHL comprises the majority of cancer diagnoses in pediatric transplant recipients.3,4 NHL risk is especially high in the first year after transplantation.13,14 Higher risk is also associated with younger age at transplantation, and transplantation of the intestine, heart, or lung.3,12
Given the exceedingly high risk among pediatric transplant recipients relative to the general population, transplant-related NHLs may contribute considerably to the overall NHL burden in US children and adolescents. Importantly, the number of children and adolescents living with a functioning transplant is increasing over time in the US,15 which could have a growing impact on NHL burden. In the present study, we estimated the contribution of solid organ transplantation to NHLs among US children and adolescents, using information on NHL incidence in the transplant population, general population NHL incidence, and the number of US pediatric transplant recipients.
Methods
The Transplant Cancer Match (TCM) Study linked the US transplant registry (Scientific Registry for Transplant Recipients [SRTR]) with 16 cancer registries [California (1988–2012), Colorado (1988–2009), Connecticut (1973–2009), Florida (1981–2009), Georgia (1995–2010), Hawaii (1973–2007), Iowa (1973–2009), Illinois (1986–2007), Kentucky (1995–2011), Michigan (1985–2009), North Carolina (1990–2010), New Jersey (1979–2010), New York (1976–2010), Texas (1995–2010), Utah (1973–2008), and the Seattle-Puget Sound area of Washington (1974–2008)], covering geographic areas that include 45% of the US transplant population.16 We included all pediatric transplant recipients less than 20 years of age at the time of transplantation, which is consistent with the age range typically used to describe childhood and adolescent cancers in the general population.2 The TCM Study was approved by human subjects review committees at the National Cancer Institute and, as required, participating cancer registries.
For transplant recipients in the TCM Study transplanted in this age range, at-risk time for cancer started at the later of transplantation date, start of cancer registry coverage, or 1990. While 1987 is the first year of data in the SRTR, 1990 was the first year when at least 500 pediatric transplant recipients were alive in the Transplant Cancer Match Study, allowing precise estimation of NHL risk. At-risk time ended at the first of: 20th birthday, death, graft failure, loss-to-follow-up in the SRTR, or end of cancer registry coverage (latest year of cancer registry coverage=2012). Cancer diagnoses after age 20 were not included as the purpose of this study was to quantify the contributions of transplant recipients to the NHL burden among individuals who were <20 years old at diagnosis. Person-time for the general population <20 years of age was estimated based on yearly census estimates within the same geographic regions covered by the TCM cancer registries. Total person-time in transplant recipients was divided by the person-time in the general population to calculate the proportion of time contributed by transplant recipients, which measures the prevalence of the transplant condition in the population.
Based on NHL diagnoses linked from the TCM cancer registries, we calculated NHL incidence rates in the pediatric transplant population within strata of sex, attained age group, race/ethnicity (non-Hispanic white, non-Hispanic black, Hispanic, non-Hispanic Asian/Pacific Islander, or other), attained calendar year, transplanted organ (kidney, liver, heart and/or lung [heart/lung], intestine, or multiple and/or other [multiple/other]), and time since transplantation (first year or after first year). To estimate total NHL counts in the US pediatric transplant population, we then applied rates to the entire US pediatric transplant population in the SRTR. NHL rates among children and adolescents in the general population were calculated from data from the same TCM cancer registries using all NHL diagnoses that occurred in people <20 years old. Rates stratified by sex, attained age group, race, calendar year, and transplanted organ were applied to the total US census population to obtain total NHL counts in people <20 years old.
Transplant pediatric NHL counts were divided by total pediatric NHL counts to calculate the proportion occurring in the pediatric transplant population. Proportions were calculated overall and by age, calendar period, and sex. We also calculated the proportion of pediatric NHLs that occurred in subgroups of transplant recipients based on organ type and time since transplantation. For each proportion estimate, 95% confidence intervals (95%CIs) were calculated assuming that transplant NHL counts followed a Poisson distribution.17 We repeated analyses for the most common NHL subtypes in pediatric transplant recipients: diffuse large B-cell lymphoma (DLBCL) and Burkitt lymphoma (BL).
Results
Of 21,418 pediatric transplant recipients in the TCM Study, 54% were male, 34% <5 years of age at transplantation, and 52% non-Hispanic white (Table 1). The majority of transplants occurred during 2000–2012. The most commonly transplanted organ was the kidney (47%), followed by liver (30%), heart/lung (20%), and intestine (1%), while other organ transplants made up the remaining fraction (3%). Half of recipients had unknown EBV serostatus at transplantation (Table 1), but among those with known serostatus, 44% were EBV seronegative. The median follow-up after transplantation was 3.3 years.
Table 1.
Characteristics of pediatric transplant recipients in the Transplant Cancer Match Study
| N | % | |
|---|---|---|
| Total transplants | 21,418 | 100 |
| Sex | ||
| Male | 11661 | 54.4 |
| Female | 9757 | 45.6 |
| Age at transplantation, years | ||
| 0–4 | 7196 | 33.6 |
| 5–9 | 3035 | 14.2 |
| 10–14 | 4340 | 20.3 |
| 15–19 | 6847 | 32.0 |
| Race | ||
| White, non-Hispanic | 11143 | 52.0 |
| Black, non-Hispanic | 3769 | 17.6 |
| Hispanic | 5258 | 24.6 |
| Asian/Pacific Islander | 1020 | 4.8 |
| Other | 228 | 1.1 |
| Year of transplant | ||
| 1987–1994 | 4101 | 19.2 |
| 1995–1999 | 4926 | 23.0 |
| 2000–2004 | 5467 | 25.5 |
| 2005–2009 | 5662 | 26.4 |
| 2010–2012 | 1262 | 5.9 |
| Transplanted organ | ||
| Kidney | 10007 | 46.7 |
| Liver | 6326 | 29.5 |
| Heart/lung | 4269 | 19.9 |
| Intestine | 177 | 0.8 |
| Multiple/other | 639 | 3.0 |
| Epstein-Barr virus serostatus at transplantation | ||
| Positive | 5951 | 27.8 |
| Negative | 4723 | 22.1 |
| Missing | 10744 | 50.2 |
The prevalence of transplant recipients among children and adolescents in the general population was very small (0.0110% overall) but increased more than four-fold over time, with recipients making up 0.0035% of this population in 1990 vs. 0.0159% in 2012 (Figure 1A). The prevalence has grown over time for each organ type, but increases were largest for liver recipients (0.0011% of population in 1990 vs. 0.0058% in 2012) and kidney recipients (0.0020% vs. 0.0058%). Prevalence was highest in older age groups (0.0158% in 18–19 year olds, Figure 1B), but the prevalence of recipients in the first year post-transplantation was greatest among children <2 years old (0.0035%).
Figure 1. Prevalence of solid organ transplant recipients among the United States general population <20 years of age.
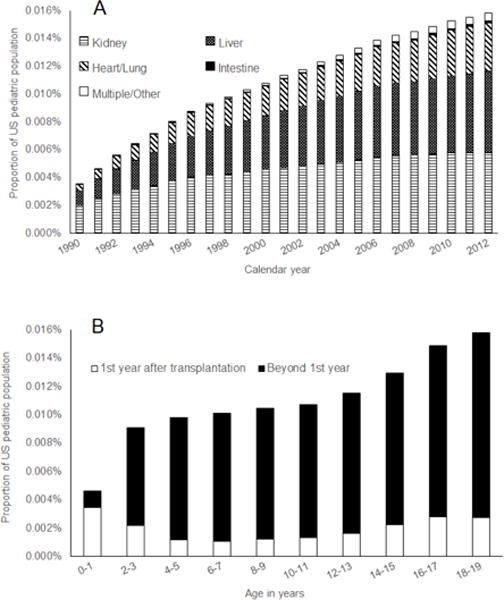
Columns in Panel A show the percentage of children and adolescents in the US general population who have had a solid organ transplant by calendar year. Within each column, the proportions of this percentage attributable to recipients of different organ types are shown by different patterned sections. Columns in Panel B show the percentage of children and adolescents in the US general population who have had a solid organ transplant by age. Within each column, the white section shows the proportion of the general population in each age group comprised of recipients who were within 1 year after transplantation, while the black section shows the proportion for recipients who were more than 1 year post-transplantation.
During 1990–2012, there were 10,451 pediatric NHL diagnoses in cancer registry areas, of which 279 occurred among transplant recipients (Table 2). In the general population, the most common subtypes were DLBCL (25% of cases), BL (24%), and precursor cell lymphoblastic lymphoma (20%). Among NHLs diagnosed in transplant recipients, 65% were DLBCL and 9% were BL, while there were no cases of precursor cell lymphoblastic lymphoma. Compared to cases in the general population, a larger proportion of transplant NHLs were among children <5 years old and diagnosed in later calendar years (Table 2).
Table 2.
Characteristics of non-Hodgkin lymphoma diagnoses included from 16 cancer registries in the Transplant Cancer Match Study
| Transplant population | General population | |
|---|---|---|
|
| ||
| N(%) | N(%) | |
| Total | 279 | 10,451 |
| Subtype | ||
| Diffuse large B-cell lymphoma | 180 (64.5) | 2,563 (24.5) |
| Burkitt lymphoma | 24 (8.6) | 2,458 (23.5) |
| Peripheral T-cell lymphoma | 12 (4.3) | 347 (3.3) |
| Anaplastic large cell lymphoma | 7 (2.5) | 742 (7.1) |
| Follicular lymphoma | 1 (0.4) | 338 (3.2) |
| Mycosis fungoides/Sezary syndrome | 1 (0.4) | 224 (2.1) |
| Marginal zone B-cell lymphoma | 1 (0.4) | 169 (1.6) |
| Primary cutaneous anaplastic large cell lymphoma | 1 (0.4) | 55 (0.5) |
| Lymphoplasmacytic lymphoma | 1 (0.4) | 17 (0.2) |
| Precursor cell lymphoblastic lymphoma | 0 (0) | 2,049 (19.6) |
| Chronic lymphocytic leukemia | 0 (0) | 137 (1.3) |
| NK/T-cell lymphoma | 0 (0) | 38 (0.4) |
| Hepatosplenic T-cell lymphoma | 0 (0) | 25 (0.2) |
| Mantle cell lymphoma | 0 (0) | 7 (0.1) |
| Other specified subtype | 0 (0) | 4 (0.04) |
| Unspecified | 51 (18.3) | 1,278 (12.2) |
| Age at diagnosis, years | ||
| 0–4 | 66 (23.7) | 1,524 (14.6) |
| 5–9 | 55 (19.7) | 2,712 (26.0) |
| 10–14 | 92 (33.0) | 3,874 (37.1) |
| 15–19 | 66 (23.7) | 2,341 (22.4) |
| Year of diagnosis | ||
| 1990–1994 | 21 (7.5) | 1,747 (16.7) |
| 1995–1999 | 55 (19.7) | 2,457 (23.5) |
| 1999–2004 | 87 (31.2) | 2,814 (26.9) |
| 2005–2009 | 94 (33.7) | 2,790 (26.7) |
| 2010–2012 | 22 (7.9) | 643 (6.2) |
In the general population <20 years old, NHL incidence was 1.19 cases per 100,000 person-years (95%CI=1.12–1.27; Table 3). Among transplant recipients in this age range, incidence was 257 times higher at 306 cases per 100,000 person-years (95%CI=271–344). Based on these rates, we estimate that 22,270 NHLs were diagnosed in US children and adolescents during 1990–2012. Of these, an estimated 628 NHL diagnoses occurred among transplant recipients, or 2.82% (95%CI=2.45–3.19%) of all pediatric NHL diagnoses.
Table 3.
Pediatric non-Hodgkin lymphoma cases contributed by transplant recipients in the United States
| Proportion of person-time from transplant recipients | Incidence rate per 100,000 person-years (95%CI) | Estimated NHL cases in the US* | Proportion of NHL cases in transplant recipients (95%CI) | |||
|---|---|---|---|---|---|---|
|
| ||||||
| Transplant recipients | General population | Transplant recipients | General population | |||
| Overall | 0.0110% | 306 (271–344) | 1.19 (1.12–1.27) | 628 | 22270 | 2.82% (2.45–3.19%) |
| By population characteristics | ||||||
| Sex | ||||||
| Female | 0.0102% | 320 (268–379) | 0.81 (0.78–0.83) | 297 | 7306 | 4.07% (3.30–4.83%) |
| Male | 0.0118% | 294 (248–346) | 1.56 (1.52–1.60) | 330 | 14964 | 2.21% (1.80–2.61%) |
| Age**, years | ||||||
| 0–4 | 0.0074% | 410 (317–522) | 0.07 (0.07–0.07) | 139 | 3114 | 4.46% (3.24–5.69%) |
| 5–9 | 0.0102% | 308 (239–392) | 1.07 (1.03–1.12) | 144 | 4971 | 2.90% (2.10–3.69%) |
| 10–14 | 0.0114% | 235 (177–306) | 1.23 (1.19–1.28) | 118 | 5788 | 2.04% (1.44–2.63%) |
| 15–19 | 0.0149% | 304 (245–373) | 1.78 (1.72–1.83) | 226 | 8398 | 2.69% (2.08–3.30%) |
| Calendar year** | ||||||
| 1990–1994 | 0.0055% | 351 (217–537) | 1.11 (1.06–1.16) | 69 | 4160 | 1.66% (0.94–2.38%) |
| 1995–1999 | 0.0093% | 298 (225–388) | 1.14 (1.09–1.18) | 110 | 4555 | 2.41% (1.76–3.07%) |
| 2000–2004 | 0.0118% | 331 (265–408) | 1.24 (1.20–1.29) | 158 | 5145 | 3.07% (2.42–3.73%) |
| 2005–2009 | 0.0141% | 294 (238–360) | 1.25 (1.20–1.30) | 174 | 5300 | 3.28% (2.61–3.96%) |
| 2010–2012 | 0.0155% | 258 (162–391) | 1.20 (1.11–1.30) | 116 | 3110 | 3.73% (2.07–5.39%) |
| By transplant characteristics | ||||||
| Transplanted organ | ||||||
| Kidney | 0.0045% | 255 (222–292) | 1.19 (1.12–1.27) | 212 | 22270 | 0.95% (0.74–1.16%) |
| Liver | 0.0040% | 243 (209–282) | 1.19 (1.12–1.27) | 176 | 22270 | 0.79% (0.59–0.99%) |
| Heart/lung | 0.0022% | 508 (440–584) | 1.19 (1.12–1.27) | 200 | 22270 | 0.90% (0.69–1.11%) |
| Intestine | 0.0001% | 2168 (1416–3177) | 1.19 (1.12–1.27) | 26 | 22270 | 0.12% (0.02–0.21%) |
| Multiple/other | 0.0003% | 255 (140–429) | 1.19 (1.12–1.27) | 14 | 22270 | 0.06% (0.02–0.11%) |
| Time since transplantation | ||||||
| During 1st year | 0.0020% | 804 (676–949) | 1.19 (1.12–1.27) | 317 | 22270 | 1.42% (1.16–1.69%) |
| After 1st year | 0.0090% | 189 (159–224) | 1.19 (1.12–1.27) | 310 | 22270 | 1.39% (1.24–1.55%) |
NHL=Non-Hodgkin lymphoma
Case numbers are based on the application of incidence rates observed within the Transplant Cancer-Match study cancer registry areas to person-time estimates based on national data. Due to rounding to the nearest whole number, stratified case numbers may not add up to the estimated total case number in all instances.
As these categories refer to attained age and attained calendar year, a recipient can contribute time to multiple categories across follow-up.
Table 3 presents the proportion of NHL diagnoses in transplant recipients for various subgroups and illustrates the contributions to each estimate from the prevalence of transplant recipients in the general population, transplant recipient NHL incidence, and general population NHL incidence. NHL incidence was lower in girls than boys in the general population, whereas NHL incidence was similar for girls and boys in the transplant population. Consequently, transplant recipients contributed a larger proportion of the NHLs in girls than boys (4.07% vs. 2.21%). In the general population, NHL incidence increased with age, while incidence in the transplant population was highest in children <5 years of age. Accordingly, the proportion of NHLs in transplant recipients was highest among children <5 years of age (4.46%, 95%CI=3.24–5.69%). The proportion of NHL diagnoses occurring in transplant recipients increased over calendar time, from 1.66% (95%CI=0.94–2.38%) of all diagnoses during 1990–1994 rising to 3.73% (95%CI=2.07–5.39%) of diagnoses during 2010–2012. This trend reflected the rising prevalence of transplant recipients over time.
As the kidney was the most frequently transplanted organ, the largest fraction of transplant NHL diagnoses occurred in kidney recipients, followed by heart/lung recipients, who had particularly high NHL risk. In the general population, kidney recipients alone contributed 0.95% of all NHL diagnoses (95%CI=0.74–1.16%, Table 3), while heart/lung recipients alone contributed 0.90% of diagnoses (95%CI=0.69–1.11%). Even though the majority of time contributed by transplant recipients occurred more than a year after transplantation, a similar proportion of NHLs occurred in the first year after transplantation and subsequently, because NHL incidence was particularly high among transplant recipients during the first year.
Compared to NHL overall, transplant recipients made up a much larger proportion of general population DLBCL cases (7.62%, 95%CI=6.35–8.88%; Table 4). Patterns for DLBCL were similar to those for NHL overall with the highest proportions among girls (9.82%), children <5 years old (19.78%), and in later calendar years (11.41% during 2010–2012). Kidney, and heart/lung recipients contributed the most DLBCL cases (2.62% from kidney, 2.48% from heart/lung) compared to recipients of other organs. The majority of DLBCL cases in pediatric transplant recipients (58%) were observed during the first year after transplantation. This time period alone contributed 4.41% of the general population cases.
Table 4.
Pediatric Burkitt lymphoma cases and diffuse large B-cell lymphoma cases contributed by transplant recipients in the United States
| Diffuse large B-cell lymphoma cases | Burkitt lymphoma cases | |||||
|---|---|---|---|---|---|---|
|
| ||||||
| Transplant recipients* | General population* | Proportion of cases in transplant recipients (95%CI) | Transplant recipients* | General population* | Proportion of cases in transplant recipients (95%CI) |
|
| Overall | 421 | 5527 | 7.62% (6.35–8.88%) | 46 | 5289 | 0.87% (0.51–1.23%) |
| By population characteristics | ||||||
| Sex | ||||||
| Female | 217 | 2209 | 9.82% (7.55–12.10%) | 18 | 1166 | 1.54% (0.45–2.64%) |
| Male | 203 | 3319 | 6.12% (4.66–7.58%) | 27 | 4123 | 0.65% (0.32–0.99%) |
| Age**, years | ||||||
| 0–4 | 88 | 445 | 19.78% (12.89–26.66%) | 11 | 1027 | 1.07% (0.16–1.98%) |
| 5–9 | 81 | 686 | 11.81% (7.21–16.41%) | 14 | 1782 | 0.79% (0.24–1.33%) |
| 10–14 | 80 | 1319 | 6.07% (3.93–8.20%) | 9 | 1378 | 0.65% (0.09–1.22%) |
| 15–19 | 171 | 3078 | 5.56% (4.05–7.06%) | 12 | 1102 | 1.09% (0.11–2.07%) |
| Calendar period** | ||||||
| 1990–1994 | 53 | 1126 | 4.71% (2.35–7.07%) | 4 | 925 | 0.43% (0–1.23%) |
| 1995–1999 | 65 | 1158 | 5.61% (3.64–7.59%) | 9 | 1033 | 0.87% (0.08–1.67%) |
| 2000–2004 | 102 | 1216 | 8.39% (6.14–10.64%) | 14 | 1285 | 1.09% (0.34–1.84%) |
| 2005–2009 | 111 | 1248 | 8.89% (6.63–11.16%) | 16 | 1285 | 1.25% (0.40–2.09%) |
| 2010–2012 | 89 | 780 | 11.41% (5.54–17.28%) | 3 | 760 | 0.39% (0–1.06%) |
| By transplant characteristics | ||||||
| Organ type | ||||||
| Kidney | 145 | 5527 | 2.62% (1.92–3.32%) | 8 | 5289 | 0.15% (0.01–0.29%) |
| Liver | 107 | 5527 | 1.94% (1.26–2.61%) | 25 | 5289 | 0.47% (0.20–0.74%) |
| Heart/lung | 137 | 5527 | 2.48% (1.77–3.18%) | 13 | 5289 | 0.25% (0.05–0.44%) |
| Intestine | 22 | 5527 | 0.40% (0.04–0.76%) | 0 | 5289 | 0% |
| Multiple/other | 9 | 5527 | 0.16% (0.01–0.31%) | 0 | 5289 | 0% |
| Time since transplantation | ||||||
| During 1st year | 244 | 5527 | 4.41% (3.48–5.35%) | 0 | 5289 | 0% |
| After 1st year | 177 | 5527 | 3.20% (2.36–4.05%) | 47 | 5289 | 0.89% (0.64–1.14%) |
Case numbers are based on the application of incidence rates observed within the Transplant Cancer-Match study cancer registry areas to person-time estimates based on national data. Due to rounding to the nearest whole number, stratified case numbers may not add up to the estimated total case number in all instances.
As these categories refer to attained age and attained calendar year, a recipient can contribute time to multiple categories across follow-up.
Transplant recipients contributed a smaller proportion of BL diagnoses in the pediatric population (0.87%, 95%CI=0.51–1.23%; Table 4). Transplant recipients contributed a larger proportion of BL cases among girls (1.54%) than boys (0.65%), but proportions did not vary noticeably across age groups (Table 4). The proportion of BL diagnoses contributed by transplant recipients increased across calendar time (0.43% in 1990–1994, 1.25% in 2005–2009), except in the most recent 2010–2012 calendar period, during which only 0.39% of diagnoses were among transplant recipients due to a drop in the BL incidence rate among transplant recipients. All BL diagnoses in transplant recipients were observed among kidney, liver, and heart/lung recipients, and all diagnoses occurred more than a year after transplantation.
Discussion
While very few US children and adolescents have received a solid organ transplant, this population contributes a disproportionate fraction of pediatric NHL cases, especially DLBCL cases. This large contribution is due to the highly elevated risk of NHL after transplant. The proportion of pediatric NHLs attributable to transplant recipients is growing over calendar time, as transplant recipients make up an increasing proportion of the pediatric population, though transplant in this population remains rare. Moreover, most NHL diagnoses are made within the first year after transplantation and among very young children.
NHL is one of many cancers for which solid organ transplant recipients have heightened risk.3,16 Immunosuppressant medications administered after transplantation are considered the primary cause of this increased risk, and reflecting this mechanism, most of the increase in the transplant population is from infection-related cancers.16,18 NHL cases are largely attributable to EBV infection that occurs while recipients are immunosuppressed, as evidenced by the high prevalence of EBV detectable in NHL tumors, particularly cases diagnosed during the heavily immunosuppressed period early after transplantation.8,9 Also reflecting this EBV-driven etiology, the most common NHL subtypes in our population were DLBCL and BL, two EBV-associated subtypes. Patients who experience primary EBV infection after transplantation are particularly susceptible, as transplant recipients have higher NHL risk if they are seronegative for EBV prior to transplantation (indicating that they can subsequently experience primary infection).9,10 Children are especially vulnerable because, unlike adults, many have not been exposed to EBV prior to transplantation.19
The proportion of pediatric NHLs in the US general population linked to transplantation differed across subgroups. These differences reflect characteristics of recipient subgroups with strongly elevated NHL risk and those that make up a larger fraction of the transplant population. For instance, transplant recipients made up 4.5% of NHL diagnoses in children <5 years old. This higher proportion occurs because the youngest transplant recipients have the highest incidence of NHL (likely resulting from greater susceptibility to primary EBV infection in this population, and because a larger proportion of recipients were followed within one year of transplantation), whereas children <5 years old in the general population have particularly low NHL incidence. While male and female transplant recipients had similar NHL risk, girls contributed a larger proportion of NHL diagnoses because, in the general population, girls have lower NHL risk than boys. In addition, most NHL diagnoses in transplant recipients occurred in the first year after transplantation because of the very high risk during this period. This high risk may be attributable to the high levels of immunosuppression administered at and early after transplantation.20 As a result, this short time interval accounted for 1.4% of all US pediatric NHL cases. When considered by type of organ transplanted, most NHL diagnoses were contributed by kidney recipients as this is the most frequently transplanted organ, but heart/lung recipients contributed the next highest proportion because NHL risk is markedly elevated in this group.
Notably, we found that the proportion of pediatric NHLs that are diagnosed in transplant recipients is increasing with calendar time. This trend is driven by the rising prevalence of transplant recipients in the general population, and not by increases in NHL risk among transplant recipients (Table 3). Pediatric transplantation remains rare, but the rising number of living pediatric transplant recipients can be attributed to improvements in immunosuppression approaches, surgical techniques, and infectious disease control, which have led to increasing survival rates following transplantation.15,21,22
Most NHLs diagnosed after transplantation were DLBCLs, and as a result, transplant cases made up a much larger fraction of the US pediatric DLBCL burden than for NHL overall. Remarkably, transplant recipients contributed one in five DLBCL cases diagnosed in children <5 years of age, and more than one in ten cases across all ages in the most recent calendar years (2010–2012). By contrast, transplant recipients made up a considerably smaller proportion of pediatric BL burden, contributing less than 1% of US cases. Some patterns of BL incidence in transplantation also differed from those for DLBCL. For example, while the majority of DLBCLs occurred within the first year of transplantation, all BL cases occurred after the first year. This is consistent with prior research showing that BL incidence rises over time after transplantation.23 Other patterns appeared consistent for DLBCL and BL. For instance, while DLBCL and BL are disproportionately diagnosed among boys in the general population, for both subtypes counts were more similar between boys and girls in the transplant population. Transplantation and its associated immune suppression seems to be an equalizer of sex differences in pediatric NHL risk.
While transplant recipients made up a meaningful proportion of DLBCL and BL cases, this was not the case for all subtypes. Some NHL subtypes do not have highly elevated risk in the setting of transplantation and immunosuppression,13 and for these subtypes the transplant population made little or no contribution to the population burden. For instance, no diagnoses of precursor cell lymphoblastic lymphoma were identified among pediatric recipients in our study, even though it is one of the most common subtypes in children. However, <1 case was expected based on the size of the transplant population, so this does not necessarily represent a reduction in risk.
Childhood cancer is a major medical research priority, and NHL is among the most common childhood cancers.24 Despite the fact that pediatric transplant recipients make up an important proportion of pediatric NHL cases, few studies have focused specifically on this population. NHL treatment approaches may be more complicated in transplant recipients, as therapies directed at controlling the tumor may damage the graft or lead to rejection.25,26 It is yet unclear whether survival differs substantially between NHL patients with and without a solid organ transplant.8,9 Additionally, given the concentration of risk during a narrow time window in this small group, the pediatric transplant population would be a particularly good target for preventive interventions. While an effective EBV vaccine or prophylaxis is not currently available, many pediatric recipients are monitored with serial measurements of circulating EBV viral load levels.27 However, it is currently unclear whether changes to immunosuppressant regimens after EBV detection effectively prevent the development of NHL or the broader group of post-transplant lymphoproliferative disorders.5,28
This study is the first to estimate the impact of transplantation on the US burden of pediatric NHL. The TCM Study provides reliable estimates of cancer incidence in transplant recipients because cases are identified through linkage with cancer registries that verify diagnoses through standardized protocols. Linking with cancer registries is also advantageous because they have information on incident cancer diagnoses for the general population, providing a uniform method of cancer ascertainment. The geographic areas covered by the TCM Study also capture a large, representative sample of the overall US population.
Limitations should also be mentioned. First, only the DLBCL and BL subtypes were frequent enough to evaluate individually. Nonetheless, the rarity of other subtypes in the pediatric transplant population implies that their contribution to the overall US NHL counts would be minimal. In addition, we only had information on EBV status at transplantation for 50% of recipients, and so we could not accurately estimate the degree to which EBV influences the burden of NHL contributed by transplant recipients. Also, while the TCM Study linkage between the SRTR and cancer registries has high sensitivity, it can miss cancer diagnoses in transplant recipients, particularly among recipients who migrate out of the cancer registry catchment areas.29 This will cause underestimation of NHL risk in transplant recipients, particularly in later years after transplantation, and result in underestimation of the proportion of NHLs attributable to transplant recipients. Finally, the length of follow-up time after transplantation available for most pediatric transplant recipients was somewhat short (median=3.3 years). This partly reflects the reality of the current pediatric transplant recipient population, because high rates of re-transplantation and mortality after transplant, and the recency of many transplants, have limited the time these individuals have been at risk for NHL. However, a subset of recipients were lost to follow-up by SRTR, which would have led to underestimation of the NHL burden attributable to transplant recipients. Furthermore, the true contribution of transplant recipients to the US NHL burden may change in the future if recipients survive for longer time periods with their transplant.
In conclusion, transplant recipients contribute a substantial fraction of all NHL diagnoses in US children and adolescents, especially for DLBCL. The proportion of NHL diagnoses attributable to transplant recipients has grown over time, and it is likely that this population will be an important source of pediatric NHL cases in the future. It would be beneficial for a portion of future efforts in pediatric lymphoma research to focus specifically on transplant recipients, as this unique group may require prevention and treatment approaches that differ from the general population. EBV prevention or treatment targeted towards this group could potentially lead to measureable reductions in pediatric NHL incidence overall.
Acknowledgments
The authors gratefully acknowledge the support and assistance provided by individuals at the Health Resources and Services Administration (Monica Lin), the SRTR (Ajay Israni, Bertram Kasiske, Paul Newkirk, Jon Snyder), and the following cancer registries: the states of California, Colorado (Jack Finch), Connecticut (Lou Gonsalves), Florida (Brad Wohler), Georgia (Rana Bayakly), Hawaii (Brenda Hernandez), Iowa, Illinois, Kentucky (Jaclyn Nee), Michigan (Glenn Copeland), New Jersey (Xiaoling Niu), New York, North Carolina (Chandrika Rao), Texas (Leticia Nogueria), and Utah (Janna Harrell), and the Seattle-Puget Sound area of Washington (Margaret Madeleine). We also thank analysts at Information Management Services for programming support (David Castenson, Matthew Chaloux, Michael Curry, Ruth Parsons).
Funding=This work was supported in part by the Intramural Research Program of the National Cancer Institute. The SRTR is currently operated under contract number HHSH250201500009C (Health Resources and Services Administration) by the Minneapolis Medical Research Foundation, Minneapolis, MN. Previously the SRTR was managed under contracts HHSH250201000018C and HHSH234200537009C. The following cancer registries were supported by the National Cancer Institute SEER Program: California (contracts HHSN261201000036C, HHSN261201000035C, and HHSN261201000034C), Connecticut (HHSN261201300019I), Hawaii (HHSN261201000037C, N01-PC-35137, and N01-PC-35139), Iowa (HSN261201000032C and N01-PC-35143), New Jersey (HHSN261201300021I, N01-PC-2013-00021), Seattle-Puget Sound (N01-PC-35142), and Utah (HHSN2612013000171). The following cancer registries were supported by the National Program of Cancer Registries of the Centers for Disease Control and Prevention: California (agreement 1U58 DP000807-01), Colorado (U58 DP000848-04), Georgia (5U58DP003875-01), Illinois (5U58DP003883-03), Maryland (U58DP12-1205 3919-03), Michigan (5U58DP003921-03), New Jersey (5U58/DP003931-05-00), New York (U58DP003879), North Carolina (U58DP000832) and Texas (5U58DP000824-04). Additional support was provided by the states of California, Colorado, Connecticut, Illinois, Iowa, Massachusetts (Massachusetts Cancer Prevention and Control Cooperative Agreement 5458DP003920), New Jersey, New York (including the Cancer Surveillance Improvement Initiative), Texas, Utah, and Washington, as well as the University of Utah and Fred Hutchinson Cancer Research Center in Seattle, WA.
Footnotes
Conflicts of Interest=Christina A. Clarke is employed by GRAIL, Inc. All other authors have no conflicts of interest.
Author Contributions=ELY and EAE conceptualized the study. ELY, EAE, and MSS developed the study design and methodology. ELY was responsible for data curation, conducting formal statistical analyses, and drafting the original manuscript. All authors evaluated the study design, interpreted results, and reviewed and edited the manuscript.
The views expressed in this paper are those of the authors and should not be interpreted to reflect the views or policies of the National Cancer Institute, Health Resources and Services Administration, SRTR, cancer registries, or their contractors.
References
- 1.Kaatsch P. Epidemiology of childhood cancer. Cancer Treat Rev. 2010;36(4):277–285. doi: 10.1016/j.ctrv.2010.02.003. [DOI] [PubMed] [Google Scholar]
- 2.Ward E, DeSantis C, Robbins A, Kohler B, Jemal A. Childhood and adolescent cancer statistics, 2014. CA: a cancer journal for clinicians. 2014;64(2):83–103. doi: 10.3322/caac.21219. [DOI] [PubMed] [Google Scholar]
- 3.Yanik EL, Smith JM, Shiels MS, et al. Cancer risk among pediatric solid organ transplant recipients in the United States. Pediatrics. 2017;139(5):e20163893. doi: 10.1542/peds.2016-3893. [DOI] [PMC free article] [PubMed] [Google Scholar]
- 4.Simard JF, Baecklund E, Kinch A, et al. Pediatric organ transplantation and risk of premalignant and malignant tumors in Sweden. Am J Transplant. 2011;11(1):146–151. doi: 10.1111/j.1600-6143.2010.03367.x. [DOI] [PubMed] [Google Scholar]
- 5.Allen UD, Preiksaitis JK, Practice ASTIDCo Epstein-Barr virus and posttransplant lymphoproliferative disorder in solid organ transplantation. Am J Transplant. 2013;13(Suppl 4):107–120. doi: 10.1111/ajt.12104. [DOI] [PubMed] [Google Scholar]
- 6.Ok CY, Li L, Xu-Monette ZY, et al. Prevalence and clinical implications of epstein-barr virus infection in de novo diffuse large B-cell lymphoma in Western countries. Clin Cancer Res. 2014;20(9):2338–2349. doi: 10.1158/1078-0432.CCR-13-3157. [DOI] [PMC free article] [PubMed] [Google Scholar]
- 7.Parkin DM. The global health burden of infection-associated cancers in the year 2002. Int J Cancer. 2006;118(12):3030–3044. doi: 10.1002/ijc.21731. [DOI] [PubMed] [Google Scholar]
- 8.Kinch A, Baecklund E, Backlin C, et al. A population-based study of 135 lymphomas after solid organ transplantation: The role of Epstein-Barr virus, hepatitis C and diffuse large B-cell lymphoma subtype in clinical presentation and survival. Acta Oncol. 2014;53(5):669–679. doi: 10.3109/0284186X.2013.844853. [DOI] [PubMed] [Google Scholar]
- 9.Knight JS, Tsodikov A, Cibrik DM, Ross CW, Kaminski MS, Blayney DW. Lymphoma after solid organ transplantation: risk, response to therapy, and survival at a transplantation center. J Clin Oncol. 2009;27(20):3354–3362. doi: 10.1200/JCO.2008.20.0857. [DOI] [PubMed] [Google Scholar]
- 10.Gibson TM, Engels EA, Clarke CA, Lynch CF, Weisenburger DD, Morton LM. Risk of diffuse large B-cell lymphoma after solid organ transplantation in the United States. American journal of hematology. 2014;89(7):714–720. doi: 10.1002/ajh.23726. [DOI] [PMC free article] [PubMed] [Google Scholar]
- 11.Grulich AE, Vajdic CM, Cozen W. Altered immunity as a risk factor for non-Hodgkin lymphoma. Cancer Epidemiol Biomarkers Prev. 2007;16(3):405–408. doi: 10.1158/1055-9965.EPI-06-1070. [DOI] [PubMed] [Google Scholar]
- 12.Caillard S, Dharnidharka V, Agodoa L, Bohen E, Abbott K. Posttransplant Lymphoproliferative Disorders after Renal Transplantation in the United States in Era of Modern Immunosuppression. Transplantation. 2005;80:1233–1243. doi: 10.1097/01.tp.0000179639.98338.39. [DOI] [PubMed] [Google Scholar]
- 13.Clarke CA, Morton LM, Lynch C, et al. Risk of lymphoma subtypes after solid organ transplantation in the United States. Br J Cancer. 2013;109(1):280–288. doi: 10.1038/bjc.2013.294. [DOI] [PMC free article] [PubMed] [Google Scholar]
- 14.Smith JM, Rudser K, Gillen D, et al. Risk of lymphoma after renal transplantation varies with time: an analysis of the United States Renal Data System. Transplantation. 2006;81(2):175–180. doi: 10.1097/01.tp.0000188687.18972.a8. [DOI] [PubMed] [Google Scholar]
- 15.OPTN/SRTR Annual Data Report 2014. American Journal of Transplantation: Minneapolis Medical Research Foundation; 2014. Scientific Registry of Transplant Recipients. [Google Scholar]
- 16.Engels EA, Pfeiffer RM, Fraumeni JF, Jr, et al. Spectrum of cancer risk among US solid organ transplant recipients. JAMA. 2011;306(17):1891–1901. doi: 10.1001/jama.2011.1592. [DOI] [PMC free article] [PubMed] [Google Scholar]
- 17.Breslow N, Day N. The Design and Analysis of Cohort Studies. Vol. 2. Lyon, France: International Agency for Cancer Research; 1987. [PubMed] [Google Scholar]
- 18.Grulich AE, van Leeuwen MT, Falster MO, Vajdic CM. Incidence of cancers in people with HIV/AIDS compared with immunosuppressed transplant recipients: a meta-analysis. The Lancet. 2007;370(9581):59–67. doi: 10.1016/S0140-6736(07)61050-2. [DOI] [PubMed] [Google Scholar]
- 19.Sampaio MS, Cho YW, Shah T, Bunnapradist S, Hutchinson IV. Impact of Epstein-Barr virus donor and recipient serostatus on the incidence of post-transplant lymphoproliferative disorder in kidney transplant recipients. Nephrol Dial Transplant. 2012;27(7):2971–2979. doi: 10.1093/ndt/gfr769. [DOI] [PubMed] [Google Scholar]
- 20.Halloran PF. Immunosuppressive drugs for kidney transplantation. N Engl J Med. 2004;351(26):2715–2729. doi: 10.1056/NEJMra033540. [DOI] [PubMed] [Google Scholar]
- 21.Magee JC, Krishnan SM, Benfield MR, Hsu DT, Shneider BL. Pediatric transplantation in the United States, 1997-2006. Am J Transplant. 2008;8(4 Pt 2):935–945. doi: 10.1111/j.1600-6143.2008.02172.x. [DOI] [PubMed] [Google Scholar]
- 22.Van Arendonk KJ, Boyarsky BJ, Orandi BJ, et al. National trends over 25 years in pediatric kidney transplant outcomes. Pediatrics. 2014;133(4):594–601. doi: 10.1542/peds.2013-2775. [DOI] [PMC free article] [PubMed] [Google Scholar]
- 23.Mbulaiteye SM, Clarke CA, Morton LM, et al. Burkitt lymphoma risk in US solid organ transplant recipients. American journal of hematology. 2013;88:245–250. doi: 10.1002/ajh.23385. [DOI] [PMC free article] [PubMed] [Google Scholar]
- 24.American Cancer Society. Cancer Facts and Figures 2014: Special Section on Childhood and Adolescent Cancer. American Cancer Society; 2014. http://www.cancer.org/research/cancerfactsstatistics/cancerfactsfigures2014/index: [Google Scholar]
- 25.Zimmermann H, Reinke P, Neuhaus R, et al. Burkitt post-transplantation lymphoma in adult solid organ transplant recipients: sequential immunochemotherapy with rituximab (R) followed by cyclophosphamide, doxorubicin, vincristine, and prednisone (CHOP) or R-CHOP is safe and effective in an analysis of 8 patients. Cancer. 2012;118(19):4715–4724. doi: 10.1002/cncr.27482. [DOI] [PubMed] [Google Scholar]
- 26.Evens AM, Roy R, Sterrenberg D, Moll MZ, Chadburn A, Gordon LI. Post-transplantation lymphoproliferative disorders: diagnosis, prognosis, and current approaches to therapy. Curr Oncol Rep. 2010;12(6):383–394. doi: 10.1007/s11912-010-0132-1. [DOI] [PubMed] [Google Scholar]
- 27.San-Juan R, Manuel O, Hirsch HH, et al. Current preventive strategies and management of Epstein-Barr virus-related post-transplant lymphoproliferative disease in solid organ transplantation in Europe. Results of the ESGICH Questionnaire-based Cross-sectional Survey. Clin Microbiol Infect. 2015;21(6):604 e601–609. doi: 10.1016/j.cmi.2015.02.002. [DOI] [PubMed] [Google Scholar]
- 28.San-Juan R, Comoli P, Caillard S, et al. Epstein-Barr virus-related post-transplant lymphoproliferative disorder in solid organ transplant recipients. Clin Microbiol Infect. 2014;20(Suppl 7):109–118. doi: 10.1111/1469-0691.12534. [DOI] [PubMed] [Google Scholar]
- 29.Yanik EL, Nogueira LM, Koch L, et al. Comparison of cancer diagnoses between the US solid organ transplant registry and linked central cancer registries. Am J Transplant. 2016;16(10):2986–2993. doi: 10.1111/ajt.13818. [DOI] [PMC free article] [PubMed] [Google Scholar]