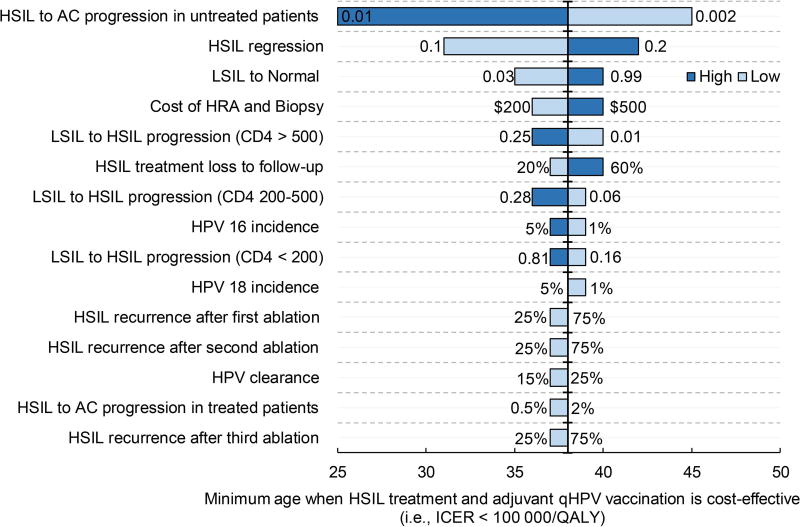
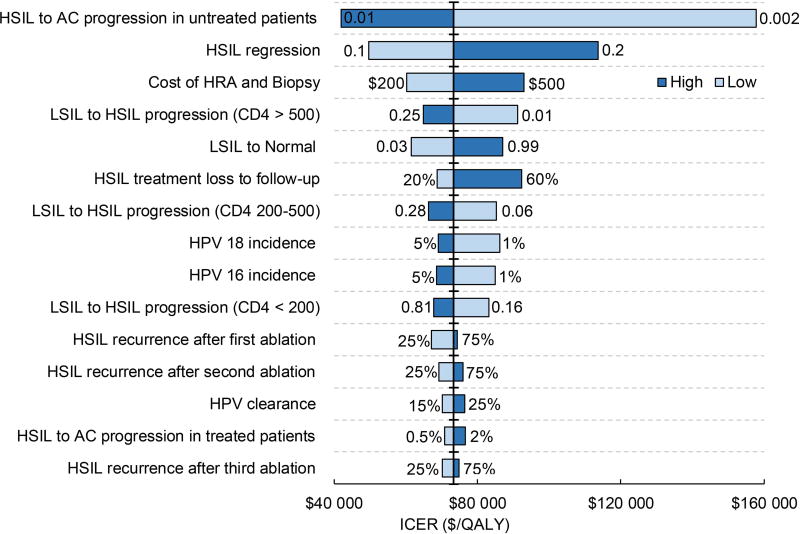
Figure 4. Tornado diagrams displaying the top 15 model parameters in the order of their impact on HSIL age at diagnosis and their impact on ICER.
a depicts the top 15 model parameters in the order of their impact on age. The horizontal axis represents the age at HSIL diagnosis. The parameters are arrayed along the vertical line, which represents the minimum HSIL age at diagnosis of 38 years when treatment plus adjuvant qHPV vaccination becomes cost-effective. Bars are arranged in the ascending order of their bar width (degree of uncertainty). The longest bar represents the parameter generating the widest uncertainty.
b depicts the top 15 model parameters in the order of their impact on cost-effectiveness. The horizontal axis represents the incremental cost-effectiveness ratio (the ratio of incremental cost and incremental effectiveness comparing undominated strategies). The parameters are arrayed along the vertical line, which represents the outcome point of base case ICER of $73 367/QALY. Bars are arranged in the ascending order of their bar width (degree of uncertainty). The longest bar represents the parameter generating the widest uncertainty.
AC, anal cancer; HRA, high-resolution anoscopy


