Abstract
Metabolism, downstream effectors of genomics, transcriptomics, and proteomics, can determine the potential of phenotype of an organism including plants. Profiling the global scenario of metabolism requires optimization of different solvent extraction methods. Here, we report an approach comparing three different metabolite extraction strategies, including ammonium acetate/methanol (AAM), water/methanol (WM), and sodium phosphate/methanol (PM) in Soybean plant using Ultra-high-performance liquid chromatography coupled high resolution mass spectrometry (UHPLC-HRMS). Interestingly, both AAM and WM methods were found to cover a wider range of metabolites and provide better detection of molecular features than the PM method. Various clustering analyses based on multivariate statistical tools revealed that both AAM and WM methods showed tight and overlapping extraction strategy compared with the PM method. Using MATLAB based Mahalanobis distance (DM) calculation, statistically significant score plot separation was observed between AAM vs. PM, as well as WM vs. PM. However, no significant separation was observed between AAM and WM, which is expected from the overlap of principal component scores for these two methods. Using differential metabolite expression analysis, we identified that a large number of metabolites were extracted at a significantly higher level using AAM versus PM. These comparative extraction methods suggest that AAM can effectively be applied for an LC/MS based plant metabolomics profile study.
Keywords: Metabolite profiling, extraction comparison, Liquid chromatography/Mass spectrometry, Multivariate statistics, metabolomics
Graphical Abstract

INTRODUCTION
The study of metabolites is called metabolomics, which is the downstream complement to genomics, transcriptomics, proteomics, and environmental stimuli, offering a global as well as targeted assessment of the physiological state of a biological system[1]. Metabolites play crucial roles in the living system, acting as both the input and the output of cellular and physiological processes, any range of metabolite perturbations are linked to disease, genetic modification and environmental conditions[2]. Undoubtedly, it is critically important to evaluate metabolite extraction methodologies for an accurate metabolite profiling study, because a solvent composition that is good for one chemical class, may not be suitable for another chemical class, and also may not be suitable for extracting large numbers of metabolites from a particular tissue. Therefore, it is important to understand and monitor the effects of the applied solvent treatment on the samples metabolic content and the profile obtained[3].
In general, biofluids and tissues are commonly utilized samples for metabolic profile analysis of living system, with biofluids central to animal studies[4], and tissue samples used from both plant and mammalian system for metabolic profiling. Metabolite extraction from various biological fluids such as urine[5], plasma, and serum[6] are relatively less complicated, but still required optimization when used. However, metabolite extraction from tissue samples for both plants and animals can be more challenging due to the presence of very diverse metabolites, varied physicochemical properties and concentration ranges in solid specimens[7].
However, until recently a majority of previous studies have placed more importance on the development and advancement of identification approaches or data processing and analysis tools instead of emphasizing metabolite extraction techniques[3]. Recently, some recent research has focused on different metabolite extraction methodologies applied prior to NMR[8–10]or MS based metabolomics profiling in plants[11, 12]. Currently, none of the methods for metabolite extraction are perfect for addressing global metabolic profile. Thus, for solubilizing a higher number of metabolites from plant tissues, efficiency of different solvents or solvent combinations still requires testing and optimization.
In order to gain more insight into the plant metabolic profile, three different metabolite extraction strategies were compared combined with ultra-high performance liquid chromatography and high resolution mass spectrometry (UHPLC-HRMS). In metabolomics, UHPLC-HRMS is widely used and highly acceptable metabolite profiling tool which is amenable to a wide variety of compounds, as well as excellent quantitation, reproducibility, and sensitivity[13]. Multivariate statistical tools such as principal component analysis (PCA) were applied to understand the efficiency of individual metabolite extraction method as well as metabolite fold change analysis in order to clearly understand the most efficient method for extracting and improving the number of metabolites detected. The specific aims of this research were to compare three different extraction methods, and then select the best methods which would yield wide-ranging metabolites for studying plant metabolomics.
MATERIALS AND METHODS
Chemicals and Materials
LC-MS grade water, methanol, ammonium acetate, sodium phosphate, acetonitrile, and formic acid were purchased from Fisher-Scientific (Fairlawn, NJ). A mixture of four isotopically labeled compounds comprising caffeine-D3, leucine-D10, creatine-D3, and tryptophan-D3 (Cambridge Isotopes) in each extraction were used as quality control standard sample. Soybean leaf tissues were provided by southeast center for integrated metabolomics (SECIM) center core-2. For individual extraction method, 10mg of freeze dried soybean leaf samples were used. Tissue samples were collected in three replications for each extraction method and analyzed in triplicate.
Metabolite extraction
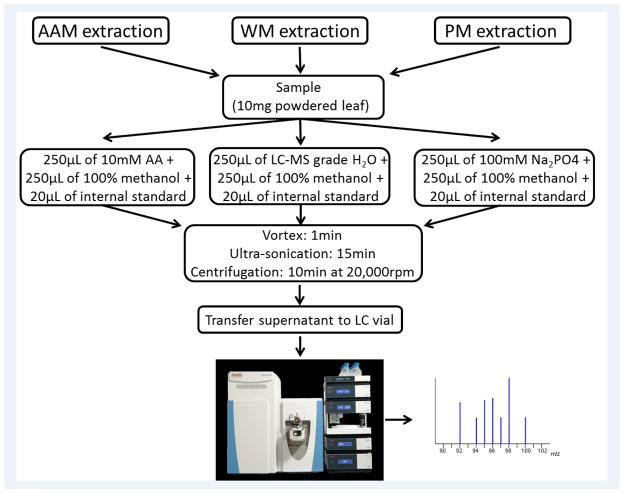
Three different extraction methods were utilized: 1) 1:1 10mM ammonium acetate/methanol (AAM), 2) 1:1 Water/methanol (WM), and 3)1:1 100mM sodium phosphate/methanol (PM) for extracting metabolites from lyophilized soybean leaf tissues. Metabolites were extracted using a modified version of an extraction previously described by kimet al 2010[8]. For each extraction 10mg of tissue samples were measured into a separate 2.0 mL micro-centrifuge tube and then added 250μl ammonium acetate solution and 250μl methanol for AAM extraction at pH 6.0; 250μl LC/MS grade water and 250μl methanol for WM method at pH 7.0; 250μl sodium phosphate buffer and 250μl methanol for PM extraction at pH 7.5. In each tube, 20 μl of the internal standard mixture (40μg/ml L-Tryptophan-2,3,3-D3, 4μg/ml D-Leucine-D10, 4μg/ml Creatine-D3 H2O (methyl-d3), and 4μg/ml Caffeine-D3) was added before adding the solvent. The samples were vortexed for 1 minute, followed by ultrasonication for 15 minutes at room temperature, and centrifugation at 20,000rpm for 10 minutes at 4°C. From each individual extraction method, the supernatants were isolated and transferred to a new 1.5 mL microcentrifuge tube, and the aqueous layer was then centrifuged again at 20,000 rpm for 10 min at 4 °C to completely avoid protein contamination. Finally, supernatant were transferred to LC/MS vial for data collection. An outline of three extraction methods is shown in Figure 1. During the experiment, QC samples were run each time. A pooled QC (25uL aliquot) was prepared for each extraction method and injected after every five samples, one pooled QC was used to estimate the system reproducibility, and one blank (prepared by using solvent that used to reconstitute the sample) was used to flush the column. We did not observe any changes on the number of background ions while blanks changes for each solvent extraction system. Also we did not notice any effects on reproducibility of ion source while changing blank. The stability and repeatability of the instruments were also evaluated using identical neat QC samples (a mixture of deuterated internal standards) throughout the process of experimental samples injection. Principal component analysis (PCA) was performed to evaluate the variation of QC samples, which were supposed to show identical metabolic profiles under the same experimental condition. All of neat QC samples clustered together indicating a satisfactory stability of the instrument and pooled QC of respective methods clustered with respective group (Fig. 4b and Fig. 5).
Fig. 1.
Outline of three different metabolite extraction methods. Three different extractions followed several common steps including amount of tissue, vortexing, ultrasonication, and centrifugation. They are differing only in solvent stage where ammonium acetate methanol (AAM) used 10mM 1:1 ammonium acetate and methanol, phosphate buffer methanol (PM) used 100mM 1:1 sodium phosphate and methanol, and water methanol (WM) used LC/MS grade 1:1 water and methanol.
Fig. 4.
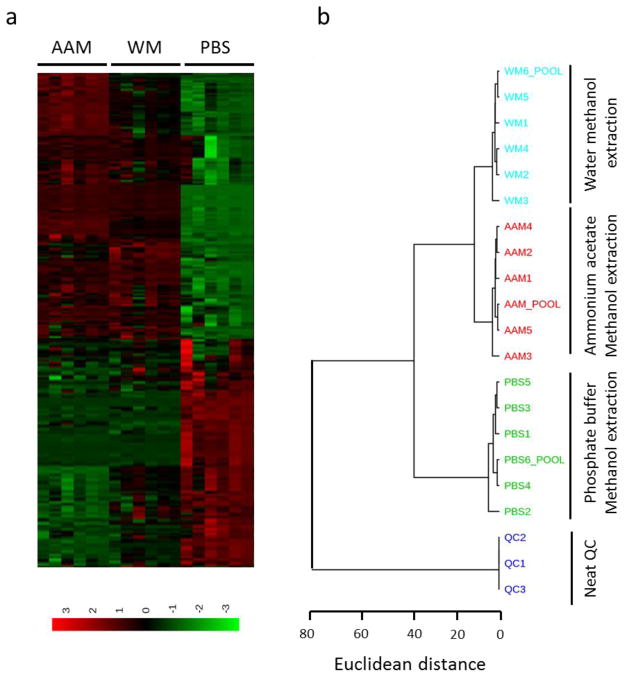
Hierarchical clustering analysis of three different plant metabolite extraction methods using metaboanalyst 3.0. a) Heatmap generated using sum normalized and auto scaled data based on euclidean distance and ward algorithm. Each column refers to a sample and each row to a metabolic feature across the samples. b) Dendogram derived based on Euclidean distance and ward algorithm as well. Phosphate buffer methanol (PM) extraction method clustered separately than the ammonium acetate methanol (AAM) and water methanol (WM) extraction methods.
Fig. 5.
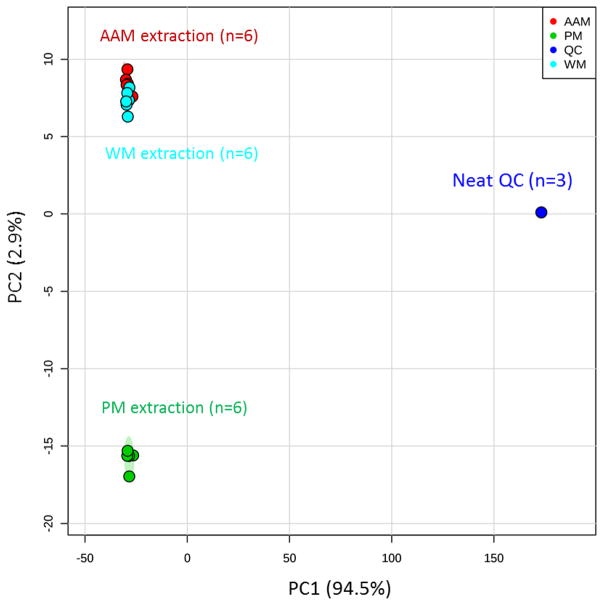
PCA Score plots analysis. PC1 vs. PC2 score plot for each extraction method. The total explained varience is >93%. The ovals represent 95% confidence intervals. Each oval represents a sample group and each point in the oval represents a single sample. All three extraction methods are compared where red oval is AAM (ammonium acetate methanol), blue oval is WM (water methanol), and green oval is PM (phosphate buffer methanol) extraction method.
Liquid chromatography/Mass spectrometry data acquisition
Data collection was performed by reversed-phase ultra-high performance liquid chromatography (UHPLC) coupled with high resolution mass spectrometry (HRMS). An ACE Excel C18-PFP column (2.1 × 100 mm, 2μm particle size) maintained at 35°C was used for all extraction methods. Gradient mobile phase consisting of 0.1% formic acid in water (solvent A) and acetonitrile (Solvent B) were used. The flow rate was 0.35 mL/min and the injection volume was 4μl. The total run time was 22 minutes, including a 2 min equilibration. Thermo Dionex Ultimate 3000 UHPLC was coupled to a Thermo Q-ExactiveOrbitrap (San Jose, CA). Mass spectral data was collected from m/z 70 to 700 in both positive and negative ionization mode with run time 0 – 17.5 min, resolution 70,000 (at m/z 200). MS tune conditions were as follows: spray voltage, 3.00 kV; sheath gas flow rate 45 arbitrary units; auxiliary gas flow rate 10 arbitrary units; sweep gas flow rate 1 arbitrary units; auxiliary nitrogen pressure 5 arbitrary units; capillary temperature 325°C; HESI auxiliary gas heater temperature 350°C, and S-lens RF level, 30, and employed for collecting positive and negative ion mode data.
LC/MS Data extraction, processing and Molecular features analysis
Data were recorded from 0.0 – 17 min as total ion chromatography (TIC) and then corresponding MS data were extracted using Thermo Xcalibur (version 2.2.44). After data collection, raw data files were converted to mzXML format using ProteowizardMSConvert software[14]. MZmine 2.15 (freeware) was used for mass detection with mass detector centroid noise set at 1.0E5 using only MS level 1 data, chromatogram building and deconvolution was then applied (m/z tolerance 0.005 or 10 ppm, retention time tolerance 0.2 min, minimum time span 0.1 min, and minimum height 5.0E5) followed by isotope grouping, alignment (m/z tolerance 0.005 or 10 ppm, retention time tolerance 0.2 min), and gap filling (m/z tolerance 0.005 or 10 ppm, retention time tolerance 0.2 min, and intensity tolerance 25%). Total positive and negative ion molecular features were also counted using MZmine 2.15[15]. MZmine based online metabolite search engine KEGG and MMCD database, XCMS online database, and internal retention time library were used for the identification of metabolites.
Multivariate statistical analysis
Data were sum normalized, log transformed (generalized logarithm transformation or glog), and auto-scaled (mean-centered and divided by the standard deviation of each variable) for multivariate statistical analysis using metaboanalyst 3.0. The normalization by sum method is often used for spectral data in which the total spectral area is assumed to be constant and each feature is divided by the sum of all features. This method aims to reduce systematic bias during sample collection. Prior to performing analysis, m/z data tables were generated by using MZmine 2.15. All statistical analysis was performed using MetaboAnalyst 3.0 (MetaboAnalyst 3.0 - a comprehensive server for metabolomic data analysis)[16]. Principal component (PC) 1, PC2, PC3, PC4, and PC5 score plot data were analyzed, where all score plot data showed very similar dynamics of metabolic profile. PC1 and PC2 represented most of the variables, then PC3, PC4, and PC5. For each scores plot generated during the analysis, Mahalanobis distance (DM), two-sample Hotelling’s T2 statistic (T2), F-values (Ft) and critical F-values (Fc) were calculated using MatLab R2010b software[17].
RESULTS AND DISCUSSION
In this study, we compared three different metabolite extraction strategies for standardizing a small molecule metabolite extraction approach for soy leaf tissues. Different aspects for comparing and selecting best metabolite extraction method are discussed in the following sections.
Molecular features analysis
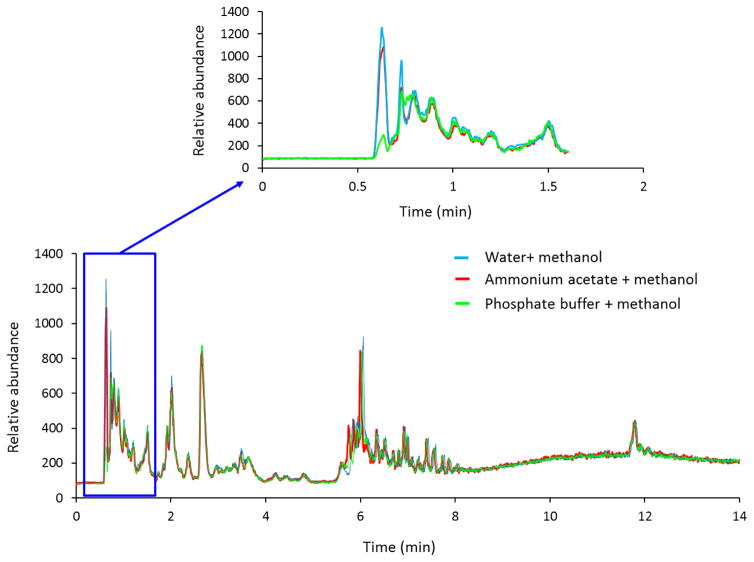
The total ion chromatogram (TIC) patterns of three different extraction methods were overlaid to comparing detection efficiency of molecular features from soy leaf tissues. AAM and WM extraction methods showed a similar TIC pattern and better detection of molecular features when compared with the PM extraction method at the regions of 0.62 – 2.0 min as evidenced by a decrease in signal for several metabolites in the TIC (Figure 2). Molecular features in a small subset at the region of 0.62 – 1.0 min with masses were compared to demonstrate the efficiency of metabolite extraction among AAM, WM and PM. Comparison between AAM and WM extraction method showed very similar mass spectra (Figure 2). In a same mass range, the AAM method demonstrated enhanced extraction (or reduction in ion suppression) of metabolites and high intense peaks in soy leaf tissues compared with the PM extraction method (Figure 2).
Fig. 2.
An overlapping comparison of the representative TIC pattern. An ammonium acetate methanol (AAM) and water methanol (WM) extraction method gives better detection of molecular features over phosphate buffer methanol (PM) extraction method. An overlapping comparison of the TIC patterns for soy leaf tissues using AAM (red), WM extraction (blue), or PM (green), plotted as a function of ion intensities with retention time.
The primary goal of this comparative metabolite extraction strategy was to develop an extraction procedure that enabled optimal metabolite extraction for the determination of as many molecular features as possible. After collecting data using UHPLC/HRMS, raw data were then processed by MZmine software and obtained approximately 6500 (combining positive and negative ion mode) molecular features for both AAM and WM extraction methods and approximately 6000 (combining positive and negative ion mode) molecular features for PM extraction method (Figure 3). It was reported that two extraction methods such as multi-solvent extraction and water solvent extraction showed significantly different metabolic profile in human breast cancer cell line, MCF-7[18]. In grape, different solvent mixtures efficiency was evaluated by assessing the number of molecular features[3]. Here, applying three different extraction methods in soy leaf tissues, PM extraction was found to be less efficient for overall feature extraction. To further understanding molecular feature effects on metabolic profile of soybean using the three different extraction methods, multivariate principal component analysis (PCA) was conducted.
Fig. 3.
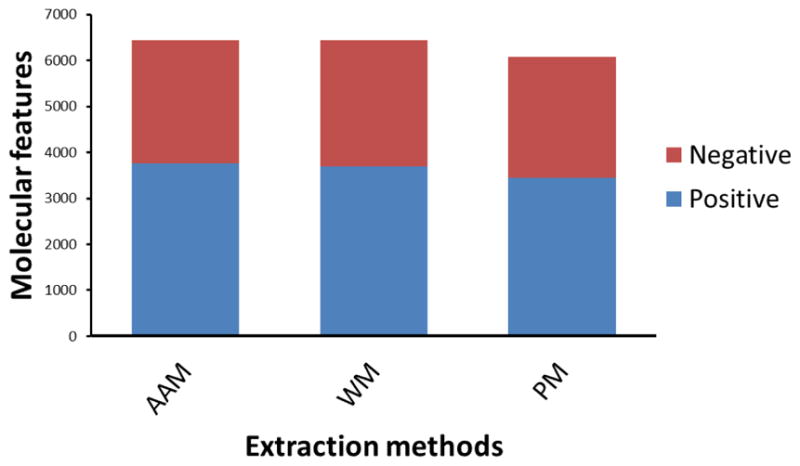
Molecular features study. Combining both positive and negative ion data, ammonium acetate methanol (AAM) and water methanol extraction (WM) methods produced higher feature numbers, whereas phosphate buffer methanol (PM) extraction produced less features than both AAM and WM methods. However, it was interesting that the overall total number of metabolites detected with PM was higher than anticipated, as it is known that phosphate buffers can cause ion suppression with MS analyses.
Multivariate statistical analysis
Heatmap analysis based on a ward clustering algorithm revealed strong correlation among metabolic features between AAM and WM extraction methods, but PM extraction showed a distinctly different profile (Figure 4A). Subsequently, Hierarchial clustering analysis of three different extraction methods also confirmed relatively closer clustering of AAM and WM extraction efficiency, but not for PM extraction (Figure 4B). This analysis revealed greater similarity between AAM and WM extraction strategy. PM extraction demonstrated markedly different from those of the other two extraction methods.
Distinct separations among metabolic profiles extracted by the three different extraction methods for soybean leaf tissues were analyzed using PCA score plots, indicating distinctive differences in the extraction mechanism. More precisely, the AAM and WM extracted metabolic profiles were very similar; however, the PM extracted profile showed distinct separation from AAM and WM (Fig. 5). Pairwise PCA score plot analysis were carried out between AAM vs PM, WM vs PM, and AAM vs WM in order to understand the metabolite feature production efficiency. Significant metabolic profile separations were observed in AAM vs PM and WM vs PM comparisons (Fig. 5 and Table 1). These significant separations indicated distinct extraction differences by AAM, PM, and WM methods. However, the AAM vs WM extractions did not show significant separation in PCA, which was expected because the TIC pattern, molecular features, hierarchial clustering and PC score plots of these two extraction methods were very similar (Fig. 5& Table 1). For each pair-wise comparison described above and shown in Fig. 5, a calculated Mahalanobis distance (DM) indicates the magnitude of the metabolic profile separation. This distance was considered significant based on the other calculated values given in Table 1 and described by Goodpaster& Kennedy[17]. If the F-true value is higher than the F-critical value, then the DM represents a statistically significant separation in the comparison, which is the case for AAM vs PM and WM vs PM. Visual inspection of the PCA scores plots provided the completely separate clusters for two groups of spectra as well as computation of the Mahalanobis distance (DM) also provided a convenient metric to quantitatively compare the magnitude of cluster separation[17]. PCA scores plots allowed discriminating pattern among control and experimental samples in various plant biotechnology research[19–21]. Each data point in a score plot represents all extracted metabolites present in one sample; therefore, the separations between the grouped metabolic profiles can be based on individual metabolites. Metabolite differences (qualitative or quantitative) that contribute to score plot separations were identified using differential statistical analysis (Table 2).
Table 1.
The Mahalanobis distances (DM) are listed for each pair of comparison. Mahalanobis distance (DM), two-sample Hoteling’s T2 test, and F-test values shown, where F-true> F-critical indicates a statistically significant separation between each pair of metabolite extraction methods. Both AAM (ammonium acetate methanol) vs PM (phosphate buffer methanol) and PM vs WM (water methanol) comparison showed significance separation, but AAM vs WM showed non-significance extraction efficiency separation.
| Statistical parameters | AAM vs PM | WM vs PM | AAM vs WM |
|---|---|---|---|
|
| |||
| Mahalanobis distances (DM) | 27.32 | 13.72 | 2.64 |
| T2 (T-test) | 1.12E+03 | 282.25 | 10.43 |
| F-True | 419.73 | 105.84 | 3.91 |
| F-Critical | 7.71 | 7.71 | 7.71 |
| Significance status | yes | yes | no |
Table 2.
List of differentially changing metabolites among the three extraction methods tested. AAM is ammonium acetate methanol, PM is phosphate buffer methanol, and WM is water methanol. Significantly changing metabolites were identified using One-way Analysis of Variance (ANOVA).
| Compound name | RT | m/z | AAM extraction | WM extraction | PM extraction | p-value |
|---|---|---|---|---|---|---|
| L-Arginine | 0.74 | 175.12 | Up | Up | Down | 0.02 |
| Aspartate | 0.742 | 134.04 | Up | Up | Down | 0.021 |
| L-Histidine | 0.71 | 156.08 | Up | Up | Down | 0.0001 |
| L-Lysine | 0.66 | 147.11 | Up | Up | Down | 0.0023 |
| L-Citrulline | 1.265 | 176.103 | Up | Up | Down | 0.042 |
| L-Valine | 0.851 | 118.086 | Up | Up | Down | 0.036 |
| Alanine | 0.752 | 90.055 | Up | Up | Down | 0.035 |
| Uracil | 2.914 | 113.035 | Up | Up | Down | 0.041 |
| L-Threonine | 5.909 | 120.065 | Up | Up | Down | 0.012 |
| Pyruvate | 1.120 | 89.024 | Up | Down | Down | 0.066 |
| Zeatin | 6.044 | 220.118 | Up | Up | Down | 0.01 |
| Lysyl-Phenylalanine | 5.824 | 294.181 | Up | Down | Down | 0.051 |
| D-Glucosamine | 0.745 | 180.086 | Up | Down | Down | 0.063 |
| Propanoate | 0.822 | 75.044 | Down | Down | Up | 0.045 |
| Lysyl-Threonine | 4.288 | 145.513 | Down | Down | Up | 0.05 |
| N-nitrosoproline | 0.90 | 145.061 | Down | Down | Up | 0.022 |
| Tetrahydrouridine | 1.077 | 249.107 | Down | Down | Up | 0.035 |
| N-acetylornithine | 1.025 | 175.107 | Down | Down | Up | 0.033 |
| Cytidine | 1.844 | 244.092 | Down | Down | Up | 0.01 |
| L-Pipecolate | 1.355 | 130.08 | Down | Down | Up | 0.071 |
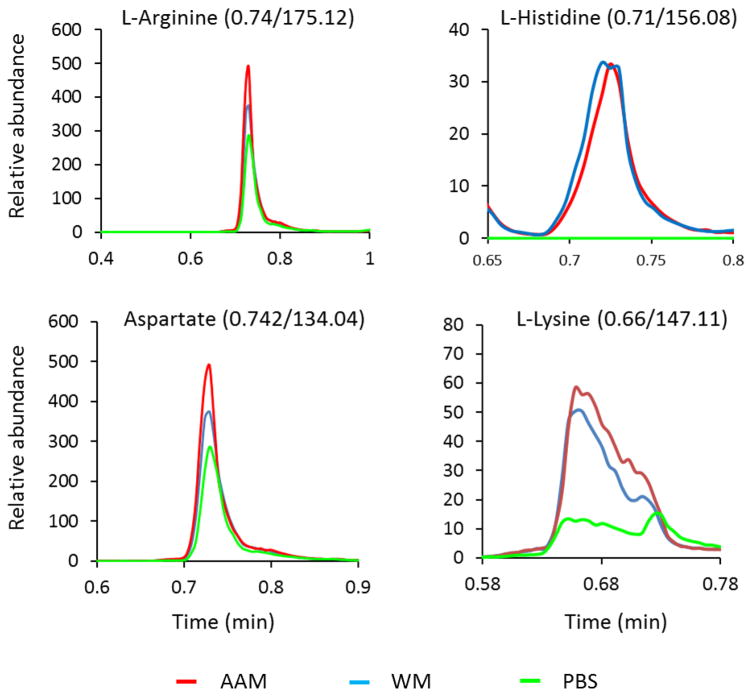
Efficient and proper metabolite extraction is a key part of metabolomics research, and can drastically impact the results of analyses looking at key metabolic changes. Using a comparative extraction strategy, we identified efficient extraction of large number of metabolites including amino acids and its derivatives (L-arginine, L-histidine, L-lysine, L-valine, L-threonine, and citrulline), nucleotides (uracil), growth hormone (zeatin), and aromatic compounds (lysl phenylalanine, D-glucosamine) by ammonium acetate methanol extraction (AAM) method over phosphate buffer methanol (PM) and water methanol (WM) methods (Table 2). It is important to note that this list of metabolites covers a wide range of chemical properties from organic acids such as pyruvate to amino sugars as in glucosamine and aromatic metabolites, thus showing the capability of AAM to extract the broad range of chemical diversity expected in plan species. It is interesting to note that all of the amino acids detected were extracted better using AAM over PM with the exception of modified amino acids N-nitrosoproline and N-acetylornithine. Further investigation of modified amino acid extraction using PM over AAM will be studies in future work. These metabolites were identified using an internal retention time library.
Some key differentially changing metabolic features in each extraction method also revealed higher similarity in the extraction of metabolic features between WM and AAM method (Fig. 6). On the other hand, consistent with TIC pattern, clustering and PCA analysis, PM extraction showed a different extraction profile than AAM and WM extraction methods, where AAM extraction was found to be more efficient than PM extraction even from WM extraction regarding differential metabolic features (Fig. 6 and Table 2). Overall, this analysis further confirmed AAM extraction strategy can be potentially apply in the plant metabolite profiling.
Fig. 6.
Representative metabolic features among three extraction methods. Relative abundance of L-Arginine, L-Histidine, Aspartate, and L-Lysine are shown. AAM (ammonium acetate methanol) method showed efficient extraction of metabolites versus PM (phosphate buffer methanol) and WM (water methanol) methods.
CONCLUSION
Increasing interest in plant metabolomics requires a straightforward and highly efficient metabolite extraction strategy. Therefore, in this study we reported a comparative metabolite extraction strategy for developing a reliable method for LC/MS based plant metabolomics. For identifying an efficient extraction approach, different aspects including total ion chromatography comparison, molecular features, peak intensities, hierarchical clustering analysis, principal component analysis, and differential expression analysis were conducted. Based on all the analysis, AAM (ammonium acetate with methanol extraction method) proved to be a more efficient metabolite extraction method in soy leaf tissues when compared with PM method. The AAM extraction method is inexpensive and quick to perform, does not require any kits. This particular study will be useful for applying as well as expanding LC/MS based plant metabolomics studies.
Acknowledgments
This research is supported by the Southeast Center for Integrated Metabolomics (SECIM) NIH grant #U24-DK097209.
Footnotes
Compliance with Ethical Standards.
The authors have no conflict of interests related to this work.
References
- 1.Villas-Boas SG, Mas S, Åkesson M, Smedsgaard J, Nielsen J. Mass spectrometry in metabolome analysis. Mass Spectrometry Reviews. 2005;24(5) doi: 10.1002/mas.20032. [DOI] [PubMed] [Google Scholar]
- 2.Hao J, Liebeke M, Astle W, Iorio MD, Bundy JG, Ebbels TMD. Bayesian deconvolution and quantification of metabolites in complex 1D NMR spectra using BATMAN. Nature protocols. 2014;9(6):1416–27. doi: 10.1038/nprot.2014.090. [DOI] [PubMed] [Google Scholar]
- 3.Theodoridis G, Gika H, Franceschi P, Caputi L, Arapitsas P, Scholz M, et al. LC-MS based global metabolite profiling of grapes: solvent extraction protocol optimization. Metabolomics. 2012;8:175–85. [Google Scholar]
- 4.Heijne WH, Lamers RJ, van Bladeren PJ, Groten JP, van Nesselrooij JH, van Ommen B. Profiles of metabolites and gene expression in rats with chemically induced hepatic necrosis. Toxicol Pathol. 2005;33:425–33. doi: 10.1080/01926230590958146. [DOI] [PubMed] [Google Scholar]
- 5.Want E, Wilson I, Gika H, Theodoridis G, Plumb R, Shockcor J. Global metabolic profiling procedures for urine using UPLC-MS. Nature Protocols. 2010;5:1005–18. doi: 10.1038/nprot.2010.50. [DOI] [PubMed] [Google Scholar]
- 6.Bruce SJ, Tavazzi I, Parisod V, Rezzi S, Kochhar S, Guy PA. Investigation of human blood plasma sample preparation for performing metabolomics using ultrahigh performance liquid chromatographny/mass spectrometry. Analytical Chemistry. 2009;81:3285–96. doi: 10.1021/ac8024569. [DOI] [PubMed] [Google Scholar]
- 7.Moritz T, Johansson A. Plant metabolomics. In: Griffiths W, editor. Metabolomics, metabonomics and metabolite profiling. Cambridge: RSC Publishing; 2007. [Google Scholar]
- 8.Kim H, Verpoorte R. Sample preparation for plant metabolomics. Phytochemical Analysis. 2010;21:4–13. doi: 10.1002/pca.1188. [DOI] [PubMed] [Google Scholar]
- 9.Kim H, Choi Y, Verpoorte R. NMR-based metabolomics analysis of plants. Nature protocol. 2010;5:536–49. doi: 10.1038/nprot.2009.237. [DOI] [PubMed] [Google Scholar]
- 10.Kaiser KA, Barding GA, Larive CK. A comparison of metabolite extraction strategies for 1H-NMR-based metabolic profiling using mature leaf tissue from the model plant Arabidopsis thaliana. Magnetic Resonance in Chemistry. 2009;47:147–56. doi: 10.1002/mrc.2457. [DOI] [PubMed] [Google Scholar]
- 11.DeVos RC, Moco S, Lommen A, Keurentjes JJ, Bino RJ, Hall RD. Untargeted large-scale plant metabolomics using liquid chromatography coupled to mass spectrometry. Nature Protocols. 2007;2:778–91. doi: 10.1038/nprot.2007.95. [DOI] [PubMed] [Google Scholar]
- 12.Gullberg J, Jonsson P, Nordstrom A, Sjostrom M, Moritz T. Design of experiments: An efficient strategy to identify factors influencing extraction and derivatization of Arabidopsis thaliana samples in metabolomic studies with gas chromatography/mass spectrometry. Analytical Biochemistry. 2004;331:283–95. doi: 10.1016/j.ab.2004.04.037. [DOI] [PubMed] [Google Scholar]
- 13.Leinonen A, Kuuranne T, Kostiainen R. Liquid chromatography/mass spectrometry in anabolic steroid analysis— optimization and comparison of three ionization techniques: electrospray ionization, atmospheric pressure chemical ionization and atmospheric pressure photoionization. J Mass Spectrom. 2002;37:693–8. doi: 10.1002/jms.328. [DOI] [PubMed] [Google Scholar]
- 14.Holman JD, Tabb DL, Mallick P. Employing ProteoWizard to Convert Raw Mass Spectrometry Data. Curr Protoc Bioinformatics. 2014;46:13.24.1–13.24.9. doi: 10.1002/0471250953.bi1324s46. [DOI] [PMC free article] [PubMed] [Google Scholar]
- 15.Pluskal T, Castillo S, Villar-Briones A, Orešič M. MZmine 2: Modular framework for processing, visualizing, and analyzing mass spectrometry based molecular profile data. BMC Bioinformatics. 2010;11:395. doi: 10.1186/1471-2105-11-395. [DOI] [PMC free article] [PubMed] [Google Scholar]
- 16.Xia J, Mandal R, Sinelnikov IV, Broadhurst D, Wishart DS. MetaboAnalyst 2.0--a comprehensive server for metabolomic data analysis. Nucleic Acids Res. 2012;40:W127–33. doi: 10.1093/nar/gks374. [DOI] [PMC free article] [PubMed] [Google Scholar]
- 17.Goodpaster AM, Kennedy MA. Quantification and statistical significance analysis of group separation in NMR-based metabonomics studies. Chemometrics and Intelligent Laboratory Systems. 2011;109:162–70. doi: 10.1016/j.chemolab.2011.08.009. [DOI] [PMC free article] [PubMed] [Google Scholar]
- 18.Sheikh KD, Khanna S, Byers SW, Fornace A, Cheema AK. Small Molecule Metabolite Extraction Strategy for Improving LC/MS Detection of Cancer Cell Metabolome. J Biomol Tech. 2011;22(1):1–4. [PMC free article] [PubMed] [Google Scholar]
- 19.Abdel-Farid IB, Jahangir M, van den Hondel CAMJJ, Kim HK, Choi YH, Verpoorte R. Fungal infection-induced metabolites in Brassica rapa cultivars. Plant Science. 2009;176:608–15. [Google Scholar]
- 20.SeungOk Y, SoHyun K, YuJin K, HeeSu K, YoungJin C, HyungKyoon C. Metabolic descrimination of Catharanthus roseus calli according to their relative locations using 1H NMR and principal component analysis. Biosci Biotechnol Biochem. 2009;73(9):2032–6. doi: 10.1271/bbb.90240. [DOI] [PubMed] [Google Scholar]
- 21.Mahmud I, Kousik CS, Hassell R, Chowdhury K, Boroujerdi A. NMR Spectroscopy Identifies Metabolites Translocated from Powdery Mildew Resistant Rootstocks to Susceptible Watermelon Scions. J Agric Food Chem. 2015;63(36):8083–91. doi: 10.1021/acs.jafc.5b02108. [DOI] [PubMed] [Google Scholar]


