Abstract
High tissue pressures prevent chemotherapeutics from reaching the parenchyma of pancreatic ductal adenocarcinoma, which makes it difficult to treat this aggressive disease. Researchers currently use invasive probes to monitor the effectiveness of pressure-reducing therapies, but this practice introduces additional complications. Here, we hypothesize that Young’s modulus is a good surrogate for tissue pressure because collagen density and hyaluoronic acid, the key features of the tumor microenvironment responsible for high tissue pressures, also affect modulus elastograms. To corroborate this hypothesis, we used model-based quasi-static elastography to assess how the Young’s modulus of naturally occurring AsPc-1 pancreatic tumors varies with collagen density and hyaluoronic acid concentration. We observed that Young’s moduli of orthotopically grown xenograft tumors were 6 kPa (p < 0.05) higher than that of their subcutaneously grown counterparts. We also observed a strong correlation between Young’s modulus and regions within the tumors with high collagen (R2 ≈ 0.8) and hyaluoronic acid (R2 ≈ 0.6) densities. These preliminary results indicate that hyaluronic acid and collagen density, features of the pancreatic ductal adenocarcinoma tumor microenvironment responsible for high tissue pressure, influence Young’s modulus.
Keywords: Tumor microenvironment, Model-based elastography, Pancreatic ductal adenocarcinoma, Total tissue pressure
INTRODUCTION
Several factors contribute to the poor prognosis of pancreatic cancer, but late diagnosis is the most significant (Fass 2008; Miles 1999). Pancreatic ductal adenocarcinoma (PDA) has a 5-year survival rate of less than 6% (Gore and Korc 2014). The advanced stage of the disease, often metastasized to distant organs when first diagnosed, is responsible for this dismal prognosis. Contrast-based imaging techniques such as magnetic resonance imaging and X-ray computed tomography can visualize structured tumors (Fass 2008), but PDA is avascular (Miles 1999), which reduces the delivery of contrast agent to the tumor, thus degrading diagnostic efficacy.
Elastography (Doyley and Parker 2014; Maleke and Konofagou 2008; McAleavey et al. 2007; Nightingale et al. 2002; Urban et al. 2006) can improve the differential diagnosis of pancreatic tumors and lymph nodes. Clinicians routinely use endoscopic ultrasound (EUS) to guide fine-needle aspiration and biopsy (Chantarojanasiri et al. 2016; Wangermez 2016). However, EUS-guided biopsy is difficult, often requiring multiple punctures to obtain a sufficient number of tissue samples. Several researchers have reported that endoscopic ultrasound elastography can differentiate benign from malignant pancreatic tumors and lymph nodes with high accuracy (Cui et al. 2015; Iglesias-Garcia et al. 2017). Despite these encouraging results, endoscopic ultrasound elastography is invasive and currently only available on one commercially available system, Hitachi’s EUB-8500 system. To overcome these issues, Chen et al. (2015) determined that non-invasive elastographic techniques like harmonic motion imaging could also improve the differential diagnosis of pancreatic cancer.
Pancreatic ductal adenocarcinoma is hard to eradicate because high tissue pressures prevent chemotherapeutics from reaching the tumor parenchyma (Boucher et al. 1991, 1997; Less et al. 1992; Roh et al. 1991). Radical surgical resection is the current cure for PDA, but only 15% to 20% of patients have resectable disease (Yendluri et al. 2007). Neo-adjuvant therapies can help patients with borderline resectable tumors qualify for surgery, but high tissue pressure (Chu et al. 2007; Jain 1998, 2011; Vakoc et al. 2009) impedes drug delivery, which produces hypoxia that encourages tumor progression and reduces the efficacy of radiotherapy and chemotherapy. To solve this problem, researchers have developed targeted therapies to degrade either stromal density (Olive et al. 2009) or hyaluronic acid (Cowell et al. 2015; Dychter et al. 2011; Hingorani et al. 2015), features of the tumor microenvironment responsible for high tissue pressures (Chauhan et al. 2014; Provenzano et al. 2012).
In this study, we hypothesized that model-based quasi-static elastography can provide a good surrogate for tissue pressure. No imaging modality can measure tissue pressure directly. Consequently, clinical researchers frequently use probes to measure tissue pressure (Boucher et al. 1997; Griffon-Etienne et al. 1997; Gutmann et al. 1992; Jain and Baxter 1988; Stylianopoulos et al. 2012). Specifically, researchers have used probes to assess how tissue pressure affects patient survival (Curti et al. 1993). However, pressure probes are invasive, which introduces additional complications and errors. The pressure gradient at PDA tumor margins (Jain 1987) increases Young’s modulus (Swartz and Lund 2012). Consequently, we hypothesized that Young’s modulus measured with quantitative elastographic imaging methods, such as model-based quasi-static elastography and shear wave imaging, is a good surrogate for tissue pressure. To confirm this hypothesis, we performed studies on human-derived AsPc-1 tumors, among the hardest to treat clinically. Specifically, we conducted studies on immunocompromised mice and rats to assess (i) the correlation between tissue stiffness and interstitial pressure, (ii) whether there is a significant difference in Young’s modulus between orthotopically and subcutaneously grown xenograft tumors and (iii) how tissue stiffness varies with stromal density and hyaluronic acid content, features of the tumor microenvironment responsible for high tissue pressures.
METHODS
In this section, we describe the tumor model, pressure measurement procedure, elastographic imaging protocol, histological analysis and statistical analysis performed on the acquired data.
Tumor model
We conducted experiments on AsPc-1 xenograft tumors. We grew tumors by injecting 1 × 10⁶ tumor cells in Matrigel (BD Biosciences, San Jose, CA, USA), and 50% media, either subcutaneously into the right flank or orthotopically into the pancreas. We allowed all tumors to grow until they reached 125–175 mm3 in size. All animal studies were performed using protocols approved by the institutional animal care and use committees of the University of Rochester and Dartmouth College.
Pressure measurements
We used a Mikro-Tip piezo-electric pressure catheter (Model SPR-671, Millar, Houston, TX, USA; 0.47-mm diameter, dynamic pressure range from −50 to 300 mm Hg and nominal sensitivity of 5μV/mm Hg) to measure the total pressure within the tumors. A LabPro data acquisition unit (Vernier Software and Technology, Beaverton, OR, USA) digitized all pressure data to 8 bits at a sampling rate of 60 samples per minute.
Histological analysis
To facilitate quasi-static elastographic imaging, we removed the tumors from the animals and embedded them in gelatin (see the next subsection). After imaging, we removed the excised tumors from the gelatin block and snap-froze them for later Masson trichrome and hyaluronan (Jacobetz et al. 2013) staining. All samples were sectioned into 5-μm-thick slices, taken at 100-μm intervals. The stained tissues were digitally captured with a Vectra 3 slide scanner (Perkin Elmer, Waltham, MA, USA). We used a two-step process to generate collagen and hyaluronic acid maps. First, we transformed the digitized histological images from red, green and blue (RGB) to hue, saturation and value (HSV) color space. Second, we used a global thresholding algorithm to segment the transformed images: blue for collagen and brown for hyaluronic acid. We performed all quantitative histological analyses in a MATLAB (The MathWorks, Natick, MA, USA) programming environment.
Elastographic imaging
Tumor encasement
All tumors were surgically removed and encased in a 57 × 25 × 42-mm (width × height × thickness) gelatin block as described in Doyley et al. (1999). We manufactured the gelatin block from a suspension consisting of 15% by weight porcine skin gelatin (300 bloom, Type A, Sigma-Aldrich, St. Louis, MO, USA), 2% by weight corn-starch (Spectrum Pharmaceuticals, Henderson, NV, USA) and 18 MΩ high-purity water.
Data acquisition
We used the experimental setup illustrated in Figure 1 to acquire elastographic images. This system consisted of a SonixTouch ultrasound scanner (BK Ultrasound, Peabody, MA, USA), a L40-8/12 probe (BK Ultrasound) and a computer-controlled mechanical compression system. All echo imaging was performed at 10 MHz; the resulting radiofrequency (RF) echo data were digitized to 10 bits at a sampling rate of 40 MHz. During elastographic imaging, the encapsulated samples were deformed at a strain rate of 2%/s. For each sample, we used a permanent marker to highlight the elastographic scan plane, which we used to produce co-registered elastographic and histological images.
Fig. 1.
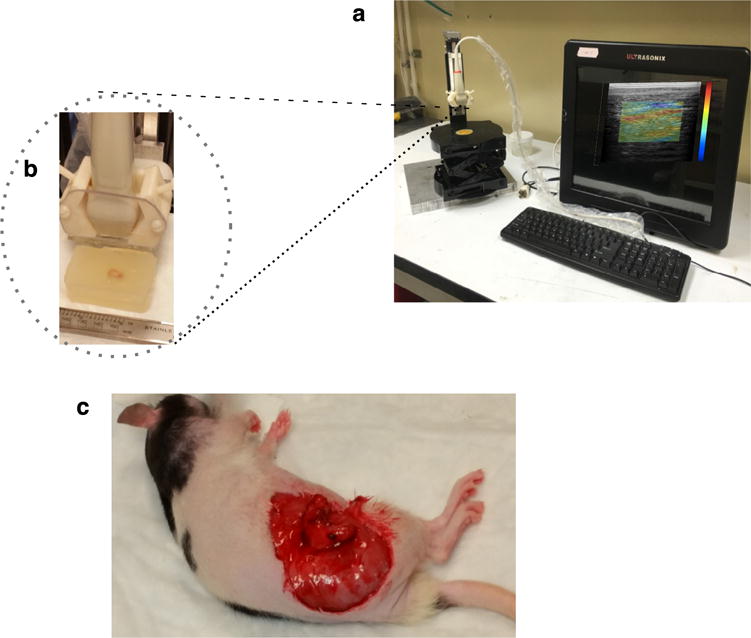
(a) Photograph of experimental elastographic imaging system, consisting of a Sonixtouch tablet ultrasound scanner (BK Ultrasound, Peabody, MA, USA) equipped with a L40-8/12 probe (BK Ultrasound, Peabody) and a computer-controlled mechanical compression system. (b) Close-up of the transducer and excised xenograft tumor embedded in gelatin. (c) Rat with exposed orthotopically grown tumor.
Modulus estimation
Applying the 2-D echo tracking method described in Doyley et al. (2001) to pre- and post-deformed RF echo frames provided lateral and axial displacement estimates. We used 1 × 1-mm kernels that overlapped by 90% and 50% in the axial and lateral directions, respectively, for echo tracking. Ten displacement elastograms were obtained from each tumor, which we averaged to produce a single displacement elastogram. We interpolated the resulting displacement elastograms onto a uniform finite-element grid consisting of 6000 nodes and 30,000 elements. We computed absolute modulus elastograms by applying our iterative inversion scheme (Doyley et al. 2004) to the interpolated displacements. We assumed a homogeneous distribution of 14.5 kPa (the Young’s modulus of the surrounding gel, measured with a hydraulic mechanical analyzer as described in Richards and Doyley [2011]) at the start of all reconstructions, which we terminated when successive updates were negligible:
Here, J is the Jacobean matrix, E is Young’s modulus, Uc is displacements computed using the finite-element method, Um is the measured displacement, and T is the transpose, which typically occurred between 10 and 20 iterations.
Statistical analysis
To determine if the stiffness calculated from the two groups of animals were statistically different, we used the mean Young’s modulus recovered from each animal to perform a paired Student t-test.
RESULTS
Hyaluronic acid affects tissue stiffness
We fabricated three phantoms, each containing a 4-mm3 inclusion, to assess how hyaluronic acid (HA) influences tissue stiffness. We fabricated cross-linked HA inclusions from a suspension consisting of 3.9% by weight sodium hyaluronate (Sigma-Aldrich), 94.2% sodium hydroxide (0.2 M, Sigma-Aldrich), 0.8% divinyl sulfone (Sigma-Aldrich) and 1% corn starch (Spectrum Pharmaceuticals, Henderson, NV, USA). We varied the concentration of gelatin used to manufacture the surrounding gel from 10% to 20% by weight (see Fig. 2a) and soaked each phantom in phosphate-buffered saline (PBS, pH 7.4, Sigma-Aldrich) for 72 h. To encourage the flow of PBS to the inclusion, we inserted six needles in each HA inclusion as illustrated in Figure 2b. In Figure 2c are examples of elastograms calculated at two different time points, 0 and 72 h, for HA inclusions that we embedded in 11.65-and 24.45-kPa gel. Figure 2d is the corresponding scatterplot of the total pressure (measured) within the HA inclusion and the calculated Young’s modulus. Tissue pressure (interstitial fluid pressure and solid stress) and tissue stiffness were correlated (R2 = 0.76) because HA expands as it absorbs water, which increases the pressure within the inclusion and increases tissue stiffness (Provenzano and Hingorani 2013). We used the phantom that we manufactured with the softest surrounding gel (11.65 kPa) to assess the correlation between total pressure and calculated stiffness, because inserting the probe in the stiffer phantom would damage it. However, we expect the trend would still hold for the stiffer phantoms. Figure 2e is a bar plot of the stiffness calculated from all inclusions at each time point. For all phantoms, the inclusion’s stiffness increased with time, but the rate of increase in stiffness depended on the stiffness of the surrounding gel.
Fig. 2.
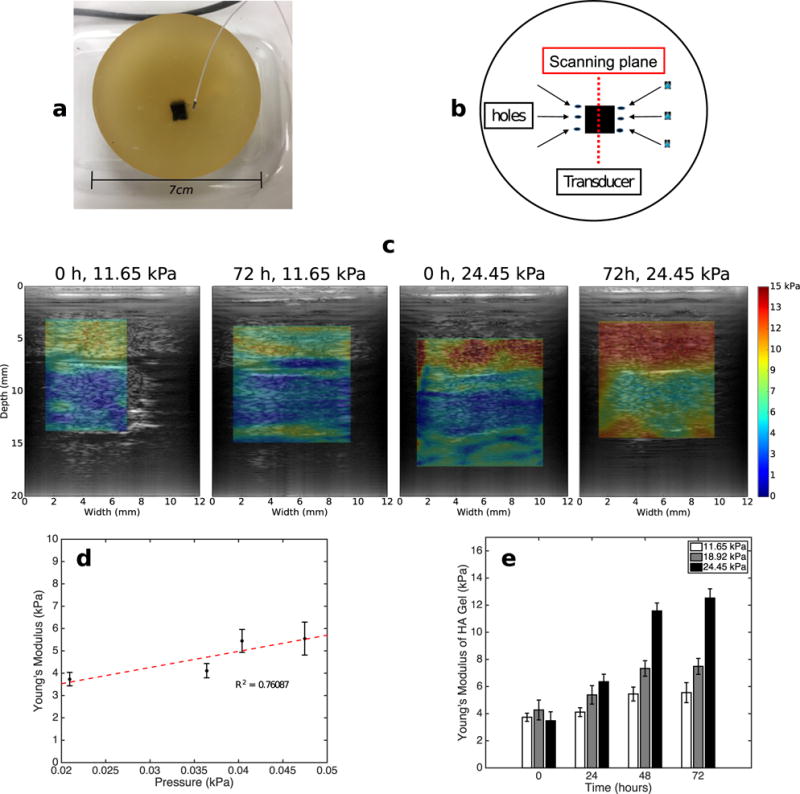
(a) Phantom containing cross-linked hyaluronic acid (HA) inclusion embedded in gelatin. We used the probe illustrated in (a) to measure interstitial fluid pressure in the HA inclusion. (b) Schematics of the phantom, ultrasound transducer and hole used to increase permeability. (c) Modulus elastograms obtained from phantoms that we submerged in phosphate-buffered saline for 0 and 72 h. The Young’s moduli of the gel surrounding the phantoms were 11.65 and 24.45 kPa. (d) Young’s modulus versus pressure within the HA inclusion that we embedded in a gel with Young’s modulus of 11.65 kPa. (e) Bar plot of Young’s moduli of the HA gels for the 11.65-, 18.92- and 24.45-kPa phantoms as a function of time.
Orthotopically grown tumors are stiffer than subcutaneously grown tumors
In pre-clinical research, orthotopically grown tumors are more clinically relevant than their subcutaneous counterpart (Morton and Houghton 2007). However, to simulate tumors with different collagen densities and HA content, we grew AsPc-1 tumors orthotopically and subcutaneously in nude rats (n = 12). In Figures 3 and 4 are representative examples of sonographic, elastographic and histologic (Masson’s trichrome and HA staining) images obtained from orthotopically and subcutaneously grown tumors, respectively. Young’s modulus was heterogeneously distributed within both groups of tumors. Collagen and HA were also irregularly distributed within the tumors, which suggests that this was responsible for the heterogeneity observed in the modulus elastogram. Figure 5a–d are representative examples of collagen (a, b) and HA (c, d) within subcutaneously and orthotopically grown tumors. In general, orthotopically grown tumors had higher collagen and HA densities than their subcutaneously grown counterparts. In Figure 5e are boxplots of the mean Young’s modulus calculated from the two groups of tumors (each group contained 10 tumors). The Young’s moduli of orthotopically grown tumors were 6 kPa higher than those of their subcutaneously grown counterparts. Statistical analysis revealed that this result was significant (p < 0.05).
Fig. 3.
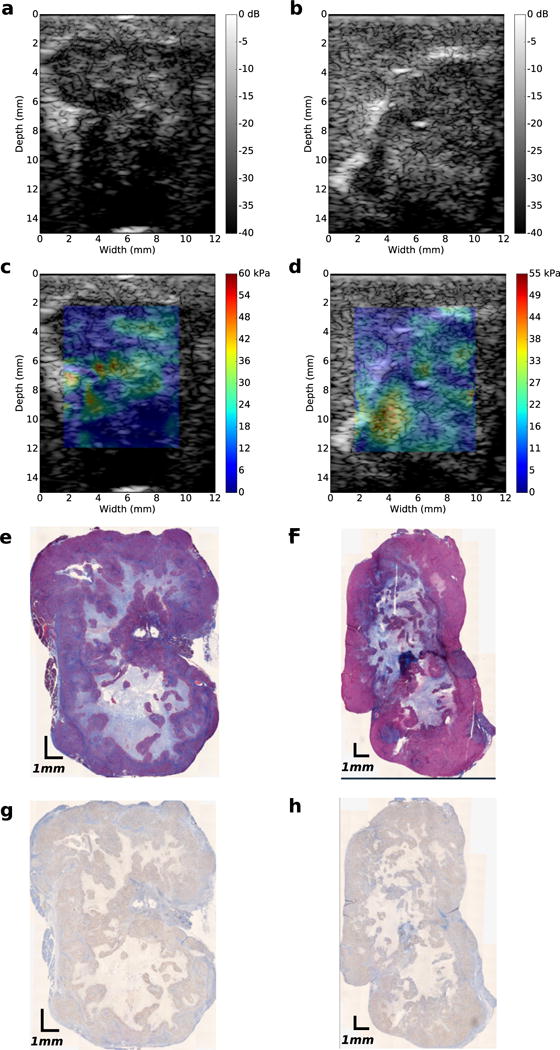
Images obtained from two orthotopically grownAsPc-1 tumors. (a, b) Ultrasound B-mode images. (c, d)Young’s modulus elastograms. (e, f) Masson’s trichrome-stained histologic images, (g, h) Hyaluronic acid-stained images.
Fig. 4.
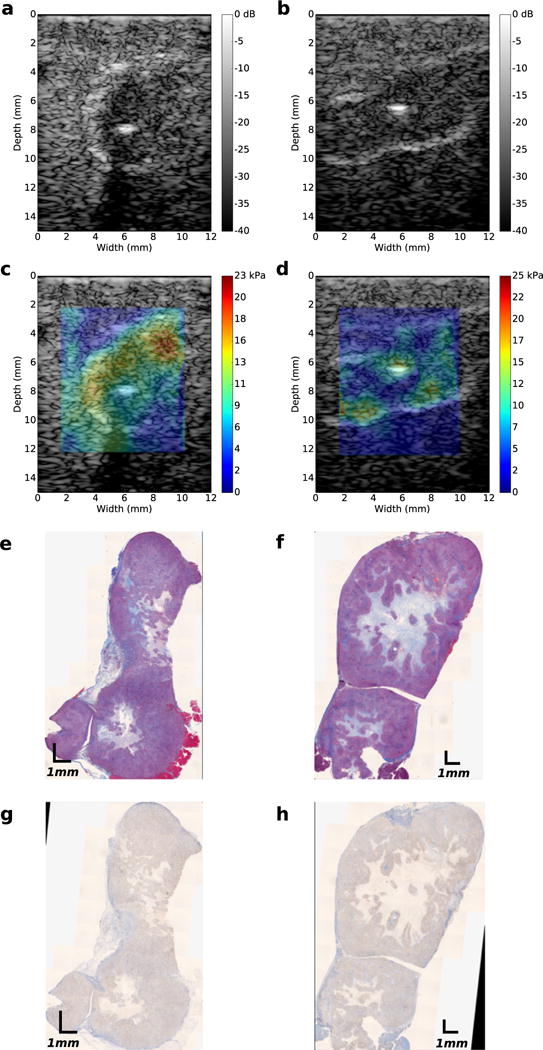
Images obtained from two subcutaneously grownAsPc-1 tumors. (a, b) Ultrasound B-mode images. (c, d)Young’s modulus elastograms. (e, f) Masson’s trichrome-stained histologic images. (g, h) Hyaluronic acid histologic images.
Fig. 5.
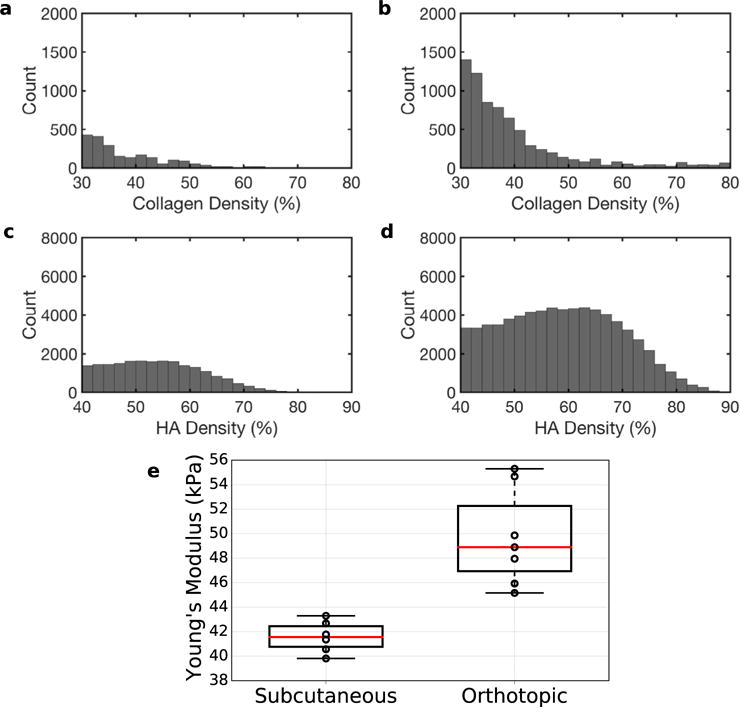
Histograms of collagen density (a, b) and hyaluronic acid (HA) density (c, d) of subcutaneously (a, c) and orthotopically (b, d) grown tumors. (e) Boxplot of mean Young’s modulus (in kPa) of subcutaneous and orthotopic tumors.
Young’s modulus correlates with both hyaluronic acid content and collagen density
To understand how Young’s modulus varies with collagen density and hyaluronic acid, we registered the elastographic and histologic images as illustrated in Figure 6. Once these were registered, we selected areas of high-, medium- and low-level collagen density or hyaluronic acid content from the spatially aligned histologic images. Figure 7a is a scatterplot of collagen density and Young’s modulus calculated for xenograft tumors, which we implanted in mice (n = 13) and rats (n = 15). To construct this plot, we selected areas of high, medium and low collagen density from the collagen maps. Then we computed the mean Young’s modulus from the corresponding region in the modulus elastograms. We observed good correlation between collagen density and Young’s modulus (R2 = 0.62–0.84); however, collagen density was higher in mice than in rats. Figure 7b is the corresponding scatterplot of hyaluronic acid concentration and Young’s modulus. In this figure, we used the collagen selected region of interest in Figure 7a to guide the choice of the areas in the HA maps. Young’s modulus and hyaluronic acid concentration were weakly correlated (R2 = 0.01–0.1). Figure 7c is the scatterplot of HA and Young’s modulus. In this figure, we used the HA maps to select areas of high, medium and low HA densities. Doing this produced a stronger correlation between HA and modulus (R2 = 0.5). Figure 7d is a scatterplot of collagen and Young’s modulus in cases where HA maps were used to guide the selection of regions in the collagen map. We observed a noticeably weaker correlation between collagen and Young’s modulus (R2 = 0.05–0.25). This suggests that in AsPc-1 tumors, regions of high collagen density do not necessarily coincide with regions of high HA content, and vice versa.
Fig. 6.
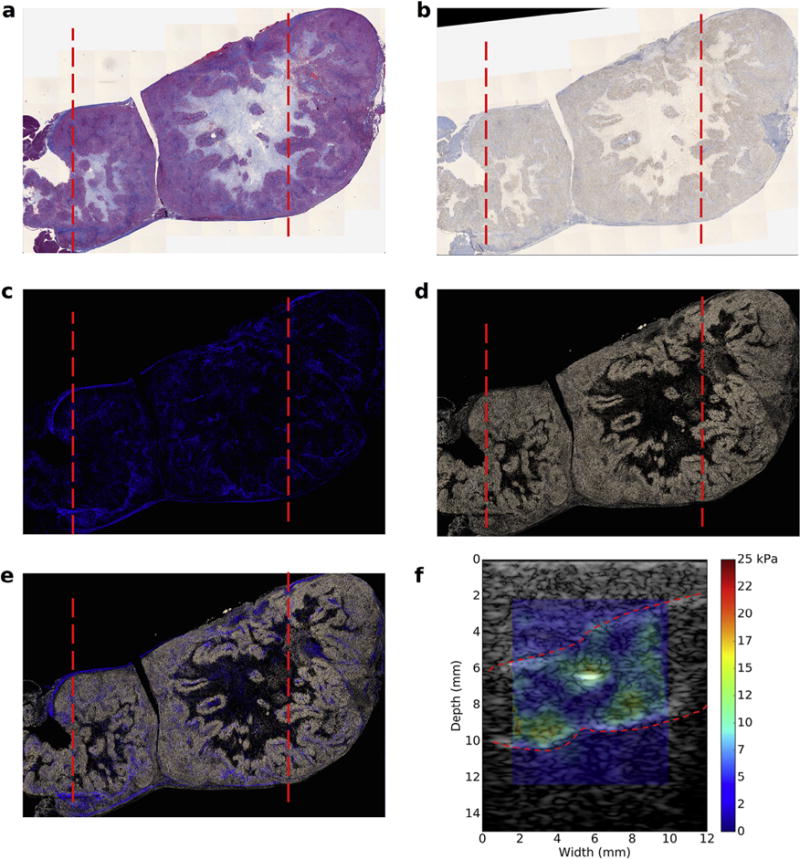
Co-registered histological images and modulus elastogram obtained from a subcutaneous tumor. The dotted red lines in (a) to (e) indicate the boundary of ultrasound scans. (a) Masson’s trichrome-stained histological image. (b) Hyaluronic acid (HA)-stained histological image. (c) Collagen density map. (d) HA density map. (e) Composite image of collagen and HA density maps. (f) Overlay of modulus elastogram and sonogram; red lines demarcate the tumor edge.
Fig. 7.
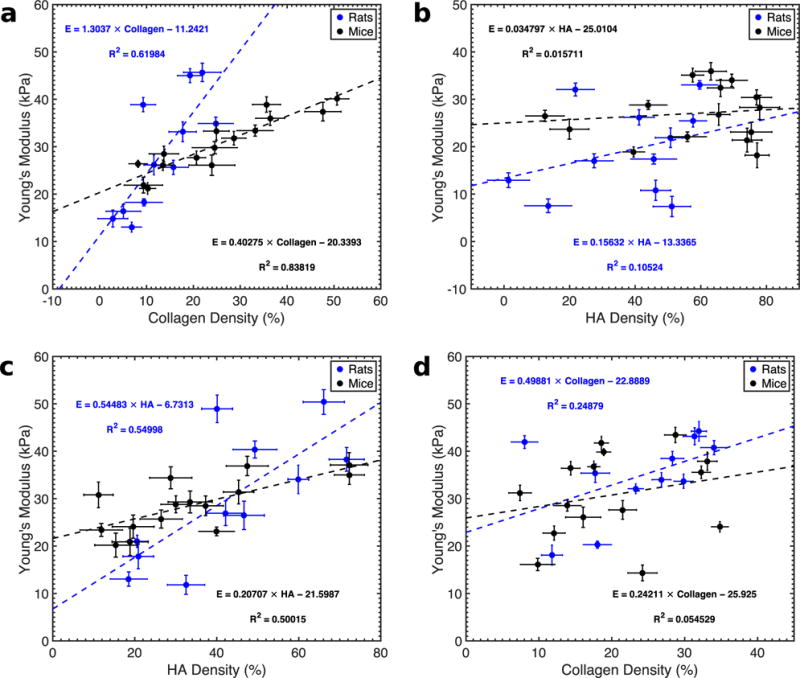
Quantitative analysis of collagen distribution, hyaluronic acid distribution and Young’s modulus distribution of AsPc-1 tumors. (a) Collagen density versus Young’s modulus for rat (blue) and mouse tumors (black) obtained from regions of interests (ROIs) where collagen density were high, medium and low. (b) Young’s modulus versus hyaluronic acid (HA) density obtained from the same ROIs as in (a). (c) Young’s modulus versus HA density corresponding to regions of high, medium and low HA densities. (d) Young’s modulus as a function of collagen density using the same ROIs as in (c).
Interstitial pressure correlates with collagen density
To verify the results illustrated in Figure 7a, we measured the pressure in 10 independent locations in orthotopically grown rat tumors (n = 24). Figure 8a is a representative example of the pressure measured at three different locations, revealing that total tissue pressure (the sum of solid stress and interstitial fluid pressure) varied spatially. Figure 8b is a scatterplot of the mean collagen density and the mean total tissue pressure. The high variability in pressure and collagen density was due to the heterogeneous nature of the tumors. Nevertheless, like Young’s modulus (Fig. 7), there was a strong correlation between total tissue pressure and collagen density.
Fig. 8.
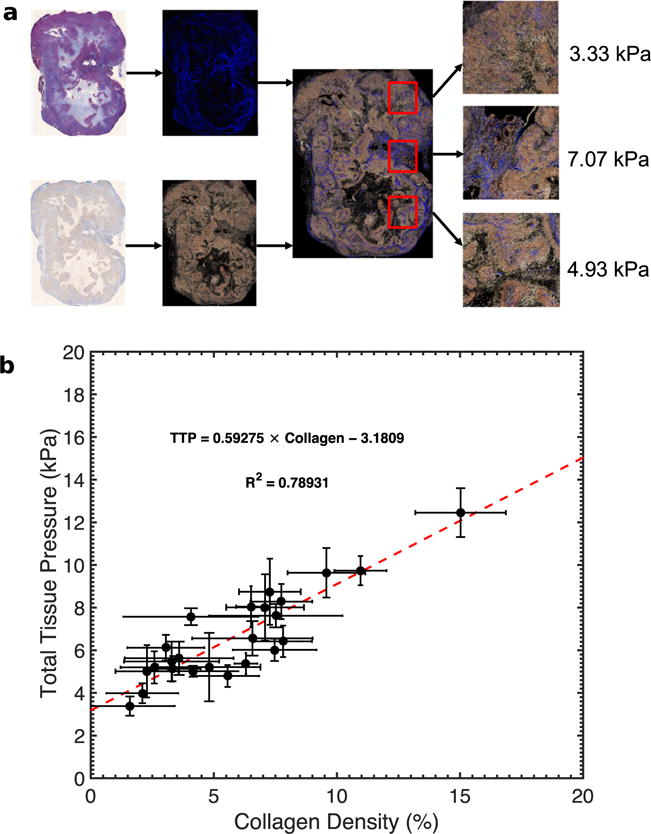
(a) Total tissue pressure within an orthotopic tumor measured at regions with different collagen (blue stains) distributions. (b) Scatterplot of tissue pressure versus collagen density within AsPc-1 tumors (n = 24). We calculated the mean pressure from 10 statistically independent points within each tumor.
DISCUSSION
In this study, we assessed how tissue pressure, stromal density and hyaluronic acid concentration influenced the Young’s modulus distribution within AsPc-1 xenograft tumors. We observed a strong correlation between interstitial fluid pressure and Young’s modulus (Fig. 2). Young’s modulus (Figs. 3 and 4) was heterogeneously distributed within AsPc-1 tumors. Orthotopically grown tumors were stiffer than those grown subcutaneously (Fig. 5). For both groups of tumor, Young’s modulus increased with increasing collagen density and hyaluronic acid concentration (Fig. 7). However, regions of high collagen density and high HA concentration did not coincide. Collagen density and interstitial tissue pressure were correlated (Fig. 8).
Although the model-based elastographic imaging approach employed in this study cannot shed light on the origin of high interstitial tissue pressure, it could provide information related to the effectiveness of different pressure-lowering therapies. There is considerable debate in the cancer research community over why most tumors, including PDA, have high tissue pressure. Chauhan et al. (2014) argue that solid stress is responsible for the abnormally high tissue pressures, whereas Provenzano et al. (2012) contend that elevated interstitial fluid pressure is to blame. Our model-based elastographic imaging cannot differentiate between stiffness increases caused by solid stress and those caused by interstitial fluid pressure. Therefore, in future studies, we plan to use a poroelastic (Berry et al. 2006; Konofagou et al. 2001; Righetti et al. 2007) or biphasic (Leiderman et al. 2006) mechanical model as the computational basis for computing Young’s modulus (Perriez et al. 2010), which would allow us to overcome this limitation. Nevertheless, because the goal of targeted therapy is to reduce tissue pressure, researchers could use model-based elastography to evaluate the efficacy of different therapeutic regimes within the clinical setting.
Collagen and other elements of a tumor microenvironment govern its mechanical properties; therefore, to interpret elastographic images correctly, we must understand how different components affect different mechanical parameters (Insana et al. 2004). The abnormal desmoplastic response displayed by most pancreatic cancers, including AsPC-1, cause them to have high collagen density. Figure 7a illustrates that Young’s modulus is dependent on collagen density. Figure 5e reveals that tumors with higher collagen density are stiffer than those with lower collagen density. This observation is consistent with previously reported research obtained with invasive measurement techniques (Manssor et al. 2016; Seifert et al. 2014). However, to our knowledge, this is the first reported study that used imaging to demonstrate that orthotopically grown tumors are stiffer than subcutaneously grown tumors because of differences in collagen density. More specifically, that imaging can produce results on par with invasive measurement techniques. Although elastography can detect differences in collagen density, collagen alone does not provide the full picture. Figure 2c illustrates that (i) as HA absorbs water and swells, it increases tissue stiffness; and (ii) the pressure within the HA-encapsulated region does not depend solely on the amount of water, but also on the stiffness of the surrounding tissues. Therefore, knowledge of how collagen and HA are spatially distributed within the tumor is also important. Without histological insights, it is difficult to know if the Young’s modulus distribution observed in Figures 3 and 4 is real (Marusyk and Polyak 2010). By registering histological and elastographic images, we illustrated in Figure 7 that the spatial variation in Young’s modulus was due to variations in collagen and HA densities.
This study has four main limitations. First, we evaluated only one pancreatic cancer cell line. Second, because AsPc-1 tumors are heterogeneous (Bernhaus et al. 2009; Tan and Chu 1984), simple histology may not provide an accurate assessment of the amounts of collagen and hyaluronic acid within the tumors. To address this limitation, we plan to use a soluble assay to quantify the collagen and hyaluronic acid content more accurately (Barnes et al. 2009; Krupa et al. 2007; Nagelschmidt and Viell 1987). Third, we performed all measurements with ex vivo samples; therefore, we could not assess the effects of blood pressure on Young’s modulus. In future studies, we plan to perform all measurements in vivo using shear wave imaging.
Fourth, boundary conditions will influence the estimated Young’s modulus (Rotemberg et al. 2011). Because most soft tissues exhibit non-linear elastic behavior, we expect the estimated Young’s modulus will increase non-linearly with increasing tissue pressure. The assumption made when computing Young’s modulus is responsible for this behavior—tissues exhibit linear rather than nonlinear mechanical behavior; therefore, we will perform additional studies using independent mechanical testing to assess the degree of non-linearity exhibited by the pancreas and include an appropriate non-linear forward method in our image reconstruction process.
CONCLUSIONS
We determined that collagen and hyaluoronic acid, the key elements responsible for the high tissue pressures observed in pancreatic adenocarcinoma, influence modulus elastograms. Therefore, quantitative elastography could enable clinical researchers to monitor the effectiveness of pressure-reducing therapies in real time, a crucial step toward solving the drug delivery problem and improving the prognosis of this aggressive disease.
Acknowledgments
This work was funded by National Institutes of Health Grant P01CA084203.
References
- Barnes S, Young P, Miga M. A novel model-gel-tissue assay analysis for comparing tumor elastic properties to collagen content. Biomech Model Mechanobiol. 2009;8:337–343. doi: 10.1007/s10237-009-0150-9. [DOI] [PubMed] [Google Scholar]
- Bernhaus A, Ozsvar-Kozma M, Saiko P, Jaschke M, Lackner A, Grusch M, Horvath Z, Madlener S, Krupitza G, Handler N, Erker T, Jaeger W, Fritzer-Szekeres M, Szekeres T. Antitumor effects of KITC, a new resveratrol derivative, in aspc-1 and bxpc-3 human pancreatic carcinoma cells. Invest New Drugs. 2009;27:393–401. doi: 10.1007/s10637-008-9183-7. [DOI] [PubMed] [Google Scholar]
- Berry GP, Bamber JC, Armstrong CG, Miller NR, Barbone PE. Towards an acoustic model-based poroelastic imaging method: I. theoretical foundation. Ultrasound Med Biol. 2006;32:547–567. doi: 10.1016/j.ultrasmedbio.2006.01.003. [DOI] [PubMed] [Google Scholar]
- Boucher Y, Kirkwood JM, Opacic D, Desantis M, Jain RK. Interstitial hypertension in superficial metastatic melanomas in humans. Cancer Res. 1991;51:6691–6694. [PubMed] [Google Scholar]
- Boucher Y, Salehi H, Witwer B, Harsh G, Jain R. Interstitial fluid pressure in intracranial tumours in patients and in rodents. Br J Cancer. 1997;75:829–836. doi: 10.1038/bjc.1997.148. [DOI] [PMC free article] [PubMed] [Google Scholar]
- Chantarojanasiri T, Hirooka Y, Kawashima H, Ohno E, Yamamura T, Funasaka K, Nakamura M, Miyahara R, Ishigami M, Watanabe O, Nakaguro M, Shimoyama Y, Nakamura S, Goto H. Endoscopic ultrasound in the diagnosis of acinar cell carcinoma of the pancreas: Contrast-enhanced endoscopic ultrasound, endoscopic ultrasound elastography, and pathological correlation. Endosc Int Open. 2016;4:E1223–E1226. doi: 10.1055/s-0042-110096. [DOI] [PMC free article] [PubMed] [Google Scholar]
- Chauhan VP, Boucher Y, Ferrone CR, Roberge S, Martin JD, Stylianopoulos T, Bardeesy N, DePinho RA, Padera TP, Munn LL, Jain RK. Compression of pancreatic tumor blood vessels by hyaluronan is caused by solid stress and not interstitial fluid pressure. Cancer Cell. 2014;26:14–15. doi: 10.1016/j.ccr.2014.06.003. [DOI] [PMC free article] [PubMed] [Google Scholar]
- Chen H, Hou GY, Han Y, Payen T, Palermo CF, Olive KP, Konofagou EE. Harmonic motion imaging for abdominal tumor detection and high-intensity focused ultrasound ablation monitoring: An in vivo feasibility study in a transgenic mouse model of pancreatic cancer. IEEE Trans Ultrason Ferroelectr Freq Control. 2015;62:1662–1673. doi: 10.1109/TUFFC.2015.007113. [DOI] [PMC free article] [PubMed] [Google Scholar]
- Chu GC, Kimmelman AC, Hezel AF, DePinho RA. Stromal biology of pancreatic cancer. J Cell Biochem. 2007;101:887–907. doi: 10.1002/jcb.21209. [DOI] [PubMed] [Google Scholar]
- Cowell JA, Li XM, Jiang P, Zimmerman S, Symons R, Shepard HM, Maneval DC, Thompson CB. Pegph20 enhances chemotherapy in patient-derived and traditional cell-derived xenograft nsclc models. Cancer Res. 2015;75 Abstract 2547. [Google Scholar]
- Cui XW, Chang JM, Kan QC, Chiorean L, Ignee A, Dietrich CF. Endoscopic ultrasound elastography: Current status and future perspectives. World J Gastroenterol. 2015;21:13212–13224. doi: 10.3748/wjg.v21.i47.13212. [DOI] [PMC free article] [PubMed] [Google Scholar]
- Curti BD, Urba WJ, Alvord WG, Janik JE, Smith JW, II, Madara K, Longo DL. Interstitial pressure of subcutaneous nodules in melanoma and lymphoma patients: Changes during treatment. Cancer Res. 1993;53:2204–2207. [PubMed] [Google Scholar]
- Doyley MM, Bamber JC, Fuechsel F, Bush NL. A freehand elastographic imaging approach for clinical breast imaging: System development and performance evaluation. Ultrasound Med Biol. 2001;27:1347–1357. doi: 10.1016/s0301-5629(01)00429-x. [DOI] [PubMed] [Google Scholar]
- Doyley MM, Bamber JC, Rivens I, Bush NL, Haar GRT. Elastographic imaging of thermally ablated tissue in vitro. Proceedings 1999 IEEE ultrasonics symposium. 1999:1631–1634. IEEE. [Google Scholar]
- Doyley MM, Parker KJ. Elastography: General principles and clincial applications. Ultrasound Clin. 2014;9:1–11. doi: 10.1016/j.cult.2013.09.006. [DOI] [PMC free article] [PubMed] [Google Scholar]
- Doyley MM, Srinivasan S, Pendergrass S, Wu Z, Ophir J. Compartive evaluation of strain-based and model-based modulus elastography. Ultrasound Med Biol. 2004;31:787–802. doi: 10.1016/j.ultrasmedbio.2005.02.005. [DOI] [PubMed] [Google Scholar]
- Dychter S, Ramanathan R, Infante J, Rosen L, Von Hoff D, Shepard M, Jiang P, Maneval D, Selvam P, Frost G. Targeting hyaluronan in tumor stroma: Interim translational and biomarker evaluations of pegylated hyaluronidase (pegph20) in animal models and patients with advanced solid tumors. Eur J Cancer. 2011;47:S30–S31. [Google Scholar]
- Fass L. Imaging and cancer: A review. Mol Oncol. 2008;2:115–152. doi: 10.1016/j.molonc.2008.04.001. [DOI] [PMC free article] [PubMed] [Google Scholar]
- Gore J, Korc M. Pancreatic cancer stroma: Friend or foe? Cancer Cell. 2014;25:711–712. doi: 10.1016/j.ccr.2014.05.026. [DOI] [PMC free article] [PubMed] [Google Scholar]
- Griffon-Etienne G, Boucher Y, Jain R, Suit H. Effects of needle insertion in tumors on interstitial fluid pressure. Microvasc Res. 1997;54:174–177. doi: 10.1006/mvre.1997.2037. [DOI] [PubMed] [Google Scholar]
- Gutmann R, Leunig M, Feyh J, Goetz AE, Messmer K, Kastenbauer E, Jain RK. Interstitial hypertension in head and neck tumors in patients: Correlation with tumor size. Cancer Res. 1992;52:1993–1995. [PubMed] [Google Scholar]
- Hingorani SR, Harris WP, Hendifar AE, Bullock AJ, Wu XHW, Huang Y, Jiang P. High response rate and PFS with PEGPH20 added to nab-paclitaxel/gemcitabine in stage IV previously untreated pancreatic cancer patients with high-HA tumors: Interim results of a randomized phase II study. J Clin Oncol. 2015;33:4006. [Google Scholar]
- Iglesias-Garcia J, Lindkvist B, Lariño-Noia J, Abdulkader-Nallib I, Dominguez-Muñoz JE. Differential diagnosis of solid pancreatic masses: Contrast-enhanced harmonic (CEH-EUS), quantitative-elastography (QE-EUS), or both? United European Gastroenterol J. 2017;5:236–246. doi: 10.1177/2050640616640635. [DOI] [PMC free article] [PubMed] [Google Scholar]
- Insana MF, Pellot-Barakat C, Sridhar M, Lindfors KK. Viscoelastic imaging of breast tumor microenvironment with ultrasound. J Mammary Gland Biol Neoplasia. 2004;9:393–404. doi: 10.1007/s10911-004-1409-5. [DOI] [PMC free article] [PubMed] [Google Scholar]
- Jacobetz MA, Chan DS, Neesse A, Bapiro TE, Cook N, Frese KK, Feig C, Nakagawa T, Caldwell ME, Zecchini HI, Lolkema MP, Jiang P, Kultti A, Thompson CB, Maneval DC, Jodrell DI, Frost GI, Shepard HM, Skepper JN, Tuveson DA. Hyaluronan impairs vascular function and drug delivery in a mouse model of pancreatic cancer. Gut. 2013;62:112–120. doi: 10.1136/gutjnl-2012-302529. [DOI] [PMC free article] [PubMed] [Google Scholar]
- Jain R, Baxter L. Mechanisms of heterogeneous distribution of monoclonal-antibodies and other macromolecules in tumors: Significance of elevated interstitial pressure. Cancer Res. 1988;48:7022–7032. [PubMed] [Google Scholar]
- Jain RK. Transport of molecules across tumor vasculature. Cancer Metastasis Rev. 1987;6:559–593. doi: 10.1007/BF00047468. [DOI] [PubMed] [Google Scholar]
- Jain RK. Tumor microenvironment and microcirculation: Role in drug delivery. Ann Oncol. 1998;9:24. [Google Scholar]
- Jain RK. Normalizing the tumor microenvironment to enhance therapeutic outcome. Cancer Res. 2011;71 [Google Scholar]
- Konofagou EE, Harrigan TP, Ophir J, Krouskop TA. Poroelastography: Imaging the poroelastic properties of tissues. Ultrasound Med Biol. 2001;27:1387–1397. doi: 10.1016/s0301-5629(01)00433-1. [DOI] [PubMed] [Google Scholar]
- Krupa JC, Shaya D, Chi LL, Linhardt RJ, Cygler M, Withers SG, Mort JS. Quantitative continuous assay for hyaluronan synthase. Anal Biochem. 2007;361:218–225. doi: 10.1016/j.ab.2006.11.011. [DOI] [PMC free article] [PubMed] [Google Scholar]
- Leiderman R, Barbone PE, Oberai AA, Bamber JC. Coupling between elastic strain and interstitial fluid flow: Ramifications for poroelastic imaging. Phys Med Biol. 2006;51:6291–6313. doi: 10.1088/0031-9155/51/24/002. [DOI] [PubMed] [Google Scholar]
- Less JR, Posner MC, Boucher Y, Borochovitz D, Wolmark N, Jain RK. Interstitial hypertension in human breast and colorectal tumors. Cancer Res. 1992;52:6371–6374. [PubMed] [Google Scholar]
- Maleke C, Konofagou EE. Harmonic motion imaging for focused ultrasound (HMIFU): A fully integrated technique for sonication and monitoring of thermal ablation in tissues. Phys Med Biol. 2008;53:1773–1793. doi: 10.1088/0031-9155/53/6/018. [DOI] [PubMed] [Google Scholar]
- Manssor NAS, Radzi Z, Yahya NA, Yusof LM, Hariri F, Khairuddin NH, Kasim NHA, Czernuszka JT. Characteristics and Young’s modulus of collagen fibrils from expanded skin using anisotropic controlled rate self-inflating tissue expander. Skin Pharmacol Physiol. 2016;29:55–62. doi: 10.1159/000431328. [DOI] [PubMed] [Google Scholar]
- Marusyk A, Polyak K. Tumor heterogeneity: Causes and consequences. Biochim Biophys Acta Rev Cancer. 2010;1805:105–117. doi: 10.1016/j.bbcan.2009.11.002. [DOI] [PMC free article] [PubMed] [Google Scholar]
- McAleavey SA, Menon M, Orszulak J. Shear-modulus estimation by application of spatiallymodulated impulsive acoustic radiation force. Ultrason Imaging. 2007;29:87–104. doi: 10.1177/016173460702900202. [DOI] [PubMed] [Google Scholar]
- Miles K. Tumour angiogenesis and its relation to contrast enhancement on computed tomography: A review. Eur J Radiol. 1999;30:198–205. doi: 10.1016/s0720-048x(99)00012-1. [DOI] [PubMed] [Google Scholar]
- Morton CL, Houghton PJ. Establishment of human tumor xenografts in immunodeficient mice. Nat Protoc. 2007;2:247–250. doi: 10.1038/nprot.2007.25. [DOI] [PubMed] [Google Scholar]
- Nagelschmidt M, Viell B. Polarimetric assay for the determination of the native collagen content of soluble collagen. J Biomed Mater Res. 1987;21:201–209. doi: 10.1002/jbm.820210205. [DOI] [PubMed] [Google Scholar]
- Nightingale K, Nightingale R, Stutz D, Trahey G. Acoustic radiation force impulse imaging of in vivo vastus medialis muscle under varying isometric load. Ultrason Imaging. 2002;24:100–108. doi: 10.1177/016173460202400203. [DOI] [PubMed] [Google Scholar]
- Olive KP, Jacobetz MA, Davidson CJ, Gopinathan A, McIntyre D, Honess D, Madhu B, Goldgraben MA, Caldwell ME, Allard D, Frese KK, Denicola G, Feig C, Combs C, Winter SP, Ireland-Zecchini H, Reichelt S, Howat WJ, Chang A, Dhara M, Wang L, Ruckert F, Grutzmann R, Pilarsky C, Izeradjene K, Hingorani SR, Huang P, Davies SE, Plunkett W, Egorin M, Hruban RH, Whitebread N, McGovern K, Adams J, Iacobuzio-Donahue C, Griffiths J, Tuveson DA. Inhibition of hedgehog signaling enhances delivery of chemotherapy in a mouse model of pancreatic cancer. Science. 2009;324:1457–1461. doi: 10.1126/science.1171362. [DOI] [PMC free article] [PubMed] [Google Scholar]
- Perriez P, Kennedy F, Van Houten E, Weaver J, Paulsen K. Magnetic resonance poroelastography: An algorithm for estimating the mechanical properties of fluid-saturated soft tissues. IEEE Trans Med Imaging. 2010;29:746–755. doi: 10.1109/TMI.2009.2035309. [DOI] [PMC free article] [PubMed] [Google Scholar]
- Provenzano P, Cuevas C, Chang A, Goel V, Von Hoff D, Hingorani S. Enzymatic targeting of the stroma ablates physical barriers to treatment of pancreatic ductal adenocarcinoma. Cancer Cell. 2012;21:418–429. doi: 10.1016/j.ccr.2012.01.007. [DOI] [PMC free article] [PubMed] [Google Scholar]
- Provenzano PP, Hingorani SR. Hyaluronan, fluid pressure, and stromal resistance in pancreas cancer. Br J Cancer. 2013;108:1–8. doi: 10.1038/bjc.2012.569. [DOI] [PMC free article] [PubMed] [Google Scholar]
- Richards MS, Doyley MM. Investigating the impact of spatial priors on the performance of model-based ivus elastography. Phys Med Biol. 2011;56:7223–7246. doi: 10.1088/0031-9155/56/22/014. [DOI] [PMC free article] [PubMed] [Google Scholar]
- Righetti R, Garra BS, Mobbs LM, Kraemer-Chant CM, Ophir J, Krouskop TA. The feasibility of using poroelastographic techniques for distinguishing between normal and lymphedematous tissues in vivo. Phys Med Biol. 2007;52:6525. doi: 10.1088/0031-9155/52/21/013. [DOI] [PubMed] [Google Scholar]
- Roh HD, Boucher Y, Kalnicki S, Buchsbaum R, Bloomer WD, Jain RK. Interstitial hypertension in carcinoma of uterine cervix in patients: Possible correlation with tumor oxygenation and radiation response. Cancer Res. 1991;51:6695–6698. [PubMed] [Google Scholar]
- Rotemberg V, Palmeri M, Nightingale R, Rouze N, Nightingale K. The impact of hepatic pressurization on liver shear wave speed estimates in constrained versus unconstrained conditions. Phys Med Biol. 2011;57:329–341. doi: 10.1088/0031-9155/57/2/329. [DOI] [PMC free article] [PubMed] [Google Scholar]
- Seifert J, Hammer CM, Rheinlaender J, Sel S, Scholz M, Paulsen F, Schäffer TE. Distribution of Young’s modulus in porcine corneas after riboflavin/UVA-induced collagen cross-linking as measured by atomic force microscopy. PLoS ONE. 2014;9:e88186. doi: 10.1371/journal.pone.0088186. [DOI] [PMC free article] [PubMed] [Google Scholar]
- Stylianopoulos T, Martin JD, Chauhan VP, Jain SR, Diop-Frimpong B, Bardeesy N, Smith BL, Ferrone CR, Hornicek FJ, Boucher Y, Munn LL, Jain RK. Causes, consequences, and remedies for growth-induced solid stress in murine and human tumors. Proc Natl Acad Sci USA. 2012;109:15101–15108. doi: 10.1073/pnas.1213353109. [DOI] [PMC free article] [PubMed] [Google Scholar]
- Swartz MA, Lund AW. Lymphatic and interstitial flow in the tumour microenvironment: Linking mechanobiology with immunity. Nat Rev Cancer. 2012;12:210–219. doi: 10.1038/nrc3186. [DOI] [PubMed] [Google Scholar]
- Tan MH, Chu TM. Insitu invasion of an orthotopic human-pancreas oncomicroxenograft (aspc-1) Proc Am Assoc Cancer Res. 1984;25:52. [Google Scholar]
- Urban MW, Silva GT, Fatemi M, Greenleaf JF. Multifrequency vibro-acoustography. IEEE Trans Med Imaging. 2006;25:1284–1295. doi: 10.1109/tmi.2006.882142. [DOI] [PubMed] [Google Scholar]
- Vakoc BJ, Lanning RM, Tyrrell JA, Padera TP, Bartlett LA, Stylianopoulos T, Munn LL, Tearney GJ, Fukumura D, Jain RK, Bouma BE. Three-dimensional microscopy of the tumor microenvironment in vivo using optical frequency domain imaging. Nat Med. 2009;15:1219–1223. doi: 10.1038/nm.1971. [DOI] [PMC free article] [PubMed] [Google Scholar]
- Wangermez M. Endoscopic ultrasound of pancreatic tumors. Diagn Interv Imaging. 2016;97:1287–1295. doi: 10.1016/j.diii.2016.10.002. [DOI] [PubMed] [Google Scholar]
- Yendluri V, Centeno B, Springett GM. Pancreatic cancer presenting as a Sister Mary Joseph’s nodule. Pancreas. 2007;34:161–164. doi: 10.1097/01.mpa.0000240602.18688.43. [DOI] [PubMed] [Google Scholar]


