

Abstract
High spatial resolution in mass spectrometry imaging (MSI) is crucial to understanding the biology dictated by molecular distributions in complex tissue systems. Here, we present MSI using infrared matrix-assisted laser desorption electrospray ionization (IR-MALDESI) at 50 μm resolution. An adjustable iris, beam expander, and aspherical focusing lens were used to reduce tissue ablation diameters for MSI at high resolution. The laser beam caustic was modeled using laser ablation paper to calculate relevant laser beam characteristics. The minimum laser spot diameter on the tissue was determined using tissue staining and microscopy. Finally, the newly constructed optical system was used to image hen ovarian tissue with and without oversampling, detailing tissue features at 50 μm resolution.
Keywords: Mass spectrometry imaging, IR-MALDESI, Tissue imaging, Spatial resolution, Laser focusing
Graphical abstract

Introduction
Mass spectrometry imaging (MSI) combines the molecular specificity of mass spectrometry with the spatially resolved analysis of an imaging technique [1]. This can be performed in a label-free manner over a range of m/z values, allowing thousands of analytes to be analyzed simultaneously. The resulting data may be visualized using a variety of software [2] to depict the localization and abundance of each molecule. MSI has been routinely applied to the study of plants [3], proteins [4], lipids [5], and drug distributions [6]. A common goal of nearly all applications is to achieve high spatial resolution without a loss in analyte detectability.
Laser-based MSI methods are the most commonly used methods to date, and an article reviewing the broad field of high resolution laser-based MSI across different technologies was recently published [7]. The spatial resolution of all laser-based MSI methods is inherently tied to the laser spot size. Infrared (IR) laser desorption methods for improving spot size follow the same general principles as those in the UV regime [8]; however, IR lasers, which are the focus of this manuscript, are not as commonly used in the MSI field.
For a Gaussian profile laser, the diffraction limited spot size is given by
| (1) |
where M2 is the beam propagation quality factor, λ is the wavelength, f is the lens focal length, and D is the Gaussian input beam diameter at the lens. To decrease the spot size of the focused laser, it is possible to use a shorter focal length lens (f), increase the beam diameter (D), and/or improve the laser beam quality (M2). Spherical aberration can cause significant enlargement of the minimum spot size if not corrected [9]. The spot size determined by spherical aberration is given by
| (2) |
where D and f are as described above and k is a material constant. While these can be easily changed in custom sources, adjustments to commercial MSI instruments are more difficult [10]. A short focal length lens presents a unique challenge in MSI because the ablated material must be proximal to and accessible for sampling by the mass spectrometer, often preventing the use of very short focal length lenses. To circumvent this issue, researchers may use transmission geometry IR laser ablation, where the laser is focused on the opposite side of the sample being analyzed [11]. Alternatively, Römpp and coworkers used an optic with a central drilled hole to allow the ablated material to pass through [12]. The laser beam propagation factor M2 is a defining parameter detailing the beam quality, with a perfect Gaussian beam having an M2 of 1. To reduce the detrimental effect of lasers with M2>1, a spatial filter may be used to remove the non-Gaussian and low laser energy edge [13]. As seen from equation 1, using the maximum diameter of the lens is beneficial to achieving a diffraction-limited spot size, however, the larger diameter increases the contribution of spherical aberration (equation 2) if a plano-convex or meniscus lens is used, which do not correct for spherical aberration. Incorporating beam expanding lenses reduces beam divergence and the focal spot size of the IR laser. Alternatively, Hieta and coworkers have used the inherent beam divergence of their laser with a very long path length to completely fill the focusing lens and remove the beam edge [13].
Several methods have been used to achieve spatial resolutions lower than the IR laser spot size. Oversampling involves moving the sample by less than the laser ablation diameter with complete ablation at each position, effectively sampling only a small portion of the total laser spot size [14, 15]. This method results in irregular shapes of tissue ablated from a Gaussian profile laser beam. The coupling of IR laser ablation and a spatially resolved detector has been reported [16, 17] to achieve MSI resolution below the diffraction limit of the IR laser.
Infrared matrix-assisted laser desorption electrospray ionization (IR-MALDESI) is a technique combining infrared laser ablation and electrospray ionization [18, 19]. IR-MALDESI MSI has been used to analyze a variety of biospecimens [20]. The laser ablation diameter on tissue has been previously reported as approximately 150 μm using a single focusing element [19, 21]. This method has been used and optimized for tissue imaging experiments of lipids, metabolites and small molecule drugs [21].
This work details the utility of a multi-element optical system for IR-MALDESI MSI to simultaneously reduce spot size and improve spatial resolution. The multi-element optical system incorporates an adjustable iris, 3.75× beam expander, and aspheric focusing lens to improve the spatial resolution of IR-MALDESI MSI to 50 μm.
Experimental
Materials
LC/MS grade methanol, ethanol, water, and formic acid were purchased from Fisher Scientific (Pittsburgh, PA, USA). Laser burn paper was purchased from ZAP-IT (ZFC-23, ZAP-IT, Concord, NH, USA). Pre-cleaned microscope slides were purchased from VWR (Radnor, PA, USA).
Tissues
Mouse liver tissues were obtained from the College of Veterinary Medicine at North Carolina State University. Hen ovarian tissue was obtained from a C-Strain white leghorn commercial egg laying hen. Animals were managed in accordance with the Institute for Laboratory Animal Research Guide, and all husbandry practices were approved by North Carolina State University Institutional Animal Care and Use Committee. Tissues were harvested and immediately flash-frozen with a dry ice in isopentane bath and stored at -80 °C until the time of the experiment. A Leica CM1950 cryomicrotome (Buffalo Grove, IL, USA) operated at -20°C was used to prepare cryosections for analysis. Optimum cutting temperature (OCT) embedding medium (Fisher Scientific, Waltham, MA, USA) was used to adhere the tissue to a 40 mm specimen disc. The tissues were sectioned into 10-μm thick sections and thaw-mounted onto standard glass microscope slides immediately prior to analysis.
IR-MALDESI source
A custom acrylic enclosure housed the ionization source consisting of an X-Y translation stage, electrospray emitter and a portion of the laser optics. Custom software developed in-house was used to drive the X-Y stage with the sample on a Peltier-cooled plate. The plate was cooled to -9 °C to form a thin ice matrix layer on the animal tissue sections to enhance energy absorption and improve ablation dynamics. The ice matrix layer was maintained by purging the enclosure with dry nitrogen (Arc3 Gases, Raleigh, NC, USA) to a relative humidity of approximately 10% throughout the imaging experiments. Two laser pulses at 20 Hz from a mid-IR laser (IR opolette, Opotek, Carlsbad, CA, USA) tuned to 2940 nm were focused on the sample surface at each stage position. The ablated material was ejected normal to the target surface where it overlapped with an orthogonal electrospray plume.
Stable electrospray was maintained using a solvent composition of 1:1 methanol:water with 0.2% formic acid, a 2.0 μl/min flow rate, 4.0 kV potential, and a 75 μm i.d. silica taper tip emitter (New Objective, Woburn, MA, USA). Geometric parameters of the IR-MALDESI source remained constant through all experiments presented herein. The emitter tip was placed 5 mm above the sample, the laser ablation spot was 1 mm from the emitter tip and 5 mm from the customized extended MS inlet [21, 22]. The IR-MALDESI source was coupled to a Q Exactive™ Plus mass spectrometer (ThermoScientific, Bremen, Germany). Data were collected in positive ion mode with a scan range of 250-1000 m/z and resolving power was set to 140,000 (FWHM at 200 m/z). Automatic gain control (AGC) was turned off and the injection time was fixed based on the number of laser pulses. The total injection time (IT) was calculated as t=25+50(n-1) ms, where n is the number of laser pulses (i.e. IT = 25 ms for 1 laser pulse, 75 ms for 2 laser pulses, etc.).
The MS. RAW data files were converted to the mzML format using MSConvert [23], and the mzML files were subsequently converted to the imzML format using the imzMLconverter software [24, 25]. The imzML files were then loaded into MSiReader for visualization and analysis of MSI data [26]. Averaged mass spectra and S/N were obtained from Xcalibur version 2.2 (Thermo Fisher, San Jose, CA, USA).
Safety
IR laser safety glasses (pn 100-38-200, Laser Safety Industries, Minneapolis, MN, USA) were worn while the laser was on. Curved laser safety shields (TPS8, Thorlabs, Newton, NJ, USA) were installed on the optical breadboard around the mirrors used to steer the beam. All lenses were enclosed in a 1″ diameter lens tube. A laser curtain (Laz-R-Shroud, Rockwell Laser Industries, Cincinnatti, OH, USA) was erected around the IR-MALDESI laboratory space to isolate the IR laser from the rest of the laboratory.
Laser and optics
An IR opolette tunable (2700-3100 nm) laser system was purchased from Opotek Inc. (Carlsbad, CA, USA). Protected gold mirrors (PF10-03-M01, Thorlabs, Newton, NJ, USA) were mounted on kinematic mounts (KM100, Thorlabs, Newton, NJ, USA) and were used to align the laser beam. The laser head and two aligning mirrors were mounted on an optical breadboard above the mass spectrometer. A third mirror directed the beam path down through the focusing lenses and in front of the mass spectrometer inlet. Two laser focusing designs were tested sequentially to compare the laser focusing ability of each. The first design consisted of a single, uncoated CaF2 planoconvex lens (focal length (f) = +62.5 mm, Edmund Optics, Irvine, CA, USA) (Figure 1A) and was previously used for IR-MALDESI MSI analyses [19]. The second design incorporated an adjustable iris (SM1D12C, Thorlabs, Newton, NJ, USA), a beam expander, and an aspherical focusing lens. The Galilean beam expander was constructed using a 1″ CaF2 concave lens (f = -40 mm, antireflective (AR)-coated 3-5 μm) (Thorlabs, Newton, NJ, USA) and a 1″ CaF2 convex lens (f = +150 mm, AR-coated 3-5 μm) (Thorlabs, Newton, NJ, USA). The expanded beam was then focused on the target using a 1″ ZnSe aspheric lens (f = 50.0 mm, AR-coated 3-5 μm) (Thorlabs, Newton, NJ, USA) (Figure 1B). A 25.4 mm diameter quartz coverslip (Alfa Aesar, Haverhill, MA, USA) was placed between the final lens and the target to protect the ZnSe lens. Laser energy was measured using a Nova II laser power meter with a 3A-P laser thermal power sensor (Ophir Optronics, Jerusalem, Israel) for both optical systems.
Figure 1.
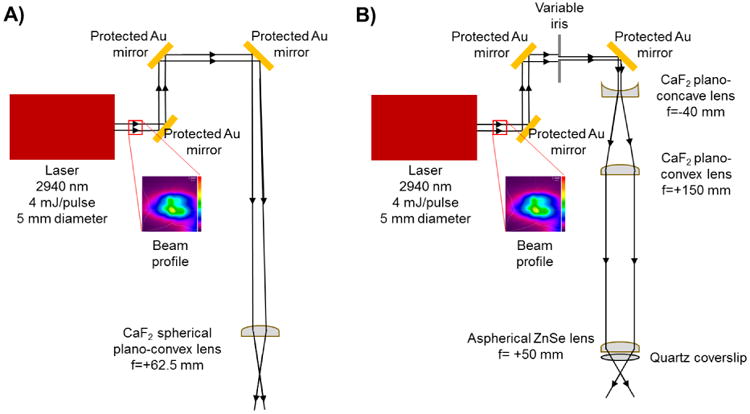
Schematic of IR-MALDESI using A) a single spherical focusing lens and B) a beam expander with an iris and an aspherical focusing lens.
Laser beam caustic visualization
A zap-it film card (ZFC-23, Zap-IT, Concord, NH, USA) was mounted on a microscope slide. After the lens system was focused onto the sample plane, the stage height was adjusted to defined positions located above, at, and below the focal point. A single laser ablation event was recorded on the laser film card at these defined z height positions for both optical systems. Images of each laser ablation spot were obtained using a 10× objective on an LMD7000 (Leica, Buffalo Grove, IL, USA). The burn paper ablation images were then loaded into MATLAB 2016b (Mathworks, Natick, MA, USA) where the ablation spots were manually fitted with an ellipse. The major and minor axes of each ellipse were recorded, with their corresponding z height, and are provided in electronic supplementary material (ESM1 and ESM2). The fitted ellipses were plotted in 3-dimensional space with each corresponding projection (XY, XZ, and YZ) as shown in Figure 2. The average fluence at each z position was calculated by taking the average energy divided by the area of each ellipse, which is reported as J/cm2. The ellipses are color coded based on the fluence using the “hot” heatmap available in MATLAB. The laser caustics for both systems were then visualized as a 3D surface through interpolation between z heights and the surfaces were colored according to the average fluence.
Figure 2.

Visualization of laser beam caustic for A) single focusing optic and B) beam expander. The data is represented as projections of ellipses on 3 axes showing the laser focus profile in the XY, XZ, and YZ planes. The color of each ellipse is representative of the average laser fluence at each Z position. These ellipses were interpolated and represented as a 3D surface for both laser optic designs.
Fitting real data to theoretical real laser beam focus
The equation for a real laser beam propagation is given by
| (3) |
where W(z) is the real beam radius at position z along the beam optical axis, Wo is the real beam waist radius, M2 is the beam quality factor, and zo is the position of the position of the beam minimum radius with respect to a reference position [27]. Parameters defining the laser beam were calculated by fitting the theoretical curve of a real laser beam in the XZ and YZ planes to the measured values. The fit was performed in Excel using generalized nonlinear regression. The residuals were calculated for each data point and plotted as a function of z height. The half angle divergence was calculated using a linear regression on the last three points in the curve.
Laser ablation diameter on tissue
Mouse liver tissue was cryosectioned and mounted onto microscope slides. The number of laser pulses was varied from 1-5 and the diameter of the beam shaping iris was set to 2, 4, or 12 mm. For each combination tested, 20 positions on tissue were ablated. After laser ablation, the slides were removed from the stage, excess water was removed, and the tissues were stained with 100 μL of histogene staining solution (Applied Biosystems, Foster City, CA, USA) pipetted directly on top of the tissue and allowed to sit for approximately 2 minutes. The slide was then washed with 70% ethanol for 30 seconds followed by 100% ethanol for 30 seconds. Excess ethanol was removed and approximately 50 μL of Permount mounting medium (Fisher Scientific, Waltham, MA, USA) was pipetted onto the tissue and a coverslip was mounted on the slide. Digital images of the stained tissues with ablation spots were taken using an LMD7000 (Leica Microsystems, Buffalo Grove, IL, USA) with a 5× objective. The JPEG images were loaded into MATLAB 2016b (Mathworks, Natick, MA, USA) and circles were fitted to the ablation spots using the “imfindcircles” function in the Image Processing Toolbox.
MSI with high spatial resolution
Hen ovary tissue was analyzed using the beam expander optic design to perform high spatial resolution IR-MALDESI MSI. A region on the edge of a hen ovarian tissue section was analyzed using a 2 mm iris diameter and two laser pulses, corresponding to the smallest ablation diameter reliably achievable with this optical system. Five regions of interest (ROIs) 41 × 11 voxels in size were analyzed using decreasing step size of the stage in an oversampling mode with 100, 75, 50, 40, and 30 μm step sizes. After IR-MALDESI MSI, the tissue was stained using the tissue staining protocol described above.
Additionally, a hen ovary section was analyzed with three paired conditions: 2 mm iris diameter with 50 μm raster step size, 4 mm iris diameter with 75 μm raster step size, and 12 mm iris diameter with 100 μm raster step size, resulting in minimal undersampling of the tissue. A custom birefringent optical attenuator was used to maintain a constant 1.2 J/cm2 fluence for each iris setting.
Results and Discussion
Multi-lens optical system
The optical systems presented in Figure 1 were easily installed and aligned using a 1″ tube lens system (Thorlabs, Newton, NJ, USA) to secure all lens components. The inclusion of two mirrors on kinematic mounts on the optical breadboard allowed precise adjustment of the laser path, which was needed to keep the laser beam centered throughout the multi-lens system. The total path length for both optical systems was approximately 1 meter. The output beam profile of the OPO laser was measured using a Pyrocam III HR (Ophir-Spiricon, North Logan, UT, USA) beam profiling camera as seen in ESM1. The beam profile of the laser output was not a perfect Gaussian, which effects the minimum spot size achievable due to the dependence on M2. To this end, a variable iris was incorporated into the multi-lens system to block the low-energy fringe of the laser output and thereby improve the minimum focal point. A 3.75× magnification Galilean beam expander was constructed from plano-concave (f = -40 mm) and plano-convex (f = +150 mm) lenses placed such that their focal points were coincident. The expanded beam (approx. 20 mm diameter) was incident on a 1″ ZnSe aspherical lens (f = +50 mm), whose shape corrects spherical aberration. A quartz coverslip was placed immediately after the last focusing lens to protect the lens from ablated sample debris.
Visualization of laser beam caustic
The laser beam caustic was visualized by placing laser burn paper at various heights relative to the focal point. Although this limited the visualization to regions where there was sufficient fluence to ablate the laser burn paper, it was found to be acceptable to obtain a profile of the laser focus. It is likely that the ablation spots on the burn paper do not exactly reflect the laser beam width where the intensity drops to 1/e2, the common definition of laser beam width; however, the method is sufficient for comparison between two optical designs, as presented here.
The laser ablation for the single spherical focusing lens was recorded over a 10.16 mm distance shown in ESM2. MATLAB was used to manually fit ellipses (blue) to the laser ablation spots and major and minor axes were recorded with their corresponding z height. The laser ablation spots for the multi-lens system are shown in ESM3. These ellipses were then plotted to give the 3 projections, XY, XZ, and YZ, seen in Figure 2. The two XY projections show the observed laser ablation spots. The beam expander design gave much more circular ablation spots than the single lens design, a desirable quality of a laser used for MSI. A circular laser ablation allows MS images to be acquired with the same spatial resolution in both the X and Y dimensions, even in the undersampling mode. The reduced ablation area of the beam expander design resulted in a much higher fluence, as indicated by the heatmap. Laser fluence has a direct impact on IR-MALDESI MSI data quality. First, the laser system must have sufficiently high fluence to ablate or desorb the sample and matrix. Second, at energies above the ablation threshold, the fluence will have an impact on the ablation dynamics and overlap with the electrospray [22]. Third, the ablation fluence determines the number of laser pulses required to completely ablate through the sample [21], which is a requirement for quantitative IR-MALDESI analyses [28]. By the above points, the higher fluence of the multi-element design indicated it would successfully ablate tissue material, possibly with fewer pulses, than the single optic design. Optimizing the laser fluence to a wide variety of sample types for imaging or direct analysis could be accomplished by attenuation, using a polarization based attenuation and an iris to balance the total energy and desired spot size.
To better visualize the laser beam caustic, a 3D surface was constructed from the stacked ellipses. The 3D surface is representative of the true laser focus as it is not composed of discrete sampling points, rather a continuum of ablation spots based on interpolation of the data collected. To aid in comparing the two beam caustics, the axes and color maps are presented on the same scale. This emphasizes the reduction in the ablation diameter along with reduction in the depth of focus (Figure 2).
The equation for a real laser beam propagation (equation 2) was fit to the beam profile in the XZ and YZ projections. Figure 3 displays the laser profile for both projections along with the equation fit with parameters solved. The residuals were plotted for each fit to estimate the goodness of fit of the model to the data. The fit residuals for the single optic (Figure 3A) indicated that the data deviated from the theoretical fit moderately when the laser spot size was far from the focal point, whereas this was not the case when the beam expander was used (Figure 3B). One explanation for this discrepancy may be that the single optic was situated further away from the focal point to fully cover the laser beam caustic. As the laser ablation spots at the furthest points (XZ/YZ distance) approached the ablation threshold of the laser burn paper and were larger than the image size of the 5× objective, it could lead to an inaccurate estimation of the laser diameter at these points. Linear regression on the last three points of each projection was used to estimate the far field divergence of the laser beam. The model was used to estimate the half angle divergence of both laser optic designs.
Figure 3.

The equation for a real laser beam was fit to the beam profile in the XZ and YZ planes using a generalized reduced gradient nonlinear regression for both A) single optic and B) beam expander. Residuals of each fit are presented to the right. Linear regression was used to estimate the far field beam divergence from the last 3 points of each curve.
Using the model of the propagation of a real laser beam, important laser parameters describing the laser focus were defined to quantitatively compare the two optical systems. Table 1 summarizes some of the most important parameters for laser ablation in IR-MALDESI MSI using the single focusing element or optical design with an iris set to 12 mm, 3.75× beam expander and aspherical lens. M2 is the beam propagation factor and is a commonly used metric of the beam quality. A diffraction limited, perfectly Gaussian beam would have an M2 = 1. The comparison of the multi-lens beam expander designs shows an improvement in M2 for both X and Y dimensions over the single optic, from 27.0 to 15.4 and 16.9 to 14.7, respectively. The minimum beam waist, Wo, is the beam radius in micrometers at its minimum size. The value is a representation of the laser focus minimum spot size. The multi-element optical system improved Wo on laser burn paper by a factor 2.6 and 1.9 for the X and Y dimensions. This reduction in both dimensions is particularly important for microprobe MSI, where the sample is rastered in the XY plane, to give greater spatial resolution. The Rayleigh length of the laser focus is defined as the distance along the propagation direction where the cross sectional area is doubled. This corresponds to where the beam waist is √2 Wo. The depth of focus, or confocal parameter (b), is twice the Rayleigh length centered about the minimum. IR-MALDESI MSI with the single focusing lens has an average depth of focus of 2.78 mm, which made the technique quite impervious to minor changes in sample height on the Peltier stage. The beam expander design has a significantly smaller depth of focus (0.78 mm). While this may require more careful focusing of the optic for the smallest ablation diameters in MSI use, it is, importantly, sufficiently greater than the sample thickness (10 μm). Related to the depth of focus is the half angle divergence. This value describes the angle of light being focused and is a direct result of the size of the incoming diameter and the distance to the focusing lens. Like the minimum beam waist, the half angle divergence is influenced by the beam quality propagation factor, M2. The calculated half angle divergence for the beam expander lens system is 3-4° larger than the single focusing lens and is most likely the result of a large input diameter at the final focusing lens.
Table 1.
Defining beam characteristics.

| ||||
|---|---|---|---|---|
| Single lens | Beam expander | |||
| Parameter | X | Y | X | Y |
| M2, beam quality | 27.0 | 16.9 | 15.4 | 14.7 |
| Wo, beam waist (μm) | 197.0 | 140.3 | 74.7 | 73.1 |
| b, depth of focus (mm) | 3.07 | 2.49 | 0.78 | 0.75 |
| θ, Half angle divergence | 7.9° | 6.8° | 11.3° | 11.1° |
Ablation diameter on mouse liver tissue
To assess the efficacy of the multi-element optical system for MSI applications, it is necessary to move to tissue, which is a more challenging substrate to ablate and introduces the use of an ice matrix. A combination of iris diameters and number of laser pulses (n = 1-5) was used to define the tissue ablation diameter of the beam expander optical design. The 2.0 and 4.0 mm iris only let the most intense laser energy through the optical system, while the 12 mm iris (max) would let nearly all of the laser beam into the system. With the 3.75× beam expander in use, only the center 6.8 mm of the laser output beam would travel through the 1″ lens tube system housing the optics without being absorbed by the tubing wall. All combinations of iris and number of pulses were able to completely ablate through the 10 μm thick mouse liver tissue to give a clear circular ablation spot, except for the 2.0 mm iris and 1 laser pulse (Figure 4A). The laser ablation areas were calculated by fitting circles to the ablation spots on tissue using the “imfindcircles” algorithm in MATLAB. The reproducibility of ablation spots is represented by the 95% confidence interval in the mean ablation diameter shown in Figure 4B, indicating that the ablation diameters are highly reproducible. Most of the tissue was ablated in the first 2 laser pulses, as shown in the marginal increase of ablation diameter in pulses 3-5. In a balance of minimum spot size with complete ablation and shortest ion injection time, the 2 laser pulse setting was selected for evaluation of the multi-element optical system on IR-MALDESI MSI.
Figure 4.

Measurement of ablation diameters on mouse liver tissue using ice as a matrix while varying iris diameter and number of pulses. A) Stained tissue images after ablation by an IR laser with ablation spots fitted with circles B) Average tissue ablation diameters for the iris diameters and number of pulses.
High spatial resolution IR-MALDESI MSI
The lowest ablation diameter setting, 2.0 mm iris and 2 laser pulses, was chosen to investigate the smallest raster step size that could be used while still generating useful MSI data. Using this configuration, data were collected from the edge of a structurally complex hen ovary tissue at 100, 75, 50, 40, and 30 μm step sizes. The step sizes less than 50 μm represent analysis in an oversampling mode, where the area of tissue being ablated is smaller than the laser ablation diameter. However, as seen in Figure 5, the ion abundance of cholesterol (m/z 369.3516 ± 2.5 ppm) at the 40 and 30 μm step sizes neared the limit of detection of the IR-MALDESI source coupled to a Q Exactive™ Plus mass spectrometer, and the detection frequency was not optimal. The MS peak of cholesterol for each raster step size is displayed on the right of Figure 5. The ion abundance and signal-to-noise ratio (S/N) is significantly reduced for 40 and 30 μm step sizes compared to the 100, 75, and 50 μm step size. Cholesterol was chosen as it was the most abundant ion detected by IR-MALDESI and, therefore, would require the least volume of ablated tissue to be detected. Methods to improve ion abundance including reoptimization of the IR-MALDESI source geometry to improve ablation and electrospray plume overlap [21], the use of a higher repetition rate laser to reduce ion loss in the MS C-trap, and ionization agent optimization [28, 30, 31] will be the focus of future work.
Figure 5.

MSI of a lipid (cholesterol [M-H2O+H+]+, m/z 369.3516 ± 2.5 ppm) overlaid on the optical image of the tissue. Regions of interest were analyzed with a range of raster step sizes to demonstrate MSI at high spatial resolution. The average cholesterol [M-H2O+H]+ peak for each raster step size is displayed with corresponding S/N values.
The desired ablation diameter was achieved through adjustment of the iris and the rotation of a polarization-based optical attenuator placed in the beam path. A hen ovary tissue was analyzed at 50, 75, and 100 μm spatial resolution using 2.0 mm, 4.0 mm and 12.0 mm iris diameters, respectively. Because more energy enters the optical system with larger iris diameters, a custom polarization-based attenuator was placed in the beam path to maintain a constant fluence (1.2 J/cm2) between the spatial resolutions of the experiment. Figure 6A shows the ion distribution map of cholesterol for 3 sections of the same hen ovary tissue section analyzed at different spatial resolutions. A serial tissue section was stained and an optical image was included in Figure 6B to visually compare tissue morphology to the MS image. The distribution of cholesterol showed concentric rings of high abundance in the developing follicles on the left. A full scan mass spectrum is displayed in Figure 6C showing numerous endogenous lipids and metabolites in the hen ovary tissue analyzed at 50 μm resolution. Tissue specific peaks were generated by averaging an on-tissue region and subtraction of an off-tissue region to minimize peak contribution by ambient contaminants. ESM4 demonstrates that mass measurement accuracy (MMA) was better than ± 2.5 ppm for all pixels in the imaging experiment.
Figure 6.
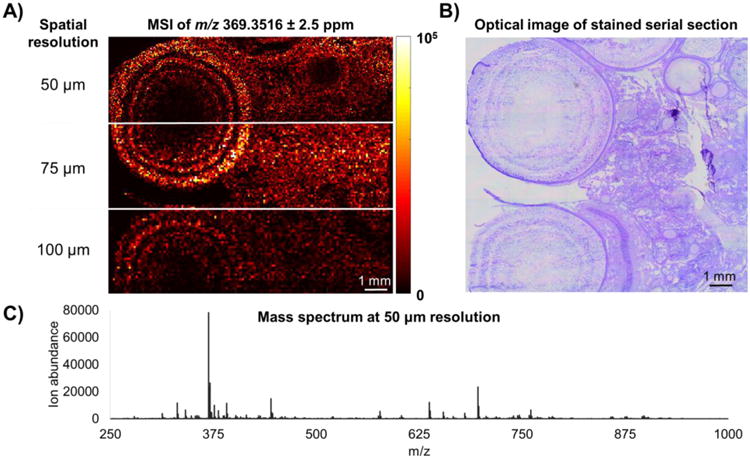
A) IR-MALDESI MSI of cholesterol [M-H2O+H]+, m/z 369.3516 ± 2.5 ppm in hen ovary tissue at 50, 75, and 100 μm spatial resolution. B) An optical image of a stained serial section showing the complex morphology of the ovary tissue. C) An averaged mass spectrum for the 50 μm spatial resolution experiment.
Conclusion
A multi-element optical design composed of an adjustable iris, beam expander, and aspherical focusing lens was implemented for high resolution IR-MALDESI MSI. The design was compared to the previously used single lens design, and demonstrated improved beam quality factor (M2) and a smaller minimum waist, Wo, two of the most important laser ablation parameters in the context of MSI. A hen ovarian tissue was analyzed using the multi-element system, yielding high quality MS images with 50 micron spatial resolution.
Supplementary Material
ESM1. Beam profile of the opolette OPO IR laser at 2940 nm measured using a Pyrocam IIIHR profiling camera. Circles represent the energy profile transmitted at each iris setting; 2 mm (black), 4 mm (white), and 12 mm (gold). A 12 mm iris setting is effectively 6.8 mm diameter due to beam clipping of the 1″ optics of the 3.75× beam expander and absorption of laser energy in the lens tube wall.
ESM2. A laser burn spot was recorded on laser burn paper at the specified z positions for the single focusing lens. A 10× objective was used to take an optical image of each burn spot, and fit with an ellipse in MATLAB. The ellipse major and minor axes were converted into μm using a microscope micrometer.
ESM3. A laser burn spot was recorded on laser burn paper at the specified z positions for the multi-element optical design. A 10× objective was used to take an optical image of each burn spot, and fit with an ellipse in MATLAB. The ellipse major and minor axes were converted into μm using a microscope micrometer.
ESM4. Mass measurement accuracy (MMA) of cholesterol MSI presented in figure 6. RAW files were loaded into RawMeat (Vast Scientific) and exported using MZ monitor. MMA was calculated for every cholesterol peak and a histogram was created using 0.1 ppm bin size.
ESM5. An attenuator was placed in the laser beam path before the iris to precisely control the average fluence with each iris setting. The polarization-based attenuator was rotated from 0-90° in increments of 10°. The above plot displays a series of points for the three iris settings investigated with varying attenuation, allowing experiments to be ran with different iris diameters while maintaining constant fluency.
Acknowledgments
The authors gratefully acknowledge financial support from the National Institutes of Health (R01GM087964), the W.M. Keck Foundation, and North Carolina State University.
References
- 1.Amstalden van Hove ER, Smith DF, Heeren RM. A concise review of mass spectrometry imaging. Journal of chromatography A. 2010;1217:3946–3954. doi: 10.1016/j.chroma.2010.01.033. [DOI] [PubMed] [Google Scholar]
- 2.Ràfols P, Vilalta D, Brezmes J, Cañellas N, del Castillo E, Yanes O, Ramírez N, Correig X. Signal preprocessing, multivariate analysis and software tools for MA(LDI)-TOF mass spectrometry imaging for biological applications. Mass spectrometry reviews. 2016:n/a–n/a. doi: 10.1002/mas.21527. [DOI] [PubMed] [Google Scholar]
- 3.Boughton BA, Thinagaran D, Sarabia D, Bacic A, Roessner U. Mass spectrometry imaging for plant biology: a review. Phytochemistry Reviews. 2016;15:445–488. doi: 10.1007/s11101-015-9440-2. [DOI] [PMC free article] [PubMed] [Google Scholar]
- 4.Gessel MM, Norris JL, Caprioli RM. MALDI imaging mass spectrometry: Spatial molecular analysis to enable a new age of discovery. Journal of proteomics. 2014;107C:71–82. doi: 10.1016/j.jprot.2014.03.021. [DOI] [PMC free article] [PubMed] [Google Scholar]
- 5.Gode D, Volmer DA. Lipid imaging by mass spectrometry - a review. The Analyst. 2013;138:1289–1315. doi: 10.1039/c2an36337b. [DOI] [PubMed] [Google Scholar]
- 6.Nilsson A, Goodwin RJ, Shariatgorji M, Vallianatou T, Webborn PJ, Andrén PE. Mass spectrometry imaging in drug development. Analytical chemistry. 2015;87:1437–1455. doi: 10.1021/ac504734s. [DOI] [PubMed] [Google Scholar]
- 7.Murray KK, Seneviratne CA, Ghorai S. High resolution laser mass spectrometry bioimaging. Methods. 2016;104:118–126. doi: 10.1016/j.ymeth.2016.03.002. [DOI] [PMC free article] [PubMed] [Google Scholar]
- 8.Riedl MJ. Optical design fundamentals for infrared systems. SPIE press; 2001. [Google Scholar]
- 9.Alkelly AA. Spot size and radial intensity distribution of focused Gaussian beams in spherical and non-spherical aberration lenses. Optics communications. 2007;277:397–405. [Google Scholar]
- 10.Zavalin A, Yang J, Caprioli R. Laser Beam Filtration for High Spatial Resolution MALDI Imaging Mass Spectrometry. Journal of the American Society for Mass Spectrometry. 2013;24:1153–1156. doi: 10.1007/s13361-013-0638-5. [DOI] [PMC free article] [PubMed] [Google Scholar]
- 11.Jacobson RS, Thurston RL, Shrestha B, Vertes A. In Situ Analysis of Small Populations of Adherent Mammalian Cells Using Laser Ablation Electrospray Ionization Mass Spectrometry in Transmission Geometry. Analytical chemistry. 2015;87:12130–12136. doi: 10.1021/acs.analchem.5b02971. [DOI] [PubMed] [Google Scholar]
- 12.Römpp A, Schäfer KC, Guenther S, Wang Z, Köstler M, Leisner A, Paschke C, Schramm T, Spengler B. High-resolution atmospheric pressure infrared laser desorption/ionization mass spectrometry imaging of biological tissue. Analytical and bioanalytical chemistry. 2013;405:6959–6968. doi: 10.1007/s00216-013-7180-y. [DOI] [PubMed] [Google Scholar]
- 13.Hieta JP, Vaikkinen A, Auno S, Räikkönen H, Haapala M, Scotti G, Kopra J, Piepponen P, Kauppila TJ. Journal of the American Society for Mass Spectrometry. 2017. A Simple Method for Improving the Spatial Resolution in Infrared Laser Ablation Mass Spectrometry Imaging. [DOI] [PubMed] [Google Scholar]
- 14.Jurchen JC, Rubakhin SS, Sweedler JV. MALDI-MS imaging of features smaller than the size of the laser beam. Journal of the American Society for Mass Spectrometry. 2005;16:1654–1659. doi: 10.1016/j.jasms.2005.06.006. [DOI] [PubMed] [Google Scholar]
- 15.Nazari M, Muddiman D. Cellular-level mass spectrometry imaging using infrared matrix-assisted laser desorption electrospray ionization (IR-MALDESI) by oversampling. Analytical and bioanalytical chemistry. 2015;407:2265–2271. doi: 10.1007/s00216-014-8376-5. [DOI] [PMC free article] [PubMed] [Google Scholar]
- 16.Luxembourg SL, McDonnell LA, Mize TH, Heeren RMA. Infrared Mass Spectrometric Imaging below the Diffraction Limit. Journal of proteome research. 2005;4:671–673. doi: 10.1021/pr049762+. [DOI] [PubMed] [Google Scholar]
- 17.Soltwisch J, Göritz G, Jungmann JH, Kiss A, Smith DF, Ellis SR, Heeren RMA. MALDI Mass Spectrometry Imaging in Microscope Mode with Infrared Lasers: Bypassing the Diffraction Limits. Analytical chemistry. 2014;86:321–325. doi: 10.1021/ac403421v. [DOI] [PubMed] [Google Scholar]
- 18.Sampson JS, Hawkridge AM, Muddiman DC. Generation and detection of multiply-charged peptides and proteins by matrix-assisted laser desorption electrospray ionization (MALDESI) Fourier transform ion cyclotron resonance mass spectrometry. Journal of the American Society for Mass Spectrometry. 2006;17:1712–1716. doi: 10.1016/j.jasms.2006.08.003. [DOI] [PubMed] [Google Scholar]
- 19.Robichaud G, Barry JA, Garrard KP, Muddiman DC. Infrared matrix-assisted laser desorption electrospray ionization (IR-MALDESI) imaging source coupled to a FT-ICR mass spectrometer. Journal of the American Society for Mass Spectrometry. 2013;24:92–100. doi: 10.1007/s13361-012-0505-9. [DOI] [PMC free article] [PubMed] [Google Scholar]
- 20.Bokhart MT, Muddiman DC. Infrared matrix-assisted laser desorption electrospray ionization mass spectrometry imaging analysis of biospecimens. The Analyst. 2016;141:5236–5245. doi: 10.1039/c6an01189f. [DOI] [PMC free article] [PubMed] [Google Scholar]
- 21.Robichaud G, Barry JA, Muddiman DC. IR-MALDESI mass spectrometry imaging of biological tissue sections using ice as a matrix. Journal of the American Society for Mass Spectrometry. 2014;25:319–328. doi: 10.1007/s13361-013-0787-6. [DOI] [PMC free article] [PubMed] [Google Scholar]
- 22.Rosen E, Bokhart M, Ghashghaei HT, Muddiman D. Influence of Desorption Conditions on Analyte Sensitivity and Internal Energy in Discrete Tissue or Whole Body Imaging by IR-MALDESI. Journal of the American Society for Mass Spectrometry. 2015;26:899–910. doi: 10.1007/s13361-015-1114-1. [DOI] [PMC free article] [PubMed] [Google Scholar]
- 23.Kessner D, Chambers M, Burke R, Agus D, Mallick P. ProteoWizard: open source software for rapid proteomics tools development. Bioinformatics. 2008;24:2534–2536. doi: 10.1093/bioinformatics/btn323. [DOI] [PMC free article] [PubMed] [Google Scholar]
- 24.Schramm T, Hester A, Klinkert I, Both JP, Heeren RM, Brunelle A, Laprevote O, Desbenoit N, Robbe MF, Stoeckli M, Spengler B, Rompp A. imzML--a common data format for the flexible exchange and processing of mass spectrometry imaging data. Journal of proteomics. 2012;75:5106–5110. doi: 10.1016/j.jprot.2012.07.026. [DOI] [PubMed] [Google Scholar]
- 25.Race AM, Styles IB, Bunch J. Inclusive sharing of mass spectrometry imaging data requires a converter for all. Journal of proteomics. 2012;75:5111–5112. doi: 10.1016/j.jprot.2012.05.035. [DOI] [PubMed] [Google Scholar]
- 26.Robichaud G, Garrard KP, Barry JA, Muddiman DC. MSiReader: an open-source interface to view and analyze high resolving power MS imaging files on Matlab platform. Journal of the American Society for Mass Spectrometry. 2013;24:718–721. doi: 10.1007/s13361-013-0607-z. [DOI] [PMC free article] [PubMed] [Google Scholar]
- 27.Keicher DM. Laser beam characterization results for a high-power cw Nd: YAG laser. Photonics West'95. 1995:162–171. [Google Scholar]
- 28.Bokhart M, Rosen E, Thompson C, Sykes C, Kashuba AM, Muddiman D. Quantitative mass spectrometry imaging of emtricitabine in cervical tissue model using infrared matrix-assisted laser desorption electrospray ionization. Analytical and bioanalytical chemistry. 2015;407:2073–2084. doi: 10.1007/s00216-014-8220-y. [DOI] [PMC free article] [PubMed] [Google Scholar]
- 29.Rosen EP, Bokhart MT, Nazari M, Muddiman DC. Influence of C-Trap Ion Accumulation Time on the Detectability of Analytes in IR-MALDESI MSI. Analytical chemistry. 2015;87:10483–10490. doi: 10.1021/acs.analchem.5b02641. [DOI] [PMC free article] [PubMed] [Google Scholar]
- 30.Meier F, Garrard KP, Muddiman DC. Silver dopants for targeted and untargeted direct analysis of unsaturated lipids via infrared matrix-assisted laser desorption electrospray ionization (IR-MALDESI) Rapid Communications in Mass Spectrometry. 2014;28:2461–2470. doi: 10.1002/rcm.7041. [DOI] [PMC free article] [PubMed] [Google Scholar]
- 31.Nazari M, Muddiman DC. Polarity switching mass spectrometry imaging of healthy and cancerous hen ovarian tissue sections by infrared matrix-assisted laser desorption electrospray ionization (IR-MALDESI) The Analyst. 2016;141:595–605. doi: 10.1039/c5an01513h. [DOI] [PMC free article] [PubMed] [Google Scholar]
Associated Data
This section collects any data citations, data availability statements, or supplementary materials included in this article.
Supplementary Materials
ESM1. Beam profile of the opolette OPO IR laser at 2940 nm measured using a Pyrocam IIIHR profiling camera. Circles represent the energy profile transmitted at each iris setting; 2 mm (black), 4 mm (white), and 12 mm (gold). A 12 mm iris setting is effectively 6.8 mm diameter due to beam clipping of the 1″ optics of the 3.75× beam expander and absorption of laser energy in the lens tube wall.
ESM2. A laser burn spot was recorded on laser burn paper at the specified z positions for the single focusing lens. A 10× objective was used to take an optical image of each burn spot, and fit with an ellipse in MATLAB. The ellipse major and minor axes were converted into μm using a microscope micrometer.
ESM3. A laser burn spot was recorded on laser burn paper at the specified z positions for the multi-element optical design. A 10× objective was used to take an optical image of each burn spot, and fit with an ellipse in MATLAB. The ellipse major and minor axes were converted into μm using a microscope micrometer.
ESM4. Mass measurement accuracy (MMA) of cholesterol MSI presented in figure 6. RAW files were loaded into RawMeat (Vast Scientific) and exported using MZ monitor. MMA was calculated for every cholesterol peak and a histogram was created using 0.1 ppm bin size.
ESM5. An attenuator was placed in the laser beam path before the iris to precisely control the average fluence with each iris setting. The polarization-based attenuator was rotated from 0-90° in increments of 10°. The above plot displays a series of points for the three iris settings investigated with varying attenuation, allowing experiments to be ran with different iris diameters while maintaining constant fluency.