Abstract
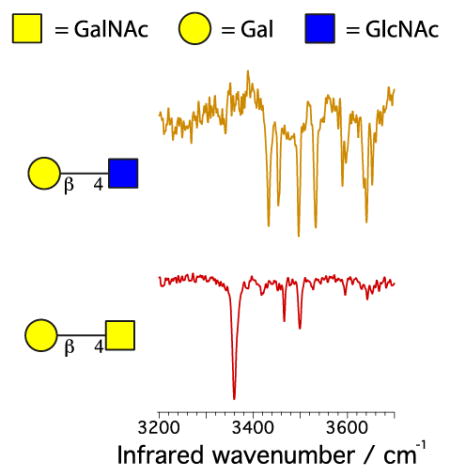
The structural characterization of glycans by mass spectrometry is particularly challenging. This is due to the high degree of isomerism in which glycans of the same mass can differ in their stereochemistry, attachment points, and degree of branching. Here we show that the addition of cryogenic vibrational spectroscopy to mass and mobility measurements allows one to uniquely identify and characterize these complex biopolymers. We investigate six disaccharide isomers that differ in their stereochemistry, attachment point of the glycosidic bond, and monosaccharide content, and demonstrate that we can identify each one unambiguously. Even disaccharides that differ by a single stereogenic center or in the monosaccharide sequence order show distinct vibrational fingerprints that would clearly allow their identification in a mixture, which is not possible by ion mobility/mass spectrometry alone. Moreover, this technique can be applied to larger glycans, which we demonstrate by distinguishing isomeric branched and linear pentasaccharides. The creation of a database containing mass, collisional cross section and vibrational fingerprint measurements for glycan standards should allow unambiguous identification and characterization of these biopolymers in mixtures, providing an enabling technology for all fields of glycoscience.
Graphical Abstract
Introduction
Glycans, which are biopolymers made up of monosaccharide units linked by glycosidic bonds, are ubiquitous in biological systems. Because they decorate the surface of cells, they play a central role in virtually all cellular recognition processes and are directly implicated in almost every major disease [1, 2]. The structural characterization of glycans is thus of utmost importance [3–5]. However, primary structure determination of glycans presents particular challenges for mass-spectrometric techniques [6–10]. Unlike linear sequences of monomers with distinct mass as found in proteins and DNA, many of the monosaccharide building blocks of glycans are isomeric, differing only in the stereochemistry of the asymmetric carbon atoms. In addition, the carbon atom of the glycosidic bond linking monosaccharide sub-units is also asymmetric, leading to isomeric α and β anomers. Moreover, two monosaccharides can have different attachment points, leading to different regioisomers. Because of their ability to support different linkage positions, a single monosaccharide unit can have multiple glycosidic bonds, leading to the formation of branched structures, which are isomeric with the corresponding linear chains of the same monosaccharide content. Finally, the large number of OH groups allow glycans to be functionalized at different locations without any difference in mass. For all these reasons, the structural characterization of glycans by mass spectrometry is substantially more complicated than that of proteins.
Mass spectrometry (MS)-based sequencing techniques, which rely on accurate measurements of the precursor ion mass and those of fragments produced either enzymatically in solution or by tandem MS (MS/MS), cannot easily determine the stereochemistry, monosaccharide content, and linkage positions of a glycan molecule. Information on such subtle structural details is only obtained after extensive sample preparation steps involving various enzymes and multistep MS/MS analyses. The fragmentation spectra obtained after such analyses are extremely complex and difficult to interpret. Moreover, only a limited set of enzymes that can selectively cut glycans after specific sequences is available. Because of these complicating factors, several groups have focused on using ion mobility spectrometry (IMS) [11–21] in combination with mass spectrometry (MS) to characterize the structure of glycans. The mobility of an ion through a gas is related to its orientationally averaged collisional cross section (CCS), which reflects its overall shape. While in some cases the structures of different isomeric glycan species can be distinguished by their CCS, in many others cases the structural differences are too subtle to detect in this way [13]. To solve this fundamental problem, one needs to add an orthogonal dimension to these measurements that will allow the discrimination between any pair of isomeric glycans.
One possibility is to add a spectroscopic dimension to IMS-MS to achieve this discrimination, as was recently demonstrated for peptides [22]. Along these lines, Hernandez et al. [23] combined differential IMS (DIMS) with infrared multi-photon dissociation (IRMPD) spectroscopy to study mono-hydrated, methylated monosaccharides. While they demonstrated small differences in the IR spectrum of α and β anomers, the low resolution of DIMS is unlikely to be able to separate larger species. Polfer and co-workers [24, 25] successfully combined IRMPD with high-resolution MS for the identification of disaccharides, but the room temperature IRMPD spectra were too broad to uniquely identify isomeric disaccharides in a mixture. Compagnion and co-workers [26, 27] have recently implemented a similar approach. In a very recent paper, Mucha et al. [28] used helium droplets to obtain spectroscopic fingerprints of oligosaccharides, showing that sufficiently resolved spectra could indeed distinguish the various types of isomerism, albeit with an admittedly complex experimental set-up. In the present work, we use messenger-tagging infrared spectroscopy in a cryogenic ion trap in combination with IMS-MS to identify and characterize glycans. The addition of the high-resolution spectroscopic dimension to mass and CCS measurements allows us to uniquely distinguish isomeric glycans that differ either by their stereochemistry, linkage points, monosaccharide content, or primary sequence. The ultimate aim of this work is to acquire such data for standard glycans of known structure and create a database that can be further used to determine the composition of an unknown sample or mixture.
Experimental Methods
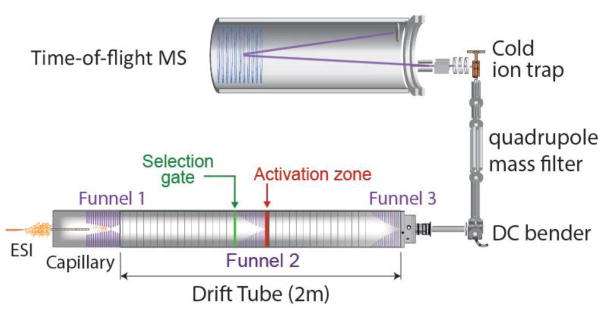
To achieve a vibrational spectrum of sufficiently high resolution, we use a unique instrument of our own design, shown schematically in Fig. 1, in which we couple cryogenic, messenger-tagging spectroscopy in an ion trap with drift-tube IMS-MS [22].
Figure 1.
Schematic of our hybrid instrument, which combines an electrospray ion source with an IMS drift tube, a cryogenic ion trap, and a TOF mass spectrometer, to measure the glycan mass, its average cross section, and its infrared spectrum.
Glycan molecules complexed with a sodium ion are transferred to the gas phase using nano-electrospray. They are drawn into vacuum through an ion funnel and injected into a 2-meter drift tube, where we measure their drift time, which is related to their collisional cross section. The center part of the drift tube is equipped with a selection region where ions of a defined mobility can be selected and allowed to travel through the remainder of the instrument. The mobility-selected glycans, complexed with sodium, are then mass-selected using a quadrupole mass filter before being injected into a planar, cold ion trap, where they are confined and cooled by collisions with a cold buffer gas, in this case either hydrogen or nitrogen. The cold environment of the trap permits the formation of clusters in which the ion of interest is “tagged” with one or more messenger molecules [29]. Once the glycan ions are cooled, trapped and tagged, we extract them and interrogate the ion packet with an infrared laser pulse generated from a Nd:YAG-pumped OPO. If one of the tagged ions absorbs an infrared photon, the vibrational energy will redistribute within the molecule, heating it up and leading to the evaporation of the tag(s). Using a time-of-flight (TOF) mass spectrometer, we monitor the number of tagged ions as a function of the laser frequency, yielding a mass- and mobility-selected vibrational spectrum of the glycan. We thus characterize each glycan by three physical measurements: 1) its mass; 2) its rotationally averaged collisional cross section (CCS) from its drift time; and 3) its linear, high-resolution, infrared spectrum.
We have defined a protocol for data acquisition to help make such measurements reproducible across different laboratories and different instruments. The first aspect of this protocol is to produce the ions in the form of complexes with sodium cation in the gas phase. There are several practical reasons for this. First, protonation of glycans is generally difficult to achieve unless an amino-monosaccharide is present in the sequence, which may or may not be the case, while cationization with sodium is universal. Secondly, sodium cations are naturally present in biological samples and glycans tend to easily complex with it. Finally, the metal cation forms bonds with some of the hydroxyl groups of the glycan and shifts their vibrational bands outside the frequencies region of the infrared laser, simplifying the remaining spectroscopic signature.
A second aspect of our protocol involves making sure that the distribution of 3-dimensional conformations that a glycan adopts in the gas phase is always the same, as this will influence the vibrational spectrum that we measure. Both ion mobility spectrometry and cryogenic ion spectroscopy have shown that ions can adopt multiple stable conformations in the gas phase, some of which may be kinetically trapped [22, 30–33]. For this reason, we choose to anneal all the conformations produced in the nano-ESI process, driving them to the lowest energy gas-phase structure(s) before measuring the CCS and the vibrational spectrum (see supporting information). In this way, our results can be reproduced without being concerned about the gentleness of the ion source to preserve kinetically trapped conformations. It should be noted that we are not attempting to determine the 3-dimensional structure of unknown glycans with this approach, but rather to make reproducible measurements that allow us to identify them from a mixture by comparing their mass, CCS and vibrational spectrum with a database.
All the glycans used in our studies were purchased from Carbosynth and used without further purification (minimum purity guaranteed from the company 95%). Solutions containing each glycan were prepared at a concentration of 200–500 μM in a 50:50 solution of HPSC methanol (VWR Chemicals):nuclease-free water (Ambion) with a similar concentration of sodium chloride.
Results and discussion
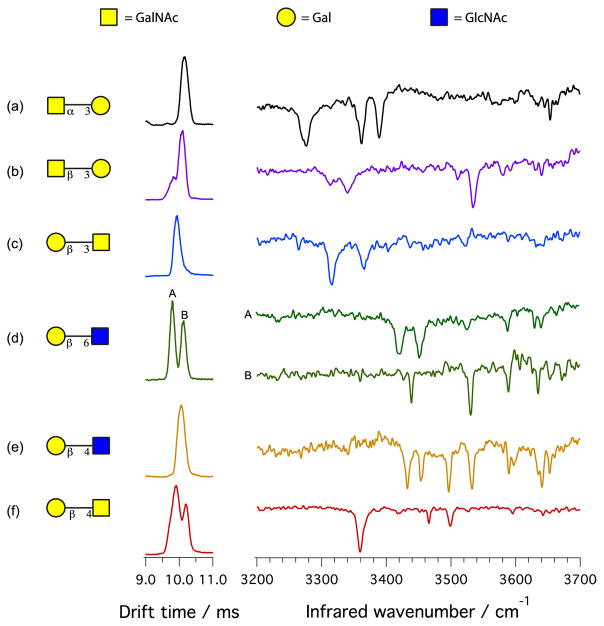
To demonstrate that our technique is able to identify and characterize glycans, we performed proof-of-principle experiments on six standard isomeric disaccharides of known composition, stereochemistry and primary structure, as depicted in Fig. 2. Their drift-time distributions overlap, making them virtually indistinguishable by ion mobility, as reported previously for glycans of this size [13]. We then measured their vibrational spectra, using hydrogen as the tag molecule and keeping the trap temperature at 13 K. As one can see in Fig. 2, the vibrational fingerprints for these different disaccharides are radically different from each other, providing a robust method for identification purposes.
Figure 2.
Drift times and infrared spectra for six isomeric disaccharides. The structure of glycans is shown using the UOXF nomenclature [34]. Each disaccharide is complexed with a sodium cation, which is not shown in this representation. The (*) in the drift time distribution represents species with a mass different from the disaccharide.
Figures 2a and 2b compare the infrared spectra of the disaccharides GalNAcα(1–3)Gal and GalNAcβ(1–3)Gal, which are isomeric anomers with different stereochemistry of the glycosidic bond, but contain the same monosaccharide content and order. Their vibrational signatures are fairly simple: GalNAcα(1–3)Gal shows major peaks at 3275 cm−1, 3361 cm−1, and 3388 cm−1. These lines are clearly not present in the spectrum of GalNAcβ(1–3)Gal, which exhibits broader peaks at 3313 cm−1 and 3339 cm−1, reflecting the presence of stronger hydrogen bonding interactions in the β anomer, and a sharp peak at 3533 cm−1. This result demonstrates that infrared spectroscopy can distinguish the anomeric configuration.
Traces d and e of Fig. 2 show the infrared signatures of the disaccharides Galβ(1–6)GlcNAc and Galβ(1–4)GlcNAc, which only differ by the attachment point of the glycosidic bond. One can see from the drift time distribution that Galβ(1–6)GlcNAc exhibits two stable conformations, and these do not interconvert upon annealing. This is likely due to the presence of two different complexation sites for the sodium cation. The infrared spectra of these two conformers are different: conformer A (i.e., the one with shorter drift time) shows main transitions at 3421 cm−1 and 3452 cm−1, while those of conformer B appear at 3438 cm−1 and 3530 cm−1. Both of these spectra are clearly different than that of Galβ(1–4)GlcNAc, which exhibits intense lines at 3432 cm−1 and 3496 cm−1. This observation demonstrates the ability of infrared spectroscopy to distinguish between regioisomers.
In Fig. 2e and 2f we compare the spectrum of Galβ(1–4)GlcNAc with that of Galβ(1–4)GalNAc, molecules that differ only by the orientation of a single stereogenic center. Even in this case, the vibrational spectra for the two species are clearly different and easily identified: Galβ(1–4)GalNAc shows two features at 3358 cm−1 and 3464 cm−1 that are distinct from Galβ(1–4)GlcNAc. Finally, to test whether our method is able to identify disaccharides with the same monosaccharide content but different sequence order, we compare the spectrum of the disaccharide GalNAcβ(1–3)Gal and its reverse sequence Galβ(1–3)GalNAc (Figs 2b and 2c). Once again, the vibrational fingerprints are radically different.
These experiments clearly demonstrate that the high-resolution infrared spectrum, together with mobility and mass measurements, can easily distinguish the subtle differences between isomeric disaccharides. This result would be difficult to achieve by applying mass spectrometry or ion mobility alone, or even by a combination of the two.
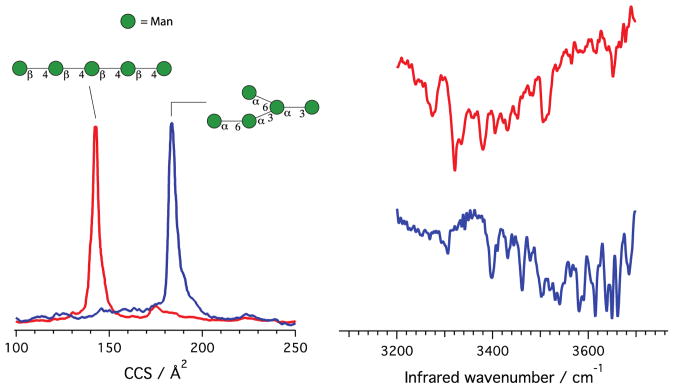
After having demonstrated the principle of using our methodology to identify disaccharides, we now show its capability to distinguish larger isomeric species. We chose to analyze two mannose-based pentasaccharides with different shapes: 1,4-β-D-Mannopentaose, which is linear, and α1–3[α1–6] α1–6[α1–3]Mannopentaose, which is branched (see Fig. 3). The CCS values of the glycans complexed with sodium, reported in Fig. 3, are Ω = 142 Å2 for the linear molecule and Ω = 183 Å2 for the branched species. The smaller CCS for the linear pentasaccharide suggests that it wraps itself around the sodium cation, forming a cluster that has a more compact shape compared to its isomeric branched partner.
Figure 3.
Collisional cross section and infrared spectroscopic fingerprint for a linear and a branched isomeric pentasaccharide. In this case, N2 was used as the messenger tag. The structure of glycans is shown using the UOXF nomenclature [34]. Both pentasaccharides are complexed with a sodium cation, which is not shown in this representation.
We find that tagging these molecules with N2 rather than H2 increases the stability of the signal and hence the signal-to-noise ratio, allowing us to reduce the acquisition time and obtain better resolved spectra. The nitrogen-tagged vibrational fingerprints for the linear 1,4-β-D-Mannopentaose and the branched α1–3[α1–6] α1–6[α1–3]Mannopentaose, obtained with the ion trap at 42 K, are shown in Fig. 3. As in the case of the disaccharides, the spectra are markedly different for the two species, though more congested because of the increased number of OH oscillators. Despite this spectral congestion, the spectroscopic fingerprints of the linear and branched glycans, together with their measured collision cross sections, allow us to distinguish between them. The peaks at 3321 cm−1, 3378 cm−1, and 3351 cm−1 for the linear species do not appear in the branched species, which exhibits unique features at 3396 cm−1, 3461 cm−1, and 3579 cm−1. Moreover, the overall intensity pattern of the spectra is clearly different.
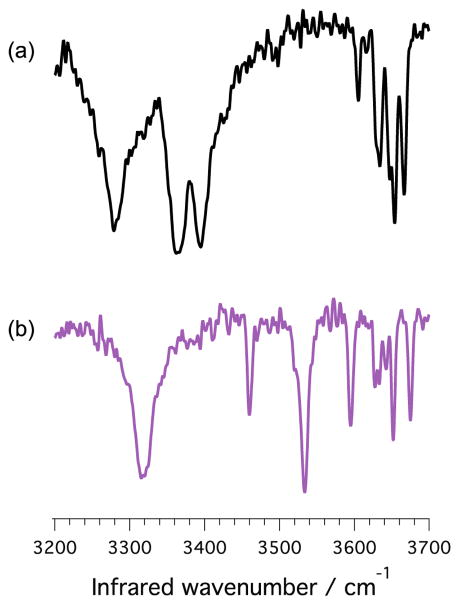
This experiment led us to tag all molecules with nitrogen rather than hydrogen, as N2 binds more strongly to the charged molecule due to its higher polarizability and allows operating the ion trap near liquid nitrogen temperature. The only question is whether tagging with N2 at higher temperature will give us similarly well-resolved spectra. Figure 4 shows the vibrational spectra of GalNAcα(1–3)Gal and GalNAcβ(1–3)Gal tagging with nitrogen at 69 K. For both species, the spectra exhibit similarly sharp bands with small differences in peak positions as compared to the corresponding H2 tagging spectra (Fig. 2 traces a and b respectively), indicating that nitrogen works equally well as a tagging gas, and that the ion trap could be cooled by liquid nitrogen. This result should allow the simplification of instruments able to combine ion mobility with IR tagging spectroscopy, making this technique more widely accessible.
Figure 4.
Infrared signatures for the α (trace a) and β (trace b) isomers of GalNAc(1–3)Gal recorded at a temperature of 69 K using N2 as a messenger tag. The difference in the spectral fingerprint of these two molecules is clearly maintained at near liquid nitrogen temperature.
Conclusion
In this work, we show that the addition of cryogenic vibrational spectroscopy using a table-top laser to high-resolution ion mobility and mass spectrometry provides a powerful method to identify glycans. These proof-of-principle experiments demonstrate that we can successfully identify six isomeric disaccharides, proving that this technique is sensitive enough to distinguish compositional isomers, which is a difficult challenge for most MS and IMS-based techniques [10]. We have also shown that this methodology can be applied to glycans of larger size. This will allow us to produce a database of vibrational fingerprints, collisional cross sections and masses for direct glycan identification without the need of chemical derivatization. Moreover, the ability to perform such experiments close to liquid nitrogen temperature should make this technique more broadly accessible. Finally, when combined with selective enzymatic hydrolysis schemes [35], our approach should allow the structural characterization of unknown glycans and their incorporation into our database.
Supplementary Material
Figure S1 – Arrival-time distribution of Gal β(1–6) GlcNAc. The black trace shows the drift time distribution of the source. The red and blue traces are the arrival time of the ions for conformers A and B.
Figure S2 - Infrared spectra of GalNAc α(1–3)Gal. The black trace was recorded on our ion-mobility setup using H2 as tag, and the blue trace was recorded on tandem mass spectrometer setup using He as tag.
Acknowledgments
TRR would like to thank the EPFL and the Swiss National Science Foundation (grant number 200020_165908) for their financial support of this work. DEC would like to thank the National Institutes of Health for partial support of this work through grant (R01 GM103725). NK was supported by a Robert & Marjorie Mann Fellowship from Indiana University.
References
- 1.Varki A, Cummings RD, Esko JD, et al. Essentials of Glycobiology. 2. Cold Spring Harbor (NY): 2009. [PubMed] [Google Scholar]
- 2.Transforming Glycoscience: A Roadmap for the Future. The National Academies Press; Washington, D.C: 2012. [PubMed] [Google Scholar]
- 3.Varki A. Biological roles of oligosaccharides: all of the theories are correct. Glycobiology. 1993;3:97–130. doi: 10.1093/glycob/3.2.97. [DOI] [PMC free article] [PubMed] [Google Scholar]
- 4.Hounsell EF, Davies MJ, Renouf DV. O-linked protein glycosylation structure and function. Glycoconj J. 1996;13:19–26. doi: 10.1007/BF01049675. [DOI] [PubMed] [Google Scholar]
- 5.Dennis JW, Granovsky M, Warren CE. Protein glycosylation in development and disease. Bioessays. 1999;21:412–421. doi: 10.1002/(SICI)1521-1878(199905)21:5<412::AID-BIES8>3.0.CO;2-5. [DOI] [PubMed] [Google Scholar]
- 6.Han L, Costello CE. Mass spectrometry of glycans. Biochemistry (Moscow) 2013;78:710–720. doi: 10.1134/S0006297913070031. [DOI] [PMC free article] [PubMed] [Google Scholar]
- 7.Yu X, Jiang Y, Chen Y, Huang Y, Costello CE, Lin C. Detailed glycan structural characterization by electronic excitation dissociation. Anal Chem. 2013;85:10017–10021. doi: 10.1021/ac402886q. [DOI] [PMC free article] [PubMed] [Google Scholar]
- 8.Han L, Costello CE. Electron transfer dissociation of milk oligosaccharides. J Am Soc Mass Spectrom. 2011;22:997–1013. doi: 10.1007/s13361-011-0117-9. [DOI] [PMC free article] [PubMed] [Google Scholar]
- 9.Ren R, Hong Z, Gong H, Laporte K, Skinner M, Seldin DC, Costello CE, Connors LH, Trinkaus-Randall V. Role of glycosaminoglycan sulfation in the formation of immunoglobulin light chain amyloid oligomers and fibrils. J Biol Chem. 2010;285:37672–37682. doi: 10.1074/jbc.M110.149575. [DOI] [PMC free article] [PubMed] [Google Scholar]
- 10.Kailemia MJ, Ruhaak LR, Lebrilla CB, Amster IJ. Oligosaccharide Analysis by Mass Spectrometry: A Review of Recent Developments. Analytical Chemistry. 2014;86:196–212. doi: 10.1021/ac403969n. [DOI] [PMC free article] [PubMed] [Google Scholar]
- 11.Hofmann J, Hahm HS, Seeberger PH, Pagel K. Identification of carbohydrate anomers using ion mobility-mass spectrometry. Nature. 2015;526:241-+. doi: 10.1038/nature15388. [DOI] [PubMed] [Google Scholar]
- 12.Pagel K, Harvey DJ. Ion Mobility-Mass Spectrometry of Complex Carbohydrates: Collision Cross Sections of Sodiated N-linked Glycans. Analytical Chemistry. 2013;85:5138–5145. doi: 10.1021/ac400403d. [DOI] [PubMed] [Google Scholar]
- 13.Gaye MM, Kurulugama R, Clemmer DE. Investigating carbohydrate isomers by IMS-CID-IMS-MS: precursor and fragment ion cross-sections. Analyst. 2015;140:6922–6932. doi: 10.1039/c5an00840a. [DOI] [PubMed] [Google Scholar]
- 14.Gaye MM, Nagy G, Clemmer DE, Pohl NL. Multidimensional Analysis of 16 Glucose Isomers by Ion Mobility Spectrometry. Anal Chem. 2016;88:2335–2344. doi: 10.1021/acs.analchem.5b04280. [DOI] [PubMed] [Google Scholar]
- 15.Isailovic D, Plasencia MD, Gaye MM, Stokes ST, Kurulugama RT, Pungpapong V, Zhang M, Kyselova Z, Goldman R, Mechref Y, Novotny MV, Clemmer DE. Delineating diseases by IMS-MS profiling of serum N-linked glycans. J Proteome Res. 2012;11:576–585. doi: 10.1021/pr200777u. [DOI] [PMC free article] [PubMed] [Google Scholar]
- 16.Zhu F, Lee S, Valentine SJ, Reilly JP, Clemmer DE. Mannose7 glycan isomer characterization by IMS-MS/MS analysis. J Am Soc Mass Spectrom. 2012;23:2158–2166. doi: 10.1007/s13361-012-0491-y. [DOI] [PMC free article] [PubMed] [Google Scholar]
- 17.Seo Y, Andaya A, Leary JA. Preparation, separation, and conformational analysis of differentially sulfated heparin octasaccharide isomers using ion mobility mass spectrometry. Anal Chem. 2012;84:2416–2423. doi: 10.1021/ac203190k. [DOI] [PMC free article] [PubMed] [Google Scholar]
- 18.Both P, Green AP, Gray CJ, Sardzik R, Voglmeir J, Fontana C, Austeri M, Rejzek M, Richardson D, Field RA, Widmalm G, Flitsch SL, Eyers CE. Discrimination of epimeric glycans and glycopeptides using IM-MS and its potential for carbohydrate sequencing. Nat Chem. 2014;6:65–74. doi: 10.1038/nchem.1817. [DOI] [PubMed] [Google Scholar]
- 19.Williams JP, Grabenauer M, Holland RJ, Carpenter CJ, Wormald MR, Giles K, Harvey DJ, Bateman RH, Scrivens JH, Bowers MT. Characterization of simple isomeric oligosaccharides and the rapid separation of glycan mixtures by ion mobility mass spectrometry. International Journal of Mass Spectrometry. 2010;298:119–127. [Google Scholar]
- 20.Fenn LS, McLean JA. Structural resolution of carbohydrate positional and structural isomers based on gas-phase ion mobility-mass spectrometry. Phys Chem Chem Phys. 2011;13:2196–2205. doi: 10.1039/c0cp01414a. [DOI] [PubMed] [Google Scholar]
- 21.Zhu M, Bendiak B, Clowers B, Hill HH., Jr Ion mobility-mass spectrometry analysis of isomeric carbohydrate precursor ions. Anal Bioanal Chem. 2009;394:1853–1867. doi: 10.1007/s00216-009-2865-y. [DOI] [PMC free article] [PubMed] [Google Scholar]
- 22.Masson A, Kamrath MZ, Perez MA, Glover MS, Rothlisberger U, Clemmer DE, Rizzo TR. Infrared Spectroscopy of Mobility-Selected H+-Gly-Pro-Gly-Gly (GPGG) J Am Soc Mass Spectrom. 2015;26:1444–1454. doi: 10.1007/s13361-015-1172-4. [DOI] [PubMed] [Google Scholar]
- 23.Hernandez O, Isenberg S, Steinmetz V, Glish GL, Maitre P. Probing Mobility-Selected Saccharide Isomers: Selective Ion-Molecule Reactions and Wavelength-Specific IR Activation. J Phys Chem A. 2015;119:6057–6064. doi: 10.1021/jp511975f. [DOI] [PubMed] [Google Scholar]
- 24.Polfer NC, Valle JJ, Moore DT, Oomens J, Eyler JR, Bendiak B. Differentiation of isomers by wavelength-tunable infrared multiple-photon dissociation-mass spectrometry: Application to glucose-containing disaccharides. Analytical Chemistry. 2006;78:670–679. doi: 10.1021/ac0519458. [DOI] [PubMed] [Google Scholar]
- 25.Tan YL, Polfer NC. Linkage and Anomeric Differentiation in Trisaccharides by Sequential Fragmentation and Variable-Wavelength Infrared Photodissociation. Journal of the American Society for Mass Spectrometry. 2015;26:359–368. doi: 10.1007/s13361-014-1025-6. [DOI] [PubMed] [Google Scholar]
- 26.Gray CJ, Schindler B, Migas LG, Pičmanová M, Allouche AR, Green AP, Mandal S, Motawia MS, Sánchez-Pérez R, Bjarnholt N, Møller BL, Rijs AM, Barran PE, Compagnon I, Eyers CE, Flitsch SL. Bottom-Up Elucidation of Glycosidic Bond Stereochemistry. Analytical Chemistry. 2017;89:4540–4549. doi: 10.1021/acs.analchem.6b04998. [DOI] [PubMed] [Google Scholar]
- 27.Schindler B, Barnes L, Gray CJ, Chambert S, Flitsch SL, Oomens J, Daniel R, Allouche AR, Compagnon I. IRMPD Spectroscopy Sheds New (Infrared) Light on the Sulfate Pattern of Carbohydrates. Journal of Physical Chemistry A. 2017;121:2114–2120. doi: 10.1021/acs.jpca.6b11642. [DOI] [PubMed] [Google Scholar]
- 28.Mucha E, González Flórez AI, Marianski M, Thomas DA, Hoffmann W, Struwe WB, Hahm HS, Gewinner S, Schöllkopf W, Seeberger PH, von Helden G, Pagel K. Glycan Fingerprinting using Cold-Ion Infrared Spectroscopy. Angewandte Chemie International Edition. doi: 10.1002/anie.201702896. n/a-n/a. [DOI] [PubMed] [Google Scholar]
- 29.Kamrath MZ, Garand E, Jordan PA, Leavitt CM, Wolk AB, Van Stipdonk MJ, Miller SJ, Johnson MA. Vibrational characterization of simple peptides using cryogenic infrared photodissociation of H2-tagged, mass-selected ions. J Am Chem Soc. 2011;133:6440–6448. doi: 10.1021/ja200849g. [DOI] [PMC free article] [PubMed] [Google Scholar]
- 30.Pierson NA, Valentine SJ, Clemmer DE. Evidence for a Quasi-Equilibrium Distribution of States for Bradykinin [M + 3H]3+ Ions in the Gas Phase. The Journal of Physical Chemistry B. 2010;114:7777–7783. doi: 10.1021/jp102478k. [DOI] [PMC free article] [PubMed] [Google Scholar]
- 31.Papadopoulos G, Svendsen A, Boyarkin OV, Rizzo TR. Conformational Distribution of Bradykinin bk+2 H (2+) Revealed by Cold Ion Spectroscopy Coupled with FAIMS. Journal of the American Society for Mass Spectrometry. 2012;23:1173–1181. doi: 10.1007/s13361-012-0384-0. [DOI] [PubMed] [Google Scholar]
- 32.Rizzo TR, Stearns JA, Boyarkin OV. Spectroscopic studies of cold, gas-phase biomolecular ions. International Reviews in Physical Chemistry. 2009;28:481–515. [Google Scholar]
- 33.Stearns JA, Seaiby C, Boyarkin OV, Rizzo TR. Spectroscopy and conformational preferences of gas-phase helices. Physical Chemistry Chemical Physics. 2009;11:125–132. doi: 10.1039/b814143f. [DOI] [PubMed] [Google Scholar]
- 34.Harvey DJ, Merry AH, Royle L, Campbell MP, Dwek RA, Rudd PM. Proposal for a standard system for drawing structural diagrams of N- and O-linked carbohydrates and related compounds. Proteomics. 2009;9:3796–3801. doi: 10.1002/pmic.200900096. [DOI] [PubMed] [Google Scholar]
- 35.Marino K, Bones J, Kattla JJ, Rudd PM. A systematic approach to protein glycosylation analysis: a path through the maze. Nat Chem Biol. 2010;6:713–723. doi: 10.1038/nchembio.437. [DOI] [PubMed] [Google Scholar]
Associated Data
This section collects any data citations, data availability statements, or supplementary materials included in this article.
Supplementary Materials
Figure S1 – Arrival-time distribution of Gal β(1–6) GlcNAc. The black trace shows the drift time distribution of the source. The red and blue traces are the arrival time of the ions for conformers A and B.
Figure S2 - Infrared spectra of GalNAc α(1–3)Gal. The black trace was recorded on our ion-mobility setup using H2 as tag, and the blue trace was recorded on tandem mass spectrometer setup using He as tag.


