

Abstract
The disparity between rates of morphological and molecular evolution remains a key paradox in evolutionary genetics. A proposed resolution to this paradox has been the conjecture that morphological evolution proceeds via diversification in regulatory loci, and that phenotypic evolution may correlate better with regulatory gene divergence. This conjecture can be tested by examining rates of regulatory gene evolution in species that display rapid morphological diversification within adaptive radiations. We have isolated homologues to the Arabidopsis APETALA3 (ASAP3/TM6) and APETALA1 (ASAP1) floral regulatory genes and the CHLOROPHYLL A/B BINDING PROTEIN9 (ASCAB9) photosynthetic structural gene from species in the Hawaiian silversword alliance, a premier example of plant adaptive radiation. We have compared rates of regulatory and structural gene evolution in the Hawaiian species to those in related species of North American tarweeds. Molecular evolutionary analyses indicate significant increases in nonsynonymous relative to synonymous nucleotide substitution rates in the ASAP3/TM6 and ASAP1 regulatory genes in the rapidly evolving Hawaiian species. By contrast, no general increase is evident in neutral mutation rates for these loci in the Hawaiian species. An increase in nonsynonymous relative to synonymous nucleotide substitution rate is also evident in the ASCAB9 structural gene in the Hawaiian species, but not to the extent displayed in the regulatory loci. The significantly accelerated rates of regulatory gene evolution in the Hawaiian species may reflect the influence of allopolyploidy or of selection and adaptive divergence. The analyses suggest that accelerated rates of regulatory gene evolution may accompany rapid morphological diversification in adaptive radiations.
Keywords: floral regulatory loci, MADS-box, CAB9, Hawaiian silversword alliance
Rates of morphological evolution are generally not correlated with rates of molecular evolution. This paradoxical observation was highlighted early by Wilson and coworkers (1–3), and subsequent molecular studies in species groups that have undergone recent adaptive radiations, such as African rift lake cichlids (4), columbines (5), and the Hawaiian silversword alliance (6), have documented marked incongruities in rates of morphological and molecular evolution. A proposed resolution to this paradox has been the conjecture that evolutionary changes in regulatory genes, rather than large-scale diversification in structural genes, may be responsible for interspecific variation in organismal morphologies (1–3, 7–9). This conjecture is reinforced by molecular developmental studies that indicate that dramatic shifts in organismal structure may arise from mutations at key regulatory loci (7–9). One test of this conjecture is to examine whether there is a significant acceleration in rates of regulatory gene evolution in species that display rapid morphological diversification within adaptive radiations.
The Hawaiian silversword alliance (Asteraceae: Heliantheae—Madiinae) is a premier example of plant adaptive radiation (6, 10, 11). The silversword alliance comprises 30 perennial species in three endemic genera: Argyroxiphium, Dubautia, and Wilkesia. The species are distributed on six of the eight main islands of the Hawaiian archipelago (Kaua'i, O'ahu, Moloka'i, Lana'i, Maui, and Hawai'i), with all but five species being single-island endemics. Species in the silversword alliance grow in a wide range of habitats and exhibit a wide array of growth forms, including rosette plants, cushion plants, shrubs, trees, and lianas. They also display great variation in reproductive traits, especially in inflorescence and floral morphology and capitulescence (or flowering stalk) architecture. This is clearly evident in quantitative phenotypes, such as the numbers of flowers in the capitula, the numbers of capitula per flowering stalk, the architectural organization of flowering stalks, and the sizes and morphologies of floral organs (11). Even sibling species that appear to have diverged less than 500,000 years ago on the Island of Hawai'i display significant differences in quantitative inflorescence and floral characters (A. L. Lawton-Rauh, R.H.R., and M.D.P., unpublished observations).
Molecular phylogenetic analyses using chloroplast DNA and rDNA internal transcribed spacer (ITS) sequences (6, 10, 12) have confirmed an early hypothesis that the closest relatives of the Hawaiian silversword alliance can be found among North American tarweeds (Asteraceae: Heliantheae—Madiinae) in the “Madia” lineage (13). Both cytogenetic (14) and allozyme (15) data indicate that the Hawaiian species are tetraploids (n = 13–14), in contrast to the basally diploid condition (n = 6–9) in the most closely related North American species within the “Madia” lineage (13, 16). Results of our recent phylogenetic analyses using two floral homeotic genes have led us to conclude that the Hawaiian silversword alliance descended from an interspecific hybrid between members of the Anisocarpus scabridus and Carlquistia muirii lineages of North American tarweeds (16). Likelihood estimates based on sequence data from the rDNA ITS locus suggest that the most recent common ancestor of the Hawaiian species existed 5.2 ± 0.8 million years ago (mya), contemporaneous with the origin of the Island of Kaua'i (17). By contrast, the earliest date for the diversification of the North American tarweeds appears to be in the mid-Miocene, 15 mya (17).
We have isolated homologues to the Arabidopsis APETALA3 (ASAP3/TM6) and APETALA1 (ASAP1) floral regulatory genes and the CHLOROPHYLL A/B BINDING PROTEIN9 (ASCAB9) photosynthetic structural gene from species in the Hawaiian silversword alliance and from related species of North American tarweeds (16). Isolation of the genes from both the rapidly evolving Hawaiian species and their North American relatives provides an opportunity to compare rates of gene evolution between lineages that differ greatly in rates of morphological diversification. Molecular evolutionary analyses indicate significant increases in nonsynonymous relative to synonymous nucleotide substitution rates in the ASAP3/TM6 and ASAP1 regulatory genes in the rapidly evolving Hawaiian species. By contrast, no general increase is evident in neutral mutation rates for these loci in the Hawaiian species. An increase in nonsynonymous relative to synonymous nucleotide substitution rate is also evident in the ASCAB9 structural gene in the Hawaiian species, but not to the extent displayed in the regulatory loci. These results suggest that the adaptive radiation of the Hawaiian silversword alliance has been accompanied by accelerated rates of regulatory gene evolution, possibly resulting from allopolyploidy or from selection and adaptive divergence.
Materials and Methods
Isolation of Genes.
The ASAP3/TM6 and ASAP1 regulatory genes were isolated as described (16). The ASCAB9 structural gene was first identified as an expressed sequence tag (EST) in Argyroxiphium sandwicense subsp. macrocephalum. Ten Hawaiian species were selected to represent the four major lineages in the silversword alliance as previously identified from rDNA internal transcribed spacer (ITS) trees (6, 10, 16). Five North American tarweed species (A. scabridus, C. muirii, Harmonia nutans, Kyhosia bolanderi, and Madia sativa) were chosen from within the “Madia” lineage as identified from rDNA ITS trees (13). Six other North American tarweed species (Adenothamnus validus, Calycadenia multiglandulosa, Centromadia pungens, Deinandra lobbii, Osmadenia tenella, and Raillardella pringlei) known to fall outside the “Madia” lineage (13) were also included.
PCR primers to amplify ASAP3/TM6, ASAP1, and ASCAB9 genomic regions were designed based on cDNA sequences. The primers were used in PCR amplification reactions using the error-correcting rTth polymerase formulation (Perkin–Elmer) or Pwo polymerase (Boehringer Mannheim) in standard buffer with cycling conditions recommended by the manufacturer. The nucleotide error rate for these error-correcting polymerases is less than 1 bp in 7 kb of sequence (J. I. Suddith and M.D.P., unpublished observations). PCR-amplified DNA was cloned by using the TA cloning kit (Invitrogen) and sequenced by using automated sequencers (Iowa State University Sequencing Facility and North Carolina State University DNA Sequencing Facility). Sequencing was done with nested primers, with multiple sequencing reactions conducted for divergent sequences. All sequence changes were rechecked visually against sequencing chromatograms and deposited in the GenBank database (accession nos. AF147210–AF147258 and AF398723–AF398755).
Reverse Transcription (RT)-PCR Assay of Regulatory Gene Expression.
Total RNA was isolated from developing inflorescences (or capitula) of Dubautia arborea by using an RNA plant extraction kit (Qiagen, Chatsworth, CA). Poly(A+) RNA was purified from total RNA with the Oligotex suspension system (Qiagen), and oligo(dT)-primed first-strand cDNA was synthesized by using AMV reverse transcriptase (Promega). Products of the cDNA syntheses were used as a template in RT-PCR reactions using gene-specific primers. For ASAP3/TM6, a universal ASA3XF.1 forward primer (5′-TACAAACAGGCAGGTGACATAC-3′) in exon 1 and the A copy-specific ASAP3XRB.2 (5′-CTTCTAAGTTTATTGTTGCTC-3′) or B copy-specific ASAP3XRA.2 (5′-CTTCTAAGTTTGTTGTTGCTA-3′) reverse primers in exon 4 were used. For ASAP1, a universal ASAPXF.1 forward primer (5′-GAAACCACAGGCACTATATGGG-3′) spanning exons 3 and 4, and the A copy-specific ASAP1XAR.1 (5′-CGTTGCTTCTTCCGTCACCTCC-3′) or B copy-specific ASAP1XBR.1 (5′-CGTTGCTTCTTCCGTCACCTCG-3′) reverse primers in exon 8 were used (see Fig. 1). PCR amplification reaction conditions were 40 cycles of 95°C for 1 min, 52°C for 1 min, and 72°C for 1 min, using Taq polymerase (Promega). Products were diluted, fractionated on 1% agarose gels, and blotted on nylon filter membranes (Amersham Hybond, Piscataway, NJ). Gel blots were separately probed with 32P-labeled ASAP3/TM6 and ASAP1 gene probe mixtures.
Figure 1.

(A) Gene maps of ASAP3/TM6 and ASAP1 loci. Exons are shown as numbered boxes. The gene maps depicted are for the A copies of the loci. Upright and inverted triangles represent major deletions and insertions, respectively, that characterize the B duplicate copies. Numbers above the triangles provide the sizes of the indels. Arrows show positions of PCR primers used to isolate genomic sequences. Circles indicate approximate location of copy-specific RT-PCR primers used in gene expression assays. A 100-bp scale bar is provided. Relative sizes of exons and introns in the amplified regions were derived from comparison of genomic and cDNA sequences. Exon sizes outside the amplified regions are estimates based on comparison with data from A. thaliana orthologues. (B) Expression of the ASAP3/TM6 and ASAP1 floral regulatory genes in developing inflorescences of D. arborea. Expression was assayed with gene-specific primers (for the duplicate A and B copies) that amplified ≈300 nucleotides of cDNA in RT-PCR reactions. Control reactions using cloned A and B gene copies indicate the primers are copy-specific. Identity of amplified products was confirmed by sequencing.
Rate Analyses.
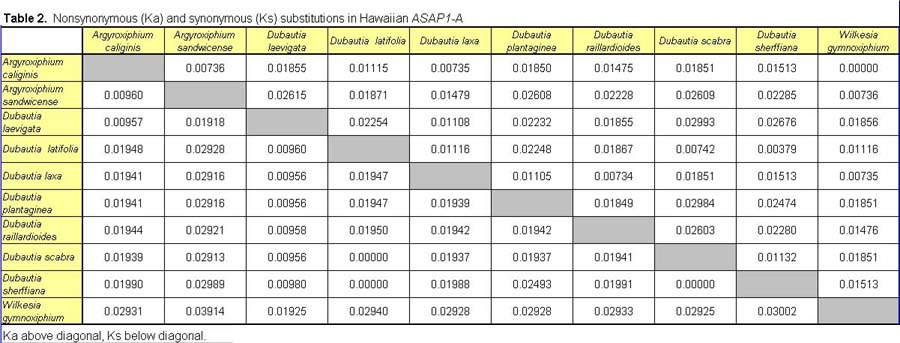
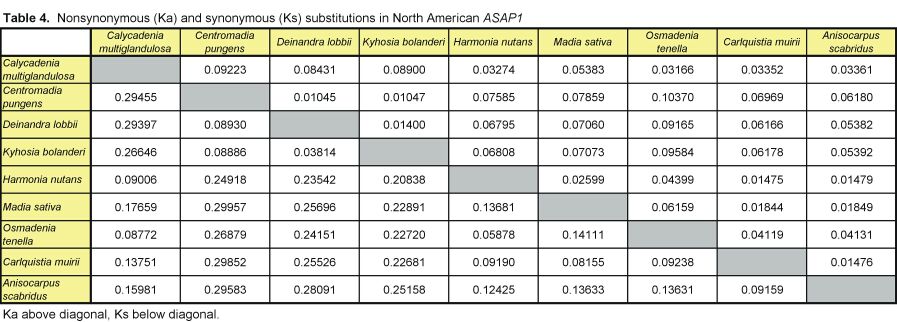
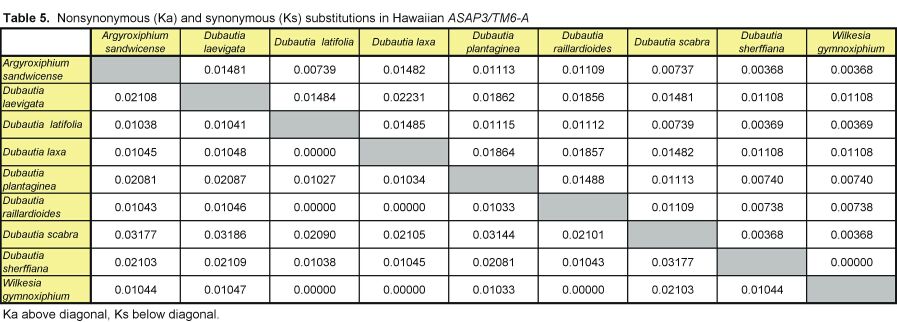
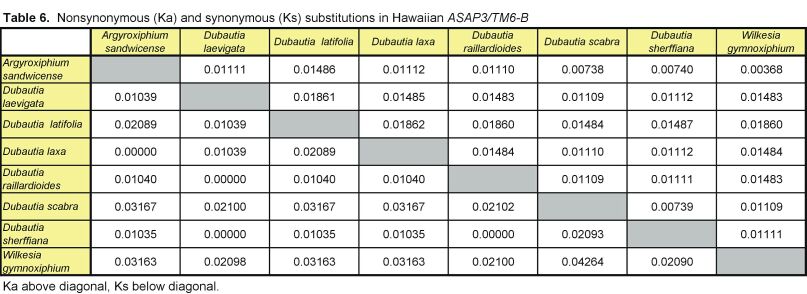
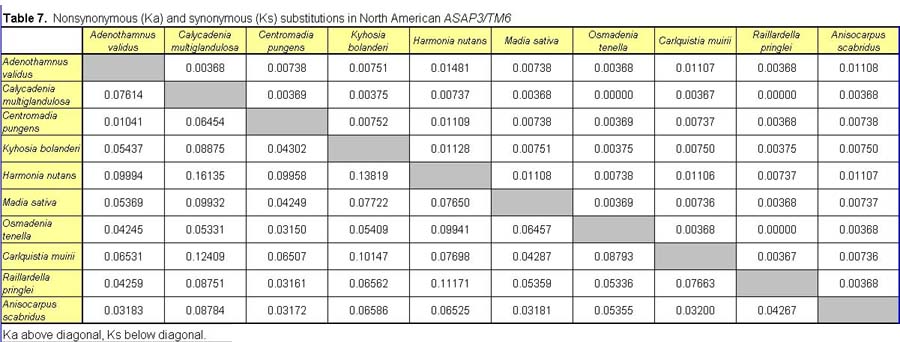
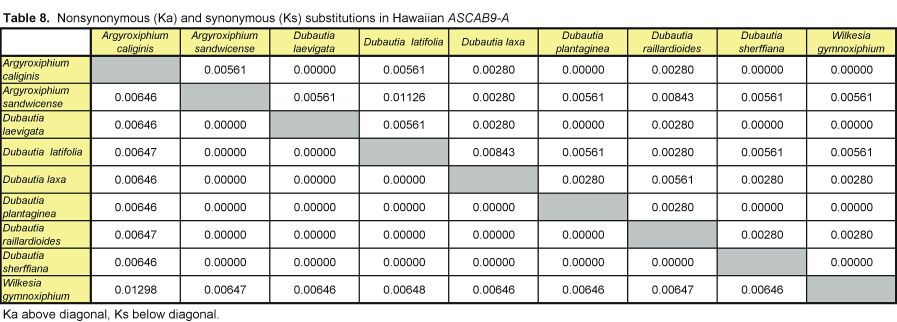
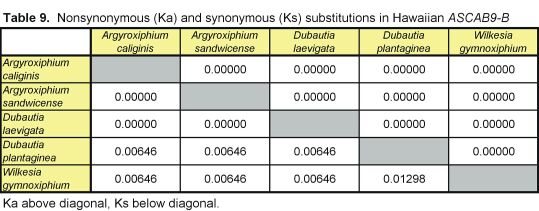
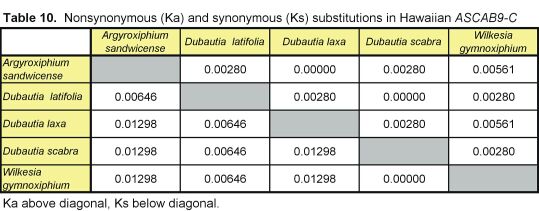
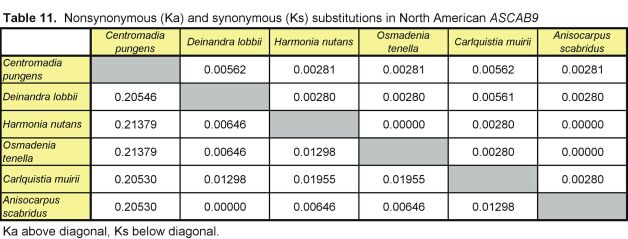
Pairwise nonsynonymous (Ka) and synonymous (Ks) nucleotide substitutions in the coding regions of the ASAP3/TM6, ASAP1, and ASCAB9 loci were calculated according to the method of Nei and Gojobori (18), as implemented in MEGA (19). This method gives unbiased estimates when evaluating sequences of low divergences (20). Pairwise Ka/Ks values were calculated for orthologues of ASAP3/TM6, ASAP1, and ASCAB9. The individual pairwise Ka and Ks values reported here can be found in Tables 2–11, which are published as supplemental data on the PNAS web site, www.pnas.org. Significance values were estimated by using 1,000 two-sample bootstrap replicates generated from the joint distribution of Ka/Ks ratios for the Hawaiian and North American species pairs. The Tajima relative rate test was used to examine rate variation between genes in the Hawaiian species and their closest North American relatives, with C. pungens as an outgroup (21). This test has been shown to perform as well as maximum likelihood methods for noncoding region data. Gene phylogenies were reconstructed with PAUP* 4.0b5 (22) as described (16). Ancestral nucleotide character states were reconstructed by using BASEML in the PAML program package (23), with the HKY85 nucleotide substitution model (24), and assuming no molecular clock.
Results and Discussion
Regulatory and Structural Genes in the Hawaiian and North American Species.
Homologues to the Arabidopsis APETALA3 and APETALA1 floral regulatory genes were isolated from developing flowers of A. sandwicense subsp. macrocephalum. The two genes are designated as ASAP3/TM6 and ASAP1, respectively (16). The two loci are members of the MADS-box family of plant transcriptional activators, many of which are known to regulate floral and inflorescence development in angiosperms (25). Phylogenetic analysis indicates that the ASAP3/TM6 gene is a member of the AP3 floral homeotic gene group, and appears to be an orthologue of the Lycopersicon TM6 locus (26, 27). The ASAP1 gene is an orthologue of the Arabidopsis AP1 locus. Genetic studies in Arabidopsis thaliana, Antirrhinum majus, and Zea mays indicate that the developmental functions of the floral regulatory genes exhibit broad conservation across the angiosperms (28). AP3 orthologues control petal and stamen development, and AP1 orthologues regulate the establishment of floral primordia and control sepal and petal organ identity (28). Molecular genetic studies in Arabidopsis further indicate that changes in the activity of AP1 are correlated with variation in inflorescence branch number and flowering time (29), and QTL mapping studies show that changes in petal and stamen sizes in Arabidopsis map to a region that includes AP3 (30). Because species in the silversword alliance vary in the number of flowers per capitula, flowering time, and the sizes of petals and stamens (11), both ASAP3/TM6 and ASAP1 are candidates for genes that underlie floral and inflorescence morphological and phenological variation among the Hawaiian species.
Gene fragments encompassing exons 1 to 4 of ASAP3/TM6 and exons 3 to 8 of ASAP1 were isolated and sequenced from the Hawaiian and North American species (16). The isolated fragments of the ASAP3/TM6 gene contain the coding region for the first 124 amino acids (aa) of the 227-aa encoded protein, including the MADS-box DNA-binding and putative K-box dimerization domains (25). The isolated fragments of the ASAP1 gene contain a region encoding 128 aa of the 242-aa protein, including the K-box and C-terminal domains. The C-terminal domain of MADS-box regulatory proteins is believed to contain the transcriptional activation domain (25). The isolation of different regions of the ASAP3/TM6 and ASAP1 genes allows sequence evolution to be examined across different domains of these transcriptional activators.
The ASAP3/TM6 and ASAP1 genes are present in duplicate copies (designated as the A and B copies) in the tetraploid Hawaiian species (16). Duplication of genes may lead to inactivation of one gene copy via pseudogene formation (31). RT-PCR assays demonstrate, however, that the A and B copies of both genes are transcriptionally active in developing inflorescences of Dubautia (see Fig. 1), indicating that pseudogene formation has not generally occurred at these regulatory loci. Only single copies of the genes have been detected in North American species within the “Madia” lineage. Phylogenetic analysis indicates that the A and B copies of the genes in the Hawaiian species are most closely related to genes in A. scabridus and C. muirii from North America (16). For the ASAP3/TM6 gene, the ranges of sequence divergence are 0.2–1.0% in the Hawaiian species (including both the A and B copies) and 1.7–5.7% in the North American species. For the ASAP1 gene, the ranges of sequence divergence are 0.2–1.4% in the Hawaiian species and 2.1–5.2% in the North American species. Plots of estimated vs. observed nucleotide substitutions indicate that neither nonsynonymous nor synonymous sites at these loci are saturated (M.B. and M.D.P., unpublished observations).
The orthologue to the CHLOROPHYLL A/B BINDING PROTEIN9 photosynthetic structural gene was also isolated from A. sandwicense subsp. macrocephalum, and is designated as ASCAB9. The nuclear CAB9 gene encodes a chloroplast-localized protein ≈260 aa in length, which is a portion of the CP26/29 CAB precursor protein in photosystem II (32). A 1.2-kb genomic region encompassing intron 3 to the 3′ untranslated region (UTR) (and including exons 4 to 6) was isolated from ten species in the Hawaiian silversword alliance and six species of North American tarweeds. The Hawaiian species appear to possess three copies of the ASCAB9 gene. Sequence analyses suggest that intergenic recombination between two of the copies (designated as the A and B copies) may have given rise to the third copy. All three copies were included in our analyses of rates of sequence evolution. Only one copy of the ASCAB9 gene has been detected in each of the North American species. For the ASCAB9 gene, the ranges of sequence divergence are 0.0–0.7% in the Hawaiian species and 0.1–7.4% in the North American species. Because of the small number of nucleotide changes at this locus, especially in the Hawaiian species, the phylogeny of the ASCAB9 gene is not as highly resolved as the phylogenies of the ASAP3/TM6 and ASAP1 genes.
Accelerated Gene Evolution in the Hawaiian Species.
Molecular evolutionary analyses reveal that the ASAP3/TM6 and ASAP1 regulatory genes in species of the Hawaiian silversword alliance are evolving faster than their orthologues in the North American tarweed species. This accelerated evolution is evident when comparing the relative levels of nonsynonymous and synonymous nucleotide substitutions in the coding regions of these loci. Protein-encoding genes evolving at the neutral rate have Ka/Ks ratios equal to 1 (33). Most genes, however, are subject to strong purifying selection, resulting in lower nonsynonymous relative to synonymous substitution rates (i.e., Ka/Ks < 1) (33). The mean Ka/Ks values among orthologues for the ASAP3/TM6 and ASAP1 loci in the North American species are 0.12 ± 0.11 (mean ± SD) and 0.29 ± 0.12, respectively (see Fig. 2). These values are comparable to the mean Ka/Ks value of 0.14 observed for several other plant nuclear loci, and 0.11–0.19 observed for MADS-box floral homeotic genes from other species (34).
Figure 2.

Distribution of Ka/Ks values for the ASAP3/TM6, ASAP1, and ASCAB9 genes in the North American tarweeds and Hawaiian silversword alliance. Mean values and standard deviations are indicated. Pairwise comparisons that had no synonymous substitutions are not shown in the histograms and were not included in the analyses. Individual pairwise Ka and Ks estimates are shown in Tables 2–11, which are published as supplemental data on the PNAS web site.
In contrast to the loci in the North American species, the floral regulatory genes display elevated Ka/Ks ratios in the Hawaiian species. The ASAP3/TM6 gene has a mean Ka/Ks value of 0.79 ± 0.52, and the ASAP1 gene has a mean Ka/Ks value of 0.98 ± 0.64 (see Fig. 2). Because there are two copies of each gene in the Hawaiian species, Ka/Ks ratios were calculated separately for orthologues of the A and B copies (see Tables 2–7); Fig. 2 reports the joint distribution of Ka/Ks ratios for both copies in the Hawaiian species. For each gene, the mean Ka/Ks values for the duplicate copies, when calculated separately, are similar. The increases in Ka/Ks values for the regulatory loci in the Hawaiian species are significantly different from that expected by chance, as assessed by a bootstrap resampling test (P < 0.001). Moreover, all but two pairwise comparisons among the genes in the North American species have Ka/Ks < 0.5. By contrast, nearly 30% of the pairwise comparisons among the genes in the Hawaiian species have Ka/Ks > 1. For example, eight of the nine coding region changes between the isolated ASAP1-A gene regions of Dubautia scabra and Dubautia laevigata are nonsynonymous substitutions. High Ka/Ks values have previously been observed for genes under diversifying or directional selection, such as the self-incompatibility, gamete recognition, and MHC loci (35–37).
Unlike the two regulatory genes, the ASCAB9 structural gene does not exhibit a substantial increase in Ka/Ks ratios in the Hawaiian species. The mean Ka/Ks values for the ASCAB9 gene in the North American and Hawaiian species are 0.14 ± 0.17 and 0.21 ± 0.30, respectively (see Fig. 2 and Tables 8–11). The mean Ka/Ks values do not include pairwise comparisons that have no synonymous substitutions. Reflecting the lower levels of sequence divergence at the ASCAB9 locus, several pairwise comparisons, especially among the Hawaiian species, lack synonymous substitutions, although some have one nonsynonymous substitution.
Accelerated Rate Confined to the Hawaiian Species.
Accelerated evolution of the proteins encoded by the floral regulatory genes appears to be confined to the Hawaiian silversword alliance. The number of coding region substitutions was inferred along each branch of the ASAP3/TM6 and ASAP1 gene phylogenies by using maximum likelihood ancestral state reconstructions under the HKY85 model of nucleotide substitutions (see Fig. 3). The total number of nonsynonymous and synonymous substitutions inferred within the gene phylogenies was then partitioned between the Hawaiian and North American species.
Figure 3.

Phylogenies of the (A) ASAP3/TM6 and (B) ASAP1 genes in the North American tarweeds (green) and Hawaiian silversword alliance (blue). The phylogenies were reconstructed by using coding region and noncoding region sequences. The numbers of nonsynonymous (N) and synonymous (S) nucleotide substitutions in the coding regions inferred along each branch by maximum likelihood ancestral state reconstructions are given as a ratio (N/S). Levels of bootstrap support are shown next to the nodes. Nodes with less than 70% bootstrap support, and with no coding region nucleotide substitutions inferred along the subtending branch, are collapsed. For the North American species, the generic abbreviations are: A, Anisocarpus; Ad, Adenothamnus; C, Carlquistia; Ca, Calycadenia; Ce, Centromadia; D, Deinandra; H, Harmonia; K, Kyhosia; M, Madia; O, Osmadenia; and R, Raillardella. For the Hawaiian species, the generic abbreviations are: A, Argyroxiphium; D, Dubautia; and W, Wilkesia.
For both the ASAP3/TM6 and ASAP1 regulatory genes, the number of nonsynonymous substitutions exceeds the number of synonymous substitutions inferred along branches of the gene phylogenies circumscribed by the Hawaiian silversword alliance (see Table 1). By contrast, most coding region nucleotide substitutions inferred along phylogenetic branches within the North American tarweeds are synonymous. For the ASAP3/TM6 locus, for example, 25 of the 40 coding region changes (62%) in the Hawaiian species are nonsynonymous substitutions. By contrast, only 5 of the 36 coding region changes (14%) in the North American species are nonsynonymous substitutions. The excess of nonsynonymous over synonymous substitutions in the Hawaiian species compared with the North American species is significant for both the ASAP3/TM6 locus (Fisher's Exact Test, P = 0.00001) and the ASAP1 locus (P = 0.002; see Table 1).
Table 1.
Contingency analyses of coding region substitutions in the Hawaiian and North American genes
|
ASAP3/TM6
|
ASAP1
|
ASCAB9
|
||||
|---|---|---|---|---|---|---|
| HI | NA | HI | NA | HI | NA | |
| Nonsynonymous | 25 | 5 | 28 | 50 | 7 | 3 |
| Synonymous | 15 | 31 | 11 | 64 | 9 | 31 |
| P = 0.00001** | P = 0.002** | P = 0.007** | ||||
The numbers of nonsynonymous and synonymous nucleotide substitutions in the coding regions were inferred along branches of the gene phylogenies using maximum likelihood ancestral state reconstructions (see Fig. 3). Inferred substitutions along the phylogenetic branches at the bases of the A and B copies of the ASAP3/TM6 and ASAP1 loci in the Hawaiian species (denoted in black in Fig. 3) were not included in the analyses, as the substitutions may have occurred in genes of either North American or Hawaiian species. HI, Hawaiian; NA, North American. Significance was calculated by using Fisher's Exact Test (**, P < 0.01;
, P < 0.001).
The distribution of nonsynonymous and synonymous nucleotide substitutions inferred within the ASCAB9 gene phylogeny also indicates a significant difference between the Hawaiian and North American species (Fisher's Exact Test, P = 0.007), with the former having a higher proportion of nonsynonymous substitutions (see Table 1). Unlike the two regulatory genes, however, the ASCAB9 structural gene does not have an excess of nonsynonymous over synonymous substitutions along branches of the gene phylogenies circumscribed by the Hawaiian silversword alliance.
Neutral Mutation Rates Do Not Display Significant Acceleration in the Hawaiian Species.
The large increases in nonsynonymous relative to synonymous nucleotide substitution rates in the ASAP3/TM6 and ASAP1 loci in the Hawaiian species are not correlated with a general acceleration of the neutral mutation rate. Relative rate tests (21) indicate that the regulatory loci do not display a significant increase in nucleotide substitution rates for the largely synonymous third codon positions in the Hawaiian species compared with the North American Anisocarpus and Carlquistia species (Tajima's test, P > 0.1). For both regulatory genes, there is an increase in the rate of intron evolution among the North American and Hawaiian species (Tajima's test, P < 0.005), but this involves a rate increase for the more derived loci of North American and Hawaiian species relative to loci of North American species found at more basal positions within the gene phylogenies (see Fig. 3). Thus, the increase is not confined to loci in the Hawaiian species. For the ASCAB9 gene, there is neither an increase in nucleotide substitution rates for the third codon positions (Tajima's test, P > 0.1) nor an increase in the rate of intron evolution (Tajima's test, P > 0.1) in the Hawaiian species compared with the North American species.
Accelerated Regulatory Gene Evolution and Adaptive Radiation of the Hawaiian Silversword Alliance.
Although both regulatory and structural genes display an increase in molecular evolutionary rates in the Hawaiian silversword alliance, there is a marked difference between the two gene classes in nonsynonymous relative to synonymous nucleotide substitution rates. Phylogenetic mapping of coding region changes indicates a significant excess of nonsynonymous over synonymous substitutions for the ASAP3/TM6 and ASAP1 regulatory genes, but not for the ASCAB9 structural gene. It is unclear that the results for the ASCAB9 locus are representative of other structural genes. However, the results for this locus are in general agreement with previous studies indicating limited genetic differentiation in structural allozyme loci between species in the Hawaiian silversword alliance (15). Thus, accelerated regulatory gene evolution, more than structural gene evolution, appears closely correlated with the rapid morphological diversification of the Hawaiian silversword alliance.
The significantly accelerated rates of regulatory gene evolution in the Hawaiian species may reflect the influence of allopolyploidy or of selection and adaptive divergence. The Hawaiian silversword alliance appears to have descended from an interspecific hybrid between members of two extant North American tarweed lineages (16). Polyploidy, which is believed to be an important avenue for plant species formation (38–40), may be associated with increases in genetic heterozygosity (41), chromosomal diversification (42), and phenotypic variation (43, 44). Gene duplication events, such as those observed under polyploidy, may also result in increased rates of nonsynonymous nucleotide substitutions (45, 46). Yet, allopolyploidy might be expected to have genome-wide effects, evident in both regulatory and structural genes. Given the significant excess of nonsynonymous over synonymous substitutions for the ASAP3/TM6 and ASAP1 loci, but not for the ASCAB9 locus, among the Hawaiian species, it is unlikely that allopolyploidy alone has been the key factor influencing regulatory gene evolution during the adaptive radiation.
Many of the pairwise interspecific Ka/Ks values for the ASAP3/TM6 and ASAP1 loci in the Hawaiian species are greater than 1 (see Fig. 2), which strongly suggests that selection and adaptive divergence may have operated to shape the structure of these transcriptional activators (35–37). The Hawaiian species differ greatly in a suite of reproductive traits, including floral organ size and morphology, inflorescence size, and capitulescence architecture (11). Diversifying or directional selection, acting on variation in these and other reproductive traits, may have led to adaptive divergence of the floral regulatory genes. Further studies may help to clarify whether specific molecular changes at these candidate regulatory genes underlie variation in specific reproductive traits.
In summary, our results suggest that rapid morphological diversification during the adaptive radiation of the Hawaiian silversword alliance has been accompanied by accelerated evolution of genes that regulate developmental processes. Thus, our results may help to resolve a key paradox in evolutionary genetics. Whereas rates of morphological evolution are generally not correlated with rates of structural gene evolution (1–3), they may be correlated with rates of regulatory gene evolution.
Supplementary Material
Acknowledgments
We gratefully acknowledge Bruce Baldwin and Amy Lawton-Rauh for providing materials and unpublished data, and Jane Suddith and Abee Boyles for technical support. This work was supported in part by a grant from the National Science Foundation (to M.D.P. and R.H.R.) and an Alfred P. Sloan Foundation Young Investigator Award (to M.D.P.).
Abbreviations
- Ka
nonsynonymous
- Ks
synonymous
- RT
reverse transcription
Footnotes
References
- 1.King M C, Wilson A C. Science. 1975;188:107–116. doi: 10.1126/science.1090005. [DOI] [PubMed] [Google Scholar]
- 2.Cherty L M, Case S M, Wilson A C. Science. 1978;200:209–211. doi: 10.1126/science.635583. [DOI] [PubMed] [Google Scholar]
- 3.Wilson A C. In: Molecular Evolution. Ayala F J, editor. Sunderland, MA: Sinauer; 1977. p. 225. [Google Scholar]
- 4.Meyer A, Kocher T D, Basasibwaki P, Wilson A C. Nature (London) 1990;347:550–553. doi: 10.1038/347550a0. [DOI] [PubMed] [Google Scholar]
- 5.Hodges S A, Arnold M. Proc Natl Acad Sci USA. 1994;91:5129–5132. doi: 10.1073/pnas.91.11.5129. [DOI] [PMC free article] [PubMed] [Google Scholar]
- 6.Baldwin B G, Robichaux R H. In: Hawaiian Biogeography: Evolution on a Hot Spot Archipelago. Wagner W L, Funk V A, editors. Washington, DC: Smithsonian Press; 1995. pp. 259–287. [Google Scholar]
- 7.Lowe C J, Wray G A. Nature (London) 1997;389:718–721. doi: 10.1038/39580. [DOI] [PubMed] [Google Scholar]
- 8.Doebley J, Lukens L. Plant Cell. 1998;10:1075–1082. doi: 10.1105/tpc.10.7.1075. [DOI] [PMC free article] [PubMed] [Google Scholar]
- 9.Purugganan M D. BioEssays. 1998;20:700–711. doi: 10.1002/(SICI)1521-1878(199809)20:9<700::AID-BIES3>3.0.CO;2-K. [DOI] [PubMed] [Google Scholar]
- 10.Baldwin B G. In: Molecular Evolution and Adaptive Radiation. Givnish T J, Sytsma K J, editors. Cambridge, U.K.: Cambridge Univ. Press; 1997. pp. 103–128. [Google Scholar]
- 11.Carr G D. Allertonia. 1985;4:1–123. [Google Scholar]
- 12.Baldwin B G, Kyhos D W, Dvorak J, Carr G D. Proc Natl Acad Sci USA. 1991;88:1840–1843. doi: 10.1073/pnas.88.5.1840. [DOI] [PMC free article] [PubMed] [Google Scholar]
- 13.Baldwin B G. In: Compositae: Systematics. Hind D J N, Beentje H J, editors. Kew, U.K.: Royal Botanic Gardens; 1996. pp. 377–391. [Google Scholar]
- 14.Carr G D, Kyhos D W. Evolution. 1986;40:959–976. doi: 10.1111/j.1558-5646.1986.tb00565.x. [DOI] [PubMed] [Google Scholar]
- 15.Witter M S, Carr G D. Evolution. 1988;42:1278–1287. doi: 10.1111/j.1558-5646.1988.tb04187.x. [DOI] [PubMed] [Google Scholar]
- 16.Barrier M, Baldwin B G, Robichaux R H, Purugganan M D. Mol Biol Evol. 1999;16:1105–1113. doi: 10.1093/oxfordjournals.molbev.a026200. [DOI] [PubMed] [Google Scholar]
- 17.Baldwin B G, Sanderson M J. Proc Natl Acad Sci USA. 1998;95:9402–9406. doi: 10.1073/pnas.95.16.9402. [DOI] [PMC free article] [PubMed] [Google Scholar]
- 18.Nei M, Gojobori T. Mol Biol Evol. 1986;3:418–426. doi: 10.1093/oxfordjournals.molbev.a040410. [DOI] [PubMed] [Google Scholar]
- 19.Kumar S, Tamura K, Nei M. MEGA: Molecular Evolutionary Genetics Analysis. University Park, PA: Pennsylvania State Univ.; 1993. , Version 1.0. [Google Scholar]
- 20.Nielsen R, Yang Z. Genetics. 1998;148:929–936. doi: 10.1093/genetics/148.3.929. [DOI] [PMC free article] [PubMed] [Google Scholar]
- 21.Tajima F. Genetics. 1993;135:599–607. doi: 10.1093/genetics/135.2.599. [DOI] [PMC free article] [PubMed] [Google Scholar]
- 22.Swofford D L. PAUP*: Phylogenetic Analysis Using Parsimony (*and Other Methods) Sunderland, MA: Sinauer; 2000. , Version 4.0b4a. [Google Scholar]
- 23.Yang Z. Phylogenetic Analysis by Maximum Likelihood (PAML) London: University College London; 2000. , Version 3.0. [Google Scholar]
- 24.Hasegawa M, Kishino H, Yano T J. J Mol Evol. 1985;22:160–174. doi: 10.1007/BF02101694. [DOI] [PubMed] [Google Scholar]
- 25.Riechmann J L, Meyerowitz E M. Biol Chem. 1997;378:1079–1101. [PubMed] [Google Scholar]
- 26.Purugganan M D. J Mol Evol. 1997;45:392–396. doi: 10.1007/pl00006244. [DOI] [PubMed] [Google Scholar]
- 27.Kramer E M, Dorit R, Irish V F. Genetics. 1998;149:765–783. doi: 10.1093/genetics/149.2.765. [DOI] [PMC free article] [PubMed] [Google Scholar]
- 28.Weigel D. Curr Opin Plant Biol. 1998;1:55–59. doi: 10.1016/s1369-5266(98)80128-3. [DOI] [PubMed] [Google Scholar]
- 29.Mandel M A, Yanofsky M F. Nature (London) 1995;377:522–524. doi: 10.1038/377522a0. [DOI] [PubMed] [Google Scholar]
- 30.Juenger T, Purugganan M D, Mackay T F C. Genetics. 2000;156:1379–1392. doi: 10.1093/genetics/156.3.1379. [DOI] [PMC free article] [PubMed] [Google Scholar]
- 31.Walsh J B. Genetics. 1995;139:421–428. doi: 10.1093/genetics/139.1.421. [DOI] [PMC free article] [PubMed] [Google Scholar]
- 32.Pichersky E, Subramaniam R, White M J, Reid J, Aebersold R, Green B R. Mol Gen Genet. 1991;227:277–284. doi: 10.1007/BF00259681. [DOI] [PubMed] [Google Scholar]
- 33.Li W-H, Wu C I, Luo C C. Mol Biol Evol. 1985;2:150–174. doi: 10.1093/oxfordjournals.molbev.a040343. [DOI] [PubMed] [Google Scholar]
- 34.Purugganan M D, Rounsley S D, Schmidt R J, Yanofsky M F. Genetics. 1995;140:345–356. doi: 10.1093/genetics/140.1.345. [DOI] [PMC free article] [PubMed] [Google Scholar]
- 35.Richman A D, Uyenoyama M, Kohn J. Science. 1996;273:1212–1216. doi: 10.1126/science.273.5279.1212. [DOI] [PubMed] [Google Scholar]
- 36.Swanson W J, Vacquier V D. Proc Natl Acad Sci USA. 1995;92:4957–4961. doi: 10.1073/pnas.92.11.4957. [DOI] [PMC free article] [PubMed] [Google Scholar]
- 37.Hughes A L, Yeager M. Annu Rev Genetics. 1998;32:415–435. doi: 10.1146/annurev.genet.32.1.415. [DOI] [PubMed] [Google Scholar]
- 38.Wendel J F. Plant Mol Biol. 2000;42:225–249. [PubMed] [Google Scholar]
- 39.Soltis P S, Soltis D E. Proc Natl Acad Sci USA. 2000;97:7051–7057. doi: 10.1073/pnas.97.13.7051. [DOI] [PMC free article] [PubMed] [Google Scholar]
- 40.Stebbins G L. Variation and Evolution in Plants. New York: Columbia Univ. Press; 1950. [Google Scholar]
- 41.Soltis D E, Soltis P S. Evolution. 1989;43:586–594. doi: 10.1111/j.1558-5646.1989.tb04254.x. [DOI] [PubMed] [Google Scholar]
- 42.Song K, Lu P, Tang K, Osborn T C. Proc Natl Acad Sci USA. 1995;92:7719–7723. doi: 10.1073/pnas.92.17.7719. [DOI] [PMC free article] [PubMed] [Google Scholar]
- 43.Jiang C-X, Wright R J, El-Zik K M, Paterson A H. Proc Natl Acad Sci USA. 1998;95:4419–4424. doi: 10.1073/pnas.95.8.4419. [DOI] [PMC free article] [PubMed] [Google Scholar]
- 44.Roose M L, Gottlieb L D. Evolution. 1976;30:818–830. doi: 10.1111/j.1558-5646.1976.tb00963.x. [DOI] [PubMed] [Google Scholar]
- 45.Li W H. In: Population Genetics and Molecular Evolution. Ohta T, Aoki K, editors. Berlin: Springer; 1985. [Google Scholar]
- 46.Ohta T. Genetics. 1994;138:1331–1337. doi: 10.1093/genetics/138.4.1331. [DOI] [PMC free article] [PubMed] [Google Scholar]
Associated Data
This section collects any data citations, data availability statements, or supplementary materials included in this article.