Abstract
Accurate arterial stiffness measurement would improve diagnosis and monitoring for many diseases. Atherosclerotic plaques and aneurysms are expected to involve focal changes in vessel wall properties; therefore, a method to image the stiffness variation would be a valuable clinical tool. The pulse wave inverse problem (PWIP) fits unknown parameters from a computational model of arterial pulse wave propagation to ultrasound-based measurements of vessel wall displacements by minimizing the difference between the model and measured displacements. The PWIP has been validated in phantoms, and this study presents the first in vivo demonstration. The common carotid arteries of five healthy volunteers were imaged five times in a single session with repositioning of the probe and subject between each scan. The 1D finite difference computational model used in the PWIP spanned from the start of the transducer to the carotid bifurcation, where a resistance outlet boundary condition was applied to approximately model the downstream reflection of the pulse wave. Unknown parameters that were estimated by the PWIP included a 10-segment linear piecewise compliance distribution and 16 discrete cosine transformation coefficients for each of the inlet boundary conditions. Input data was selected to include pulse waves resulting from the primary pulse and dicrotic notch. The recovered compliance maps indicate that the compliance increases close to the bifurcation, and the variability of the average pulse wave velocity estimated through the PWIP is on the order of 11%, which is similar to that of the conventional processing technique which tracks the wavefront arrival time (13%).
Keywords: Arteries, Compliance, Pulse wave Imaging, Pulse wave velocity, Inverse problems, Elastography
Introduction
When functioning normally, arteries not only act as a conduit for delivery of blood around the body, they also provide a cushioning reservoir to absorb some of the pulsatile input from the heart and deliver a reasonably steady flow of blood to the capillaries and peripheral organs (O’Rourke and Hashimoto 2007). Processes such as aging and hypertension cause a loss of elastin and production of abnormal collagen in the vessel (Zieman et al. 2005, Johnson et al. 2001), which decreases the arterial compliance, affecting the cushioning function of the central arteries, and consequently, blood flow to external organs. The resultant changes in blood flow dynamics cause increased load on the heart and arteries, and have been implicated in diseases including atherosclerosis (van Popele et al. 2001, Oliver 2003), aneurysms (Dijk et al. 2004), hypertension (Laurent et al. 2001), dementia (Hanon et al. 2005) and aging (Mitchell et al. 2004). Accurate, spatially resolved noninvasive vessel stiffness measurements would allow efficient diagnosis and monitoring of these common conditions.
Several techniques for non-invasive vessel stiffness measurements have been developed. Shear wave elastography (SWE) measures the propagation speed of the mechanical wave resulting from a focused ultrasound (FUS) ‘push’ on the vessel wall (Couade et al. 2010), which is related to the wave speed in an homogenous infinite plate surrounded by fluid (Nenadic et al. 2011). Acoustic radiation force impulse (ARFI) imaging applies a similar ‘push’, and uses the magnitude of the induced displacement as a relative measure of wall stiffness (Allen et al. 2011). Magnetic resonance elastography (MRE) measures a steady-state vibration field from a source close to the artery using phase-contrast MRI to recover local estimates of the shear modulus (Kolipaka et al. 2012). SWE, ARFI and MRE have produced promising results to date; however, questions remain about the validity of the required assumptions. All three techniques assume mechanical homogeneity, which is often not valid in vivo, particularly in the case of pathological arteries. Additionally, determining the effects of stiffness changes on the ‘cushioning’ property of the arterial tree and associated blood flow dynamics requires an additional step taking into account the vessel wall cross-sectional geometry and stiffness distribution to compute the compliance of each artery section.
The arterial compliance can be directly estimated through the velocity of intrinsic pulse waves which result from cardiac contractions forcing incompressible blood into flexible arteries, which is related to the artery compliance (Bramwell and Hill, 1922).
Global pulse wave velocity (PWV) is estimated by performing two temporally synchronized pulse pressure measurements at different locations and estimating the average propagation speed (Wilkinson et al. 1998). This approach is estimates a single global average PWV, where more specific diagnostic information could result from localized measurements. Pulse wave imaging (PWI) computes the PWV at smaller scales using ultrasound measurements of vessel wall displacements (Vappou et al. 2010, Vappou et al. 2011, Luo et al. 2012, Li et al. 2013, Apostolakis et al. 2016), although pulse wave reflections can cause issues. Reflections are particularly problematic in diseased arteries due to spatially varying vessel properties. We have demonstrated a pulse wave inverse problem (PWIP), which accounts for reflections by fitting unknown parameters of a computational model of the governing 1D pulse wave equations to the measured data to compute spatially resolved estimates of the vessel compliance. The PWIP accurately computed the compliance distribution of heterogeneous phantoms with stiff inclusions as small as 7mm (Mcgarry et al. 2016). This study aims to test in vivo feasibility and repeatability of the methodology in carotid arteries of healthy human subjects.
Methods
Pulse wave inverse problem (PWIP)
The PWIP is an inverse problem approach to recovering the unknown vessel properties, where parameters from a computational model are fitted to measured data using optimization methods (Mcgarry et al. 2016). In this case, the computational model is the linearized partial differential equations governing 1-dimensional pulse wave propagation in heterogeneous flexible tubes (Fung et al. 2013),
| (1a) |
| (1b) |
Here, P is the blood pressure, u is the blood velocity, x is the coordinate along the vessel, t is time, A0 the reference vessel area, KR is the fluid resistance and kp is the local vessel compliance. kp describes how readily the vessel area, A, expands in response to a change in pressure, according to the equation
| (2) |
which implies that Equations 1 and 2 are equivalent to the 1D wave equation, where the propagation speed of the pulse wave is given by the Bramwell-Hill equation,
| (3) |
Assumptions in the model include Ao ≫ kpP, u ≪ cbh, negligible wall viscosity, negligible radial fluid flow and a flat cross-sectional velocity profile, which are reasonable for flow in large arteries (Fung 2013). With the exception of negligible radial fluid flow, these assumptions can be relaxed if necessary, incurring the computational cost of solving nonlinear PDEs (Sherwin et al. 2003).
In order to solve equation 1 for P(x, t) and u(x, t), boundary conditions (BCs) are required at the inlet and outlet. These BCs can be in the form of a prescribed pressure, P(xin/out, t) = Pin/out(t), prescribed flow, u(xin/out,t) = uin/out(t), resistance, u(xin/out,t) = RP(xin/out,t), or other options such as a Windkessel BC (Vignon et al. 2004). Initial conditions (ICs) are also required, e.g., two out of the following: P(x, 0), u(x, 0), and must be specified.
In this work, an implicit 4-point finite difference method is used (Lynch 2004) with prescribed pressure inlet BC, resistance outlet BC with R = 3 × 10⁻⁴ms−1Pa−1, and ICs for a system at rest, P(0, t) = 0, u(0, t) = 0.
The model is parameterized by a piecewise linear compliance distribution and a number of discrete cosine transform (DCT) components of the inlet pressure BC to provide a vector of unknown parameters, θ. Starting from an initial guess, the parameters are updated to minimize the difference between the incremental wall displacements of the physical system measured via ultrasound, dm(xs, ts), where xs and ts are the spatiotemporal sampling coordinates of the measurement system, and the equivalent incremental wall displacements calculated by the model, dc(x, t, θ), which can be computed from equation 2 with a cylindrical assumption,
| (4) |
where ΔP(xs, ts) is the model pressure increment at the sampling coordinates, (xs, ts). The objective function for the minimization is
| (5) |
where Nx and Nt are the number of spatial and temporal sampling regions, respectively. Equation 5 is simplified from the form given in (McGarry et al. 2015), as this study didn't require Tikhonov regularization and didn't have blood velocity measurements available. The gradient vector, , required for the minimization via the conjugate gradient method is computed using first order forward differences. Initial guesses for kp are generated from thickness and vessel diameter measurements and assuming a cylindrical vessel with a prescribed elastic modulus of 20 kPa. Initial guesses for the inlet BC are generated using equation 2 with the estimated kp and measured wall displacements at the inlet. The iterative optimization process results in a 1D compliance map, kp(x), and inlet pressure BC, P(0, t), which gives the closest match between the measurements and the model.
Data Collection
Five healthy male (22–32 y.o.) volunteers with no known cardiovascular disease were recruited in the study, blood pressure was recorded as the median of three measurements taken on the right arm using an Omron automatic blood pressure monitor (model HEM-705CP), immediately before imaging with using a Verasonics Vantage ultrasound system with Philips L7-4 linear array at a center frequency of 5.7 MHz with 128 scan lines across a width of 38 mm. RF signals were reconstructed from channel data acquired from a longitudinal view of the common carotid artery, approximately 20mm below the carotid bifurcation. Plane wave compounding with 5 beam steering angles (−3°,−1.5°,0°,1.5°,3°) was implemented to improve image quality while maintaining a very high frame rate of approximately 2000 frames/s (Apostolakis et al. 2016b). The carotid bifurcation was marked on the neck before imaging, and the distance between the end of the probe and the bifurcation was measured for each subject, as illustrated in figure 1. Accuracy of this measurement is approximately ± 5mm. RF data was collected at a framerate of 2000 Hz for approximately 1 second to capture at least 1 full cardiac cycle. The incremental displacements along a trace of the top and bottom wall were computed using 1D cross-correlation (Luo and Konofagou 2010), and subtracted to give the spatiotemporal diameter change between frames. A typical example is given in figure 2. The same operator imaged each subject 5 times in one session over approximately 15 minutes, with repositioning of the subject and ultrasound probe between each acquisition to include variation due to setup effects, while minimizing the effect of physiologic changes over time.
Figure 1.
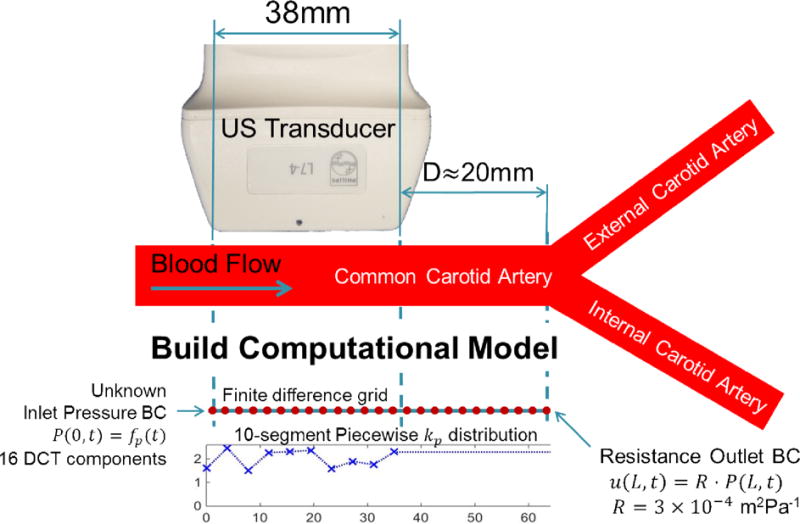
Experimental setup, showing the position of the transducer on the common carotid artery (CCA). The distance to the bifurcation where the internal and external carotid arteries (ICA and ECA) form is measured to define the required length of the model to capture the pulse wave reflection occurring at the bifurcation. The finite difference model spans from the start of the transducer to the bifurcation, and the 10 segment kp distribution spans the width of the transducer. kp for the remaining model is held at the rightmost value. The unknown parameters, which are updated during the inverse problem, are the 10 kp values and 16 DCT components of the inlet pressure BC for each pulse wave segment.
Figure 2.
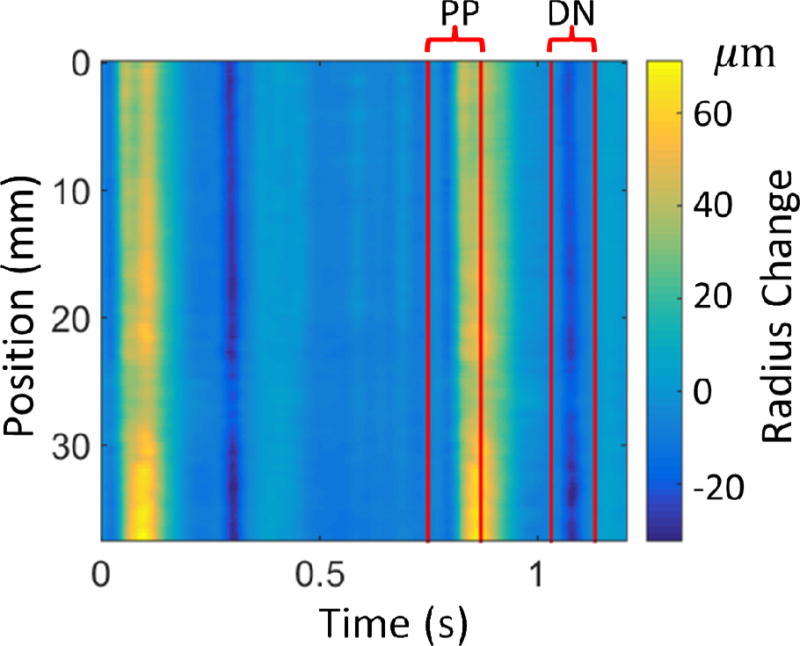
Typical experimental data and bounds for the primary pulse (PP) and dicrotic notch (DN) used in the PWIP. The colormap shows the radius change in microns, computed by subtracting the anterior and posterior wall displacements and dividing by 2.
Data Analysis
The PWIP for each dataset used the data range corresponding to the primary pulse wave and the next dicrotic notch as measured wall displacement data, um, which were manually selected from the spatiotemporal incremental wall displacement (figure 2). The start of each pulse was selected to avoid any propagating pulse waves to fit the prescribed ICs in the model, and the end of the primary pulse avoided the downstream reflection after the forward pulse had passed. The vector of unknowns, θ, was comprised of a 10-segment piecewise linear compliance distribution along the imaged length (~35mm), as well as 16 DCT components of the inlet pressure for each of the two pulses, giving 42 total unknown parameters. Typically, about 420 temporal points and all 128 spatial samples are used, which yields 51200 measurements. The spatial and temporal resolutions of the finite difference model were set to the same as the measured data. The length of the model was the transducer width, plus the distance from the end of the transducer to the carotid bifurcation (indicated as D in figure 1), and the piecewise kp distribution spanned the first 35mm, with the final value defining the compliance of the rest of the model, as illustrated in figure 1. The reference area, Ao, was computed at each scan line from the average vessel diameter on the B-mode image. The outlet resistance BC with an empirically selected value of R = 3 × 10⁻⁴ ms−1Pa−1 models a reflection with no phase change originating from the carotid bifurcation, which is a rough approximation of the true nature of the downstream reflections.
Standard PWV estimation using wavefront tracking was also performed by finding the 50% upstroke of the primary pulse for each scan line, which is defined as the time when the wave reaches 50% of the maximum amplitude. A linear fit of the spatiotemporal locations of the 50% upstroke markers gives an estimate of the average PWV across the ultrasound transducer (Li et al. 2012).
The repeatability of the compliance distribution of the PWIP was quantified by computing the standard deviation across the 5 repeated scans for each patient. The Bramwell-Hill equation (equation 2) was used to compute the local PWV, cbh, and the mean value was compared with PWV estimates from wavefront tracking using a 2-tailed t-test to check for significant differences. Spatial trends in kp and cbh distributions were analyzed by taking the mean of the leftmost and rightmost 3 points for each of the 5 scans and using a 2-tailed t-test with null hypothesis of zero difference. Additionally, the spatial gradient of the 5 scans for each subject was computed and tested against the null hypothesis of zero spatial gradient using a 2-tailed t-test.
The repeatability analysis was also performed with data bounds including the primary pulse downstream reflection, and the results compared to the case where the reflection was avoided. A semi-independent measure of the relative compliance across the imaged region of the vessel can be calculated from the cross-sectional area change over the cardiac cycle. The central blood pressure is difficult to measure non-invasively, and can vary significantly from the brachial pressure, particularly in younger healthy subjects used in this study (Nichols et al. 2011). However, it is reasonable to assume the range between minimum and maximum pressures, ΔP, along the relatively short imaged region of the carotid is constant, so using equation 2, the ratio of downstream and upstream compliance is
| (6) |
where dmin is the minimum diameter (measured from the B-mode image), and Δd is the diameter change, computed by summing the incremental PWI displacement data. The subscripts u and d refer to the upstream and downstream end of the imaged region, respectively. The median and range of Rd/u was compared to the ratio of upstream and downstream kp from the PWIP.
Results
PWIP results for a typical case are presented in figure 3. The results are not sensitive to the initial guess of vessel elastic modulus, provided the initial compliance guess is high to allow the algorithm to converge from above. Initial compliance guesses in the range of 10−7 to 10−8 m2Pa−1 converged to solutions differing by less than 10% after 200 iterations. Stiff initial guesses can encounter issues with local minima in the objective function. A good match between the measurements and model is achieved, and the value of the objective function, Φ, is reduced by more than one order of magnitude. Processing time is on the order of 12 minutes for the current Matlab implementation on a single 2.4 GHz processor.
Figure 3.
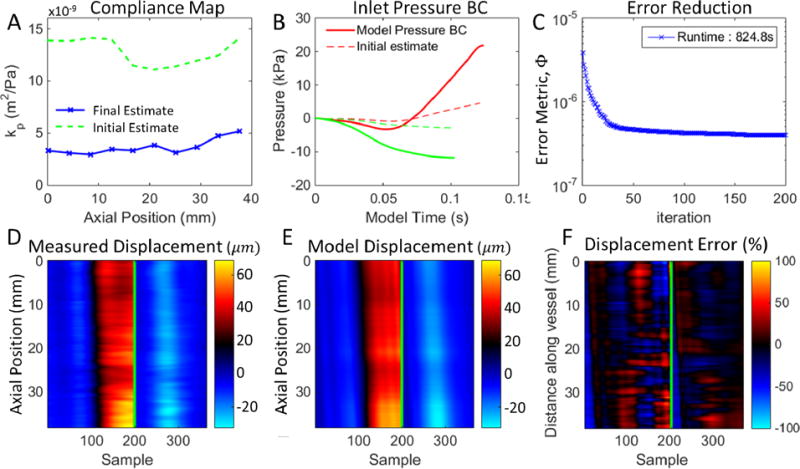
Typical result of the PWIP for in vivo data. Panel A shows the final compliance estimate compared to the initial guess. Panel B shows the inlet pressure boundary conditions for the primary pulse (PP, red) and dicrotic notch (DN, green). Panel C shows the progress of iterative minimization of the objective function, Φ (equation 5). Panels D and E compare the measured and model wall displacements, the green line separates the PP (left) from the DN (right). Panel F is the difference between the model and measurements, relative to the average measured wall displacement.
Figure 4 shows the compliance distribution for all scans performed for each subject, and figure 5 depicts the local PWV computed through the BramweN-Hill equation. The standard deviation of the compliance across the 5 scans for each subject ranged from 17–31% of the mean value, and the standard deviation of the PWV was between 9% and 13%. All subjects had an upward trend in compliance, and the PWV had a downward trend for all subjects. Both trends were significant in all cases except subject 4. The mean compliance of the upstream and downstream sides of the imaged region was significantly different for subjects 2, 3 and 5, and the mean PWV of the upstream and downstream sides of the imaged region was significantly different for subjects 1, 2 and 5.
Figure 4.
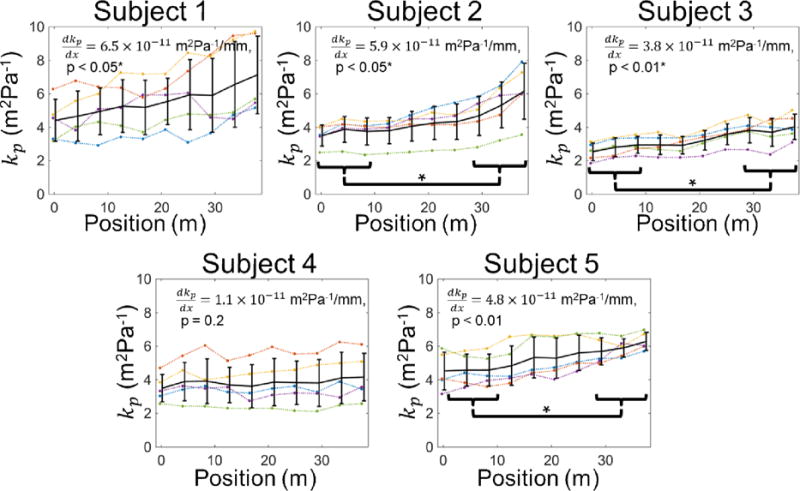
Compliance distribution recovered by the PWIP for all subjects. Individual inversions are shown as dotted lines, and the mean and standard deviation at each location are plotted as solid error bars. The compliance had an upward trend in all cases, which was significant for subjects 1, 2, 3 and 5, and significant differences between the compliance at the two ends of the probe were found for subjects 2, 3 and 5.
Figure 5.
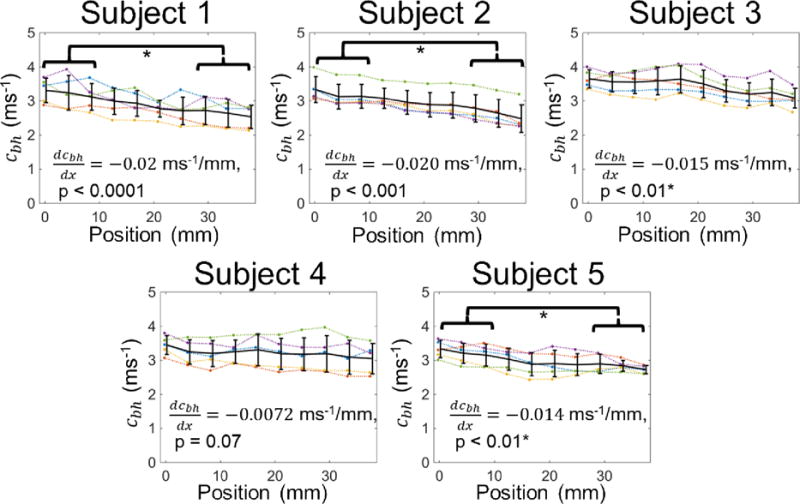
Pulse wave velocity distribution recovered by the PWIP for all subjects. Individual inversions are shown as dotted lines, and the mean and standard deviation at each location are plotted as solid lines. The PWV had a downward trend in all cases which was significant for subjects, 1, 2, 3 and 5, and significant differences between the PWV at the two ends of the probe were found for subjects 1, 2 and 5.
Figure 6 compares the average PWIP estimate of PWV across the imaged width with conventional PWI using 50% upstroke wave tracking (Luo et al. 2012, Vappou et al. 2012, Li et al. 2015), and reveals comparable repeatability of measurements between the two methods. Significant differences of PWV between the methods were detected for subjects 4 and 5.
Figure 6.
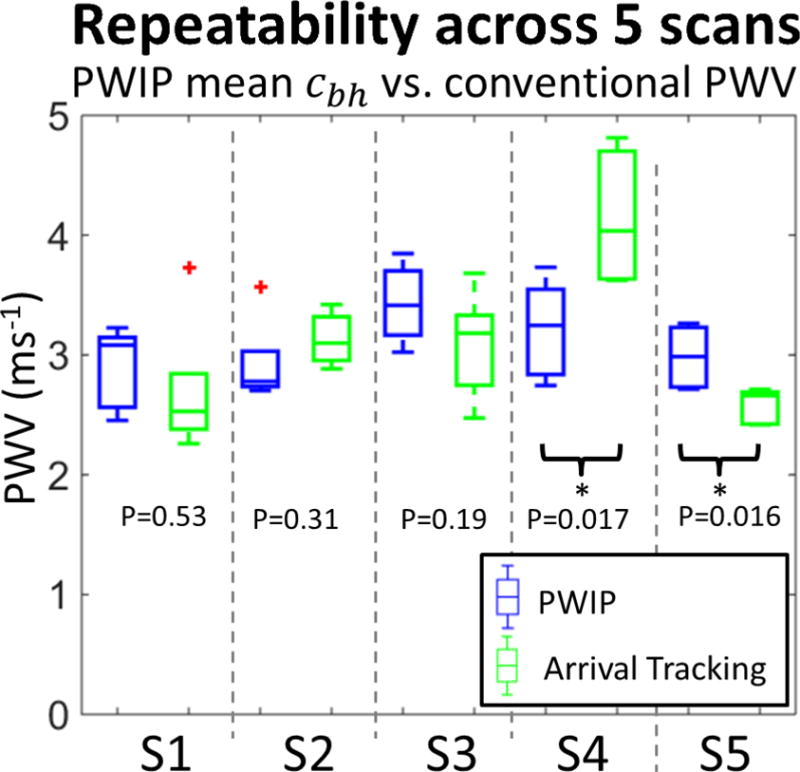
Comparison of the PWIP results with global PWV estimation using wavefront tracking for all 5 subjects (S1–S5). For each subject, the mean Bramwell-Hill PWV (cbh) for the PWIP across 5 repeated scans is depicted by blue boxes on the left, and the PWV estimated by wavefront tracking across 5 repeated scans is depicted by green boxes on the right. Subject 4 and 5 had a statistically significant difference between the two methods.
Subject details along with numerical values of average kp, PWV, and repeatability are summarized in table 1. PWV values ranged from 2.9–3.43ms−1, which is at the lower end of the range expected for young, healthy subjects.
Table 1.
Results for all 5 volunteers. The PWIP results are presented as the overall mean ± the standard deviation of mean values for the 5 scans, and the * indicates a statistically significant difference between the PWIP and wavefront tracking PWV estimates.
| Subject | Age | BP | D (mm) |
PWIP
(×10−9 m2Pa−1) |
PWIP
(ms−1) |
Wavefront tracking cp |
|---|---|---|---|---|---|---|
| 1 | 32 | 133/71 | 14.9 | 5.56 ± 1.6 | 2.90 ± 0.35 | 2.70 ± 0.60 |
| 2 | 29 | 112/60 | 20.0 | 4.38 ± 0.97 | 2.93 ± 0.36 | 3.13 ± 0.22 |
| 3 | 22 | 130/78 | 16.6 | 3.26 ± 0.58 | 3.43 ± 0.33 | 3.08 ± 0.45 |
| 4 | 22 | 122/69 | 23.9 | 3.84 ± 1.2 | 3.21 ± 0.41 | 4.15 ± 0.56 * |
| 5 | 24 | 114/83 | 21.4 | 5.26 ± 0.91 | 2.98 ± 0.26 | 2.58 ± 0.15 * |
When the primary pulse reflection was included, repeatability deteriorated from an average coefficient of variation across subjects of 23% to 27% for compliance, and 11% to 14% for PWV. Figure 7 shows typical examples of the fitted model displacements for cases when the primary pulse reflection is included or excluded. When included in the measured data, the downstream reflection is only partially captured by the model, most likely due to the highly simplified resistance BC applied at the carotid bifurcation.
Figure 7.
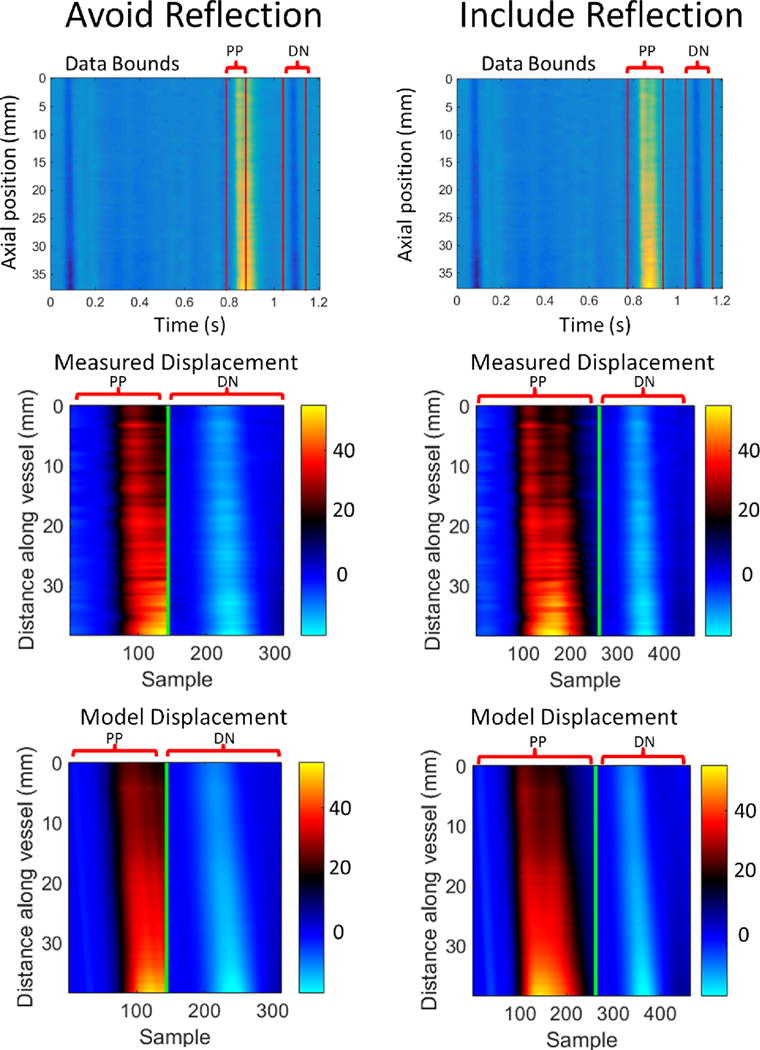
Top row: Data bounds for selection of the primary pulse (PP) and dicrotic noth (DN) for cases where the reflection was excluded (left column) and included (right column). Typical measured incremental displacements (middle row) are compared to the fitted model displacements (bottom row) for each case (units are μm). Repeatability deteriorated when the primary pulse reflection was included.
The ratio of compliance estimates at the downstream and upstream ends of the imaged region are compared to an equivalent ratio of the PWIP kp estimates in table 2. Both methods find higher median compliance at the downstream end of the imaged region for all 5 subjects, and nearly all individual measurements have a compliance ratio above 1.
Table 2.
Ratio of the compliance of the downstream and upstream end of the imaging volume using the PWIP, and estimates of the cross-sectional area change (equation 6). Values are presented as the median and range over the 5 repeated scans for each subject.
| Subject | PWIP Ratio | Range | Area change ratio | Range |
|---|---|---|---|---|
| 1 | 1.41 | 1.08 – 1.66 | 1.28 | 1.04 – 1.52 |
| 2 | 1.45 | 1.23 – 1.71 | 1.52 | 1.12 – 1.64 |
| 3 | 1.31 | 1.24 – 1.80 | 1.09 | 1.06 – 1.64 |
| 4 | 1.05 | 0.93 – 1.21 | 1.02 | 0.94 – 1.19 |
| 5 | 1.29 | 1.12 – 1.62 | 1.13 | 1.01 – 1.19 |
Discussion
Previous studies have demonstrated that the PWIP can accurately imaging known compliance distributions in silicone phantoms (McGarry et al. 2016). This in vivo investigation of the PWIP was promising, and demonstrated feasibility of applying the PWIP for in vivo human carotid compliance imaging. Mapping of compliance of healthy human common carotid arteries revealed an increasing trend in the direction of the bifurcation. The spatial distribution of compliance along the common carotid artery has not previously been reported; therefore, independent measurements such as ex vivo or pressure catheter experiment are required to confirm this result. These methods are invasive, hence cannot be applied in healthy humans and are outside the scope of this study. However, assuming a constant pulse pressure across the short imaged region and computing the ratio of upstream and downstream compliance through the overall diameter change supports the findings of the PWIP, as illustrated by table 2. Average compliance values ranged from 3.26 – 5.56× 10⁻⁹ m2Pa−1, which is somewhat higher than the range of previously published values of 0.5–2.2× 10 9m2Pa−1 (Hansen et al. 1995, Gamble et al. 1994). The lower compliance in those studies may be because they measured compliance using the diameter change between diastolic and systolic pressure, whereas the PWIP measurements use data from a smaller range of pulse pressure, i.e., during the pulse propagation. The nonlinear stress strain behavior of artery walls would result in stiffer walls, hence lower compliance at higher pressure. Variability of the PWIP compliance ranged from 0.6–1.6× 10⁻⁹ m2Pa−1, which can be considered moderately repeatable.
Based on previously published studies, the PWV is expected to be within the range of 4.0–5.7ms−1 for these relatively young subjects with normal blood pressure (Vappou et al. 2012, Luo et al. 2012, Kröner et al. 2014). As illustrated in Figures 5 and 6 as well as Table 1, the PWIP estimated a relatively small inter-subject range of 2.9–3.4 ms−1, whereas wavefront tracking had a wider range of 2.58–4.15ms−1. The imaging region in this study was intentionally placed close to the carotid bifurcation to ensure that the downstream reflection is included in the data to test the approximate reflection modeling in the PWIP. Previous studies using conventional wavefront tracking have avoided the reflection by imaging further away from the bifurcation to ensure a single forward wave, and other methods have shown errors in PWV measured near reflections (Alastruey et al. 2011, Borlotti et al. 2014). In phantoms, the PWIP has been demonstrated to perform well in the presence of internally generated reflections due to inhomogeneities; as well as downstream reflections from the fittings (Mcgarry et al. 2016). In this study, we expect that the PWIP BC applied at the bifurcation will reduce errors because major reflection sources are included in the model. Figure 5 indicates that the PWV decreases in the direction of the bifurcation, which could account for lower PWV values in this study compared to previous work. Variability of PWV measurements are within the range of 0.26 – 0.41 ms−1 for the PWIP, whereas conventional wavefront tracking had similar variability (between 0.15 and 0.6ms−1). Previous studies have shown similar wavefront tracking variability of 0.3–0.5 ms−1 in the carotid (Luo et al. 2012), and 0.3–0.6 ms−1 in the aorta (Vappou et al. 2010). Variability was lower for the PWV compared to the compliance since .
Healthy arteries are not expected to have strong spatial property inhomogeneities. Therefore, internally generated reflections would be minimal, which is ideal for wavefront tracking as an isolated forward travelling wave is generally identifiable. The PWIP had equivalent variability to wavefront tracking, and has the added benefit of spatially resolved measurements. Two of the 5 subjects had significant differences between the PWIP and wavefront tracking, likely due to reflections from the carotid bifurcation altering the apparent wavespeed estimated by wavefront tracking. The PWIP roughly approximates these reflections through the outlet BC, therefore, is less affected so we do not necessarily expect the two methods to produce the same answer. The model-based approach of the PWIP also accounts for internally generated reflections, which will be present in pathological arteries; studies of atherosclerosis and aneurysms are a promising application for future studies using the PWIP.
Arteries have three main layers, the intima, media and adventitia, each with different mechanical properties (Sommer et al. 2010). Pathological cases such as plaques and aneurysms can have even more complex structures. The 1D compliance mapping of the PWIP can only estimate the overall compliance of each cross-section, which is a function of the cross-sectional mechanical properties and geometry. Additional information such as displacement or strain maps of the cross-section may be required to map the mechanical properties in 3D.
Limitations of the PWIP forward model include some of the simplifying assumptions which could lead to model data mismatch, and errors in the compliance estimate. The 1D model requires negligible radial fluid flow, which is reasonable in straight arteries. However, cases of severe stenosis, strong curvature, or across bifurcations may have significant radial flow and phenomena such as vortices which violate the 1D assumption. Three-dimensional fluid structure interaction models (Shahmirzadi and Konofagou 2012, Figueroa et al. 2006) would be required to address 3D flow effects, which is currently computationally unfeasible for an inverse problem requiring thousands of forward problem solutions. The flat velocity profile assumption can be relaxed using a momentum-flux correction coefficient if the velocity profile is known (Sherwin et al. 2003). The reference vessel area, Ao(x), is measured from ultrasound B-mode images. Ao may be underestimated if the imaging plane is not along the vessel centerline. The PWV is given by equation 3, which suggests that kp would be underestimated by the same factor as Ao to maintain an equivalent model PWV. The linearization assumption of relatively low fluid flow (u ≪ PWV) is reasonable near diastole. However, carotid blood velocity during systole is approximately 0.4 ms−1 (Nichols et al. 2011). This assumption can be relaxed by using the full nonlinear pulse wave equations (Sherwin et al. 2003). However, additional measurements of blood velocity through pulse-Doppler imaging or speckle tracking (Luo and Konofagou 2011) would likely be required to avoid non-unique solutions. Geometric and material nonlinearity act to change the compliance across the cardiac cycle, and both are currently ignored. Therefore, results in this study are average values. Both effects could be easily included in a nonlinear solver. The degree of material nonlinearity could potentially be parameterized estimated by the inverse problem, which could constitute valuable diagnostic criteria as the relative abundance of elastin and collagen has a strong effect on nonlinear behavior. Viscous behavior of the vessel wall is also currently ignored, which is a reasonable assumption across small sections of large vessels as the pulse wave shape changes caused by viscoelastic walls are only minor (Wang et al. 2016, Stojadinović et al. 2015). Again, this assumption could be relaxed by modifying equation 2 to include a term proportional to, , and the parameter describing the viscous contribution could be estimated as part of the inverse problem. Adding extra unknown parameters to the inverse problem can complicate the optimization process due to ‘cross-talk’, where variations in the mechanical response due to one parameter type can be partially accounted for by a different parameter (Van Houten et al. 2005). The large number of available measurements from high framerate US imaging, along with multi-resolution support of model parameters (McGarry et al. 2012) helps to mitigate crosstalk. However, robust algorithm design would be required to ensure the true minima in the objective function are found when multiple parameter types are being estimated.
Another limitation of the current approach is representing the downstream reflection with the simplified resistance BC applied at the bifurcation. In reality, multiple reflections occur along the arterial tree, and figure 7 indicates that the primary pulse reflection is not particularly well modelled. More advanced Windkessel or arterial tree outlet BCs (Guan et al. 2016) may improve accuracy of the PWIP where downstream reflections are included.
Conclusion
The PWIP is a model-based strategy which fits unknown parameters of a computational model of pulse wave propagation to readily obtainable vessel wall displacement data. Compared to conventional wavefront tracking, the PWIP uses much more of the available data, accounts for reflections, and produces a spatially resolved compliance estimate. The initial in vivo evaluation of the PWIP in healthy arteries in this study demonstrated similar repeatability to wavefront tracking, and the PWIP indicates the compliance of the common carotid artery increases approaching the bifurcation. The PWIP is well suited to future applications in focal arterial diseases such as aneurysms and plaques, where internally generated reflections make conventional processing challenging. Model-based strategies such as the PWIP allow more sophisticated mechanical effects to be incorporated, including nonlinearity, viscosity and more appropriate outlet BCs to better represent downstream reflections, providing avenues for future improvements.
Acknowledgments
We gratefully acknowledge funding from NIH R01HL114358
Footnotes
Publisher's Disclaimer: This is a PDF file of an unedited manuscript that has been accepted for publication. As a service to our customers we are providing this early version of the manuscript. The manuscript will undergo copyediting, typesetting, and review of the resulting proof before it is published in its final citable form. Please note that during the production process errors may be discovered which could affect the content, and all legal disclaimers that apply to the journal pertain.
Conflict of Interest Statement:
No relevant conflicts of interest exist for any of the authors.
References
- Alastruey J, Khir AW, Matthys KS, Segers P, Sherwin SJ, Verdonck PR, Parker KH, Peiro J. Pulse wave propagation in a model human arterial network: assessment of 1-D visco-elastic simulations against in vitro measurements. Journal of biomechanics. 2011;44(12):2250–2258. doi: 10.1016/j.jbiomech.2011.05.041. [DOI] [PMC free article] [PubMed] [Google Scholar]
- Allen JD, Ham KL, Dumont DM, Sileshi B, Trahey GE, Dahl JJ. The development and potential of acoustic radiation force impulse (ARFI) imaging for carotid artery plaque characterization. Vascular Medicine. 2011 doi: 10.1177/1358863X11400936. 1358863X11400936. [DOI] [PMC free article] [PubMed] [Google Scholar]
- Apostolakis IZ, McGarry MD, Bunting EA, Konofagou EE. Pulse wave imaging using coherent compounding in a phantom setup and in vivo. 2016 doi: 10.1088/1361-6560/aa553a. Under Review. [DOI] [PMC free article] [PubMed] [Google Scholar]
- Apostolakis IZ, Nandlall SD, Konofagou EE. Piecewise pulse wave imaging (pPWI) for detection and monitoring of focal vascular disease in murine aortas and carotids in vivo. IEEE transactions on medical imaging. 2016;35(1):13–28. doi: 10.1109/TMI.2015.2453194. [DOI] [PMC free article] [PubMed] [Google Scholar]
- Borlotti A, Li Y, Parker KH, Khir AW. Experimental evaluation of local wave speed in the presence of reflected waves. Journal of biomechanics. 2014;47(1):87–95. doi: 10.1016/j.jbiomech.2013.10.007. [DOI] [PubMed] [Google Scholar]
- Bramwell JC, Hill AV. The velocity of the pulse wave in man. Proceedings of the Royal Society of London. Series B, Containing Papers of a Biological Character. 1922;93(652):298–306. [Google Scholar]
- Couade M, Pernot M, Prada C, Messas E, Emmerich J, Bruneval P, Tanter M. Quantitative assessment of arterial wall biomechanical properties using shear wave imaging. Ultrasound in medicine & biology. 2010;36(10):1662–1676. doi: 10.1016/j.ultrasmedbio.2010.07.004. [DOI] [PubMed] [Google Scholar]
- Dijk JM, Van Der Graaf Y, Grobbee DE, Banga JD, Bots ML, SMART Study Group Increased arterial stiffness is independently related to cerebrovascular disease and aneurysms of the abdominal aorta the second manifestations of arterial disease (smart) study. Stroke. 2004;35(7):1642–1646. doi: 10.1161/01.STR.0000130513.77186.26. [DOI] [PubMed] [Google Scholar]
- Figueroa CA, Vignon-Clementel IE, Jansen KE, Hughes TJ, Taylor CA. A coupled momentum method for modeling blood flow in three-dimensional deformable arteries. Computer methods in applied mechanics and engineering. 2006;195(41):5685–5706. [Google Scholar]
- Fung YC. Biomechanics: circulation. Springer Science & Business Media; 2013. [Google Scholar]
- Gamble G, Zorn J, Sanders G, MacMahon S, Sharpe N. Estimation of arterial stiffness, compliance, and distensibility from M-mode ultrasound measurements of the common carotid artery. Stroke. 1994;25(1):11–16. doi: 10.1161/01.str.25.1.11. [DOI] [PubMed] [Google Scholar]
- Guan D, Liang F, Gremaud PA. Comparison of the Windkessel model and structured-tree model applied to prescribe outflow boundary conditions for a one-dimensional arterial tree model. Journal of biomechanics. 2016;49(9):1583–1592. doi: 10.1016/j.jbiomech.2016.03.037. [DOI] [PubMed] [Google Scholar]
- Hanon O, Haulon S, Lenoir H, Seux ML, Rigaud AS, Safar M, Girerd X, Forette F. Relationship between arterial stiffness and cognitive function in elderly subjects with complaints of memory loss. Stroke. 2005;36(10):2193–2197. doi: 10.1161/01.STR.0000181771.82518.1c. [DOI] [PubMed] [Google Scholar]
- Hansen F, Mangell P, Sonesson B, Länne T. Diameter and compliance in the human common carotid artery-variations with age and sex. Ultrasound in medicine & biology. 1995;21(1):1–9. doi: 10.1016/0301-5629(94)00090-5. [DOI] [PubMed] [Google Scholar]
- Johnson CP, Baugh R, Wilson CA, Burns J. Age related changes in the tunica media of the vertebral artery: implications for the assessment of vessels injured by trauma. Journal of clinical pathology. 2001;54(2):139–145. doi: 10.1136/jcp.54.2.139. [DOI] [PMC free article] [PubMed] [Google Scholar]
- Kolipaka A, Woodrum D, Araoz PA, Ehman RL. MR elastography of the in vivo abdominal aorta: a feasibility study for comparing aortic stiffness between hypertensives and normotensives. Journal of Magnetic Resonance Imaging. 2012;35(3):582–586. doi: 10.1002/jmri.22866. [DOI] [PMC free article] [PubMed] [Google Scholar]
- Kröner ES, Lamb HJ, Siebelink HMJ, Cannegieter SC, Boogaard PJ, Wall EE, Westenberg JJ. Pulse wave velocity and flow in the carotid artery versus the aortic arch: effects of aging. Journal of Magnetic Resonance Imaging. 2014;40(2):287–293. doi: 10.1002/jmri.24470. [DOI] [PubMed] [Google Scholar]
- Laurent S, Boutouyrie P, Asmar R, Gautier I, Laloux B, Guize L, Ducimetiere P, Benetos A. Aortic stiffness is an independent predictor of all-cause and cardiovascular mortality in hypertensive patients. Hypertension. 2001;37(5):1236–1241. doi: 10.1161/01.hyp.37.5.1236. [DOI] [PubMed] [Google Scholar]
- Li RX, Luo J, Balaram SK, Chaudhry FA, Shahmirzadi D, Konofagou EE. Pulse wave imaging in normal, hypertensive and aneurysmal human aortas in vivo: a feasibility study. Physics in medicine and biology. 2013;58(13):4549. doi: 10.1088/0031-9155/58/13/4549. [DOI] [PMC free article] [PubMed] [Google Scholar]
- Li RX, Qaqish WW, Shahmirzadi D, Konofagou EE. 2012 Annual International Conference of the IEEE Engineering in Medicine and Biology Society. IEEE; 2012. Aug, Performance assessment and optimization of Pulse Wave Imaging (PWI) in ex vivo canine aortas and in vivo normal human arteries; pp. 3179–3182. [DOI] [PubMed] [Google Scholar]
- Luo J, Konofagou EE. Imaging of wall motion coupled with blood flow velocity in the heart and vessels in vivo: a feasibility study. Ultrasound in medicine & biology. 2011;37(6):980–995. doi: 10.1016/j.ultrasmedbio.2011.03.004. [DOI] [PMC free article] [PubMed] [Google Scholar]
- Luo J, Konofagou EE. A fast normalized cross-correlation calculation method for motion estimation. IEEE Trans Ultrason Ferroelectr Freq Control. 2010;57(6):1347–1357. doi: 10.1109/TUFFC.2010.1554. [DOI] [PMC free article] [PubMed] [Google Scholar]
- Luo J, Li RX, Konofagou EE. Pulse wave imaging of the human carotid artery: an in vivo feasibility study. IEEE transactions on ultrasonics, ferroelectrics, and frequency control. 2012;59(1):174–181. doi: 10.1109/TUFFC.2012.2170. [DOI] [PMC free article] [PubMed] [Google Scholar]
- Mcgarry M, Li R, Apostolakis I, Nauleau P, Konofagou EE. An inverse approach to determining spatially varying arterial compliance using ultrasound imaging. Physics in Medicine and Biology. 2016;61(15):5486. doi: 10.1088/0031-9155/61/15/5486. [DOI] [PMC free article] [PubMed] [Google Scholar]
- McGarry MDJ, Van Houten EEW, Johnson CL, Georgiadis JG, Sutton BP, Weaver JB, Paulsen KD. Multiresolution MR elastography using nonlinear inversion. Medical physics. 2012;39(10):6388–6396. doi: 10.1118/1.4754649. [DOI] [PMC free article] [PubMed] [Google Scholar]
- Mitchell GF, Parise H, Benjamin EJ, Larson MG, Keyes MJ, Vita JA, Ramachandran S, Levy D. Changes in arterial stiffness and wave reflection with advancing age in healthy men and women the Framingham Heart Study. Hypertension. 2004;43(6):1239–1245. doi: 10.1161/01.HYP.0000128420.01881.aa. [DOI] [PubMed] [Google Scholar]
- Nenadic IZ, Urban MW, Mitchell SA, Greenleaf JF. Lamb wave dispersion ultrasound vibrometry (LDUV) method for quantifying mechanical properties of viscoelastic solids. Physics in medicine and biology. 2011;56(7):2245. doi: 10.1088/0031-9155/56/7/021. [DOI] [PMC free article] [PubMed] [Google Scholar]
- Nichols W, O’Rourke M, Vlachopoulos C, editors. McDonald’s blood flow in arteries: theoretical, experimental and clinical principles. CRC Press; 2011. [Google Scholar]
- O’Rourke MF, Hashimoto J. Mechanical factors in arterial aging. J Am Coll Cardiol. 2007;50:1–13. doi: 10.1016/j.jacc.2006.12.050. [DOI] [PubMed] [Google Scholar]
- Oliver JJ, Webb DJ. Noninvasive assessment of arterial stiffness and risk of atherosclerotic events. Arteriosclerosis, Thrombosis, and Vascular Biology. 2003;23(4):554–566. doi: 10.1161/01.ATV.0000060460.52916.D6. [DOI] [PubMed] [Google Scholar]
- Rabben SI, Stergiopulos N, Hellevik LR, Smiseth OA, Slørdahl S, Urheim S, Angelsen B. An ultrasound-based method for determining pulse wave velocity in superficial arteries. Journal of biomechanics. 2004;37(10):1615–1622. doi: 10.1016/j.jbiomech.2003.12.031. [DOI] [PubMed] [Google Scholar]
- Shahmirzadi D, Konofagou EE. Detection of aortic wall inclusions using regional pulse wave propagation and velocity in silico. Artery research. 2012;6(3):114–123. doi: 10.1016/j.artres.2012.05.004. [DOI] [PMC free article] [PubMed] [Google Scholar]
- Sherwin S, Formaggia L, Peiro J, Franke V. Computational modelling of 1D blood flow with variable mechanical properties and its application to the simulation of wave propagation in the human arterial system. International Journal for Numerical Methods in Fluids. 2003;43(6–7):673–700. [Google Scholar]
- Stojadinović B, Tenne T, Zikich D, Rajković N, Milošević N, Lazović B, Žikić D. Effect of viscosity on the wave propagation: Experimental determination of compression and expansion pulse wave velocity in fluid-fill elastic tube. Journal of biomechanics. 2015;48(15):3969–3974. doi: 10.1016/j.jbiomech.2015.09.016. [DOI] [PubMed] [Google Scholar]
- Van Houten EE, Doyley MM, Kennedy FE, Paulsen KD, Weaver JB. A three-parameter mechanical property reconstruction method for MR-based elastic property imaging. IEEE transactions on medical imaging. 2005;24(3):311–324. doi: 10.1109/tmi.2004.842451. [DOI] [PubMed] [Google Scholar]
- van Popele NM, Grobbee DE, Bots ML, Asmar R, Topouchian J, Reneman RS, Witteman JC. Association between arterial stiffness and atherosclerosis The Rotterdam Study. Stroke. 2001;32(2):454–460. doi: 10.1161/01.str.32.2.454. [DOI] [PubMed] [Google Scholar]
- Vappou J, Luo J, Konofagou EE. Pulse wave imaging for noninvasive and quantitative measurement of arterial stiffness in vivo. American journal of hypertension. 2010;23(4):393–398. doi: 10.1038/ajh.2009.272. [DOI] [PMC free article] [PubMed] [Google Scholar]
- Vappou J, Luo J, Okajima K, Di Tullio M, Konofagou E. Aortic pulse wave velocity measured by pulse wave imaging (PWI): a comparison with applanation tonometry. Artery research. 2011;5(2):65–71. doi: 10.1016/j.artres.2011.03.002. [DOI] [PMC free article] [PubMed] [Google Scholar]
- Vignon IE, Taylor CA. Outflow boundary conditions for one-dimensional finite element modeling of blood flow and pressure waves in arteries. Wave Motion. 2004;39(4):361–374. [Google Scholar]
- Wang XF, Nishi S, Matsukawa M, Ghigo A, Lagrée PY, Fullana JM. Fluid friction and wall viscosity of the 1D blood flow model. Journal of biomechanics. 2016;49(4):565–571. doi: 10.1016/j.jbiomech.2016.01.010. [DOI] [PubMed] [Google Scholar]
- Wilkinson IB, Fuchs SA, Jansen IM, Spratt JC, Murray GD, Cockcroft JR, Webb DJ. Reproducibility of pulse wave velocity and augmentation index measured by pulse wave analysis. Journal of hypertension. 1998;16(12):2079–2084. doi: 10.1097/00004872-199816121-00033. [DOI] [PubMed] [Google Scholar]
- Zieman SJ, Melenovsky V, Kass DA. Mechanisms, pathophysiology, and therapy of arterial stiffness. Arteriosclerosis, thrombosis, and vascular biology. 2005;25(5):932–943. doi: 10.1161/01.ATV.0000160548.78317.29. [DOI] [PubMed] [Google Scholar]
- Sommer G, Regitnig P, Költringer L, Holzapfel GA. Biaxial mechanical properties of intact and layer-dissected human carotid arteries at physiological and supraphysiological loadings. American Journal of Physiology-Cell Physiology. 2010;298(3):H898. doi: 10.1152/ajpheart.00378.2009. [DOI] [PubMed] [Google Scholar]


