

Abstract
An increasing body of evidence has shown the important role of the gut microbiome in mediating toxicity following environmental contaminant exposure. The goal of this study was to determine if the adverse metabolic effects of chronic 2,3,7,8-tetrachlorodibenzo-p-dioxin (TCDD) exposure would be sufficient to exacerbate hyperglycemia, and to further determine if these outcomes were attributable to the gut microbiota alteration. Adult male CD-1 mice were exposed to TCDD (6 μg/kg body weight biweekly) by gavage and injected (i.p.) with STZ (4 × 50 mg/kg body weight) to induced hyperglycemia. 16S rRNA sequencing was used to characterize the changes in the microbiome community composition. Glucose monitoring, flow cytometry, histopathology, and organ characterization were performed to determine the deleterious phenotypic changes of TCDD exposure. Chronic TCDD treatment did not appear to exacerbate STZ-induced hyperglycemia as blood glucose levels were slightly reduced in the TCDD treated mice; however, polydipsia and polyphagia were observed. Importantly, TCDD exposure caused a dramatic change in microbiota structure, as characterized at the phylum level by increasing Firmicutes and decreasing Bacteroidetes while at the family level most notably by increasing Lactobacillaceae and Desulfovibrionaceae, and decreasing Prevotellaceae and ACK M1. The changes in microbiota were further found to be broadly associated with phenotypic changes seen from chronic TCDD treatment. In particular, the phylum level Bacteroidetes to Firmicutes ratio negatively correlated with both liver weight and liver pathology, and positively associated with %CD3+NK+ T cells, a key mediator of host-microbial interactions. Collectively, these findings suggest that the dysregulated gut microbiome may contribute to the deleterious effects (e.g., liver toxicity) seen with TCDD exposure.
Keywords: TCDD, Microbiome, Hyperglycemia, Liver, Immunotoxicity
1. Introduction
Special attention has been given to persistent organic pollutants as one of the many factors responsible for the rising global rates of obesity, diabetes, autoimmune diseases, and some developmental disorders (Neel and Sargis, 2011). Of these, aryl hydrocarbon receptor (AhR) modulators, particularly 2,3,7,8-tetrachlorodibenzo-p-dioxin (TCDD), have received a great deal of interests due to the variable effects between species and even strains, and multi-organ toxicities (Mandal, 2005). Although many different exposure studies have been conducted with TCDD, the relationship between TCDD and diabetes is not clear. Some epidemiological studies have shown an association between TCDD levels and diabetes including hyperinsulinemia and insulin resistance (Cranmer et al., 2000, Henriksen et al., 1997). A cohort study of accidently exposed young women also found a positive correlation (Warner et al., 2013) while a recent meta-analysis showed no correlation (Goodman et al., 2015). However, positive associations between diabetes and TCDD exposure have not been reproduced in laboratory animal models. In fact, TCDD has been shown to reverse hyperglycemia in a type 2 diabetes mellitus (T2D) rat model (Fried et al., 2010) and suppress type 1 diabetes mellitus (T1D) in non-obese diabetic (NOD) mice (Kerkvliet et al., 2009). Despite the appearing anti-diabetic effects, TCDD has been shown to promote a host of adverse metabolic diseases, including non-alcoholic fatty liver disease (NAFLD), a wasting-like syndrome, and cancer in lab animals. These effects are possibly mediated through the immunotoxicity (Mandal, 2005; Shan et al., 2014).
Of the many factors that contribute to the pathogenesis of metabolic disease, the gut microbiota was shown to strongly contribute to the incidence of both T1D and T2D in rodents and humans (Kostic et al., 2015; Larsen et al., 2010; Markle et al., 2013). A decline of gut bacterial α diversity and a shift in taxonomic composition favoring pro-inflammatory microbes preceded T1D (Kostic et al., 2015). The sex preferential T1D incidence in NOD mice was shown to be, at least in part, due to the sexually dimorphic microbiota composition (Markle et al., 2013). In humans, it was shown that T2D was also associated with gut dysbiosis (Qin et al., 2012). Moreover, it has been reported that exposure to the TCDD-like compound 2,3,7,8-tetrachlorodibenzofuran (TCDF) perturbed the microbiota composition (Zhang et al., 2015).
Presence of hyperglycemia may indicate developing diabetes or a predisposition to the disorder. It was hypothesized that TCDD would adversely modulate the gut microbiome by shifting to a pro-inflammatory state, thereby contributing to an exacerbation of streptozotocin (STZ)-induced hyperglycemia in male CD-1 mice. Our aim was to explore the factors that could help explain the discrepancy between animal models and human epidemiological studies on the diabetogenic potential of TCDD exposure. To accomplish this, we treated male CD-1 mice at two-week intervals with TCDD at a low dose (6 μg/kg) and assessed the progression of hyperglycemia following multiple low doses (MLD) STZ treatment. The outbred CD-1 mouse strain is commonly used in toxicology studies, which has low responsiveness to Ah compounds possibly due to the low expression of AhR protein in this strain (Zhang et al., 2004). This is relevant to human exposure, as humans appear to be relatively resistant to adverse effects of dioxins (Okey, 2007). Furthermore, our previous studies using several strains of mice including B6C3F1, C57BL/6, C3H/HeN, NOD and CD-1 have suggested that the CD-1 mice developed diabetes at a similar rate as NOD mice following MLZ-STZ treatment, and has the potential to detect diabetes modulation by various treatments (Zheng and Guo, 2009).
2. Materials and methods
2.1. Animals and animal exposure
Male CD-1 mice, 6–7 weeks of age, were purchased from the Charles River Laboratory (Wilmington, MA) and maintained under specific pathogen-free conditions at University of Georgia (UGA) animal facilities. The mice were housed as one per cage on a ventilated rack to avoid fighting and facilitate measurement of food and water consumption in standard plastic cages with irradiated laboratory animal bedding (The Andersons company, Maumee, Ohio), and the animal room was maintained at 21–24 °C and the relative humidity between 40 and 70% with a 12-h light/dark cycle. The mice consumed PicoLab Rodent Diet 20 (5053; LabDiet, Lawrenceville, GA) and filtered tap water from water bottles ad libitum. All animal procedures were conducted under an animal protocol approved by the UGA Institutional Animal Care and Use Committee.
TCDD, obtained as a standard of 99% purity from Toronto Research Chemicals Inc. (Canada), was dissolved in DMSO (1 mg/ml) and diluted in corn oil. A similar solution of DMSO in corn oil was prepared as a vehicle (VH) control for TCDD treatment. All mice were dosed by gavage (100 μl/10 g bodyweight [bw]). The animals were dosed biweekly with a dose of 6 μg TCDD/kg bw, an environmentally relevant dioxin concentration, during the 26-week experimental time period (to 43 weeks of age).
2.2. Treatment with STZ
For STZ treatment, mice were injected (i.p.) with STZ (Sigma-Aldrich) solutions, prepared immediately before use, in 0.1 M citrate buffer (pH 4.5). The dosing regimen for STZ consisted of four 50 mg/kg doses: the first dose was given at approximately 37 days following the initiation of TCDD gavage (Guo et al., 2014). The second dose was administered on day 28 following the first STZ dose, the third dose was on day 63 following the first STZ dose, and the fourth dose was on day 97 following the first STZ dose. The goal was to generate a pre-diabetic hyperglycemic state (Lebovitz, 1999; Ramos-Rodriguez et al., 2013).
2.3. Measurement of blood glucose levels (BGL)
Monitoring of glycemic status was performed prior to the beginning of treatment to ensure that there were no significant differences between groups in BGL and no outlier animals. Thereafter, the animals were monitored for blood glucose changes every week. Non-fasting blood glucose was measured directly in small samples of venous blood (tail nick) using Accu-Chek Diabetes monitoring kit (Roche Diagnostics, Indianapolis, IN; Guo et al., 2014).
2.4. Body weight, water and food consumption
The water bottles were changed once a week during the 182-day exposure period. The amount of water consumed was based on the weight difference of the water bottle from the current week compared to the previous week. The weight difference was averaged over the number of days per measurement to establish the amount of water consumed (g/day/mouse). Food consumption was calculated similarly. Body weight was recorded every week.
2.5. Organ collection and single-cell suspension preparation of spleen and thymus
Animals were anesthetized by CO2 inhalation and sacrificed by cervical dislocation, and they were examined for gross pathology. The following organs were removed, cleaned of connective tissue and weighed: thymus, pancreas, liver, spleen and kidneys with adrenals. Spleen and thymus were placed in 3 ml phosphate buffered saline (PBS). Cell suspensions were prepared by pressing the spleen between the frosted ends of two microscope slides into a 60 × 15-mm Petri dish. The slides were washed with the buffer using a Pasteur pipette, and then single-cell suspensions were placed into 4-ml plastic test tubes. Splenocytes and thymocytes were then centrifuged at 300 ×g for 5 min and resuspended in 3 ml PBS.
2.6. Flow cytometric analysis of splenocytes
The respective cell types were labeled with an appropriate monoclonal antibody (mAb) conjugated with a fluorescent molecule for visualization. For splenic T cell enumeration, a fluorescein isothiocyanate (FITC) conjugated anti-mouse CD3e mAb (diluted 1:80; BD PharMingen, San Diego, CA) was used. For splenic CD8+ and CD4+ cells, a FITC conjugated mAb specific for the CD8a (Ly-2) marker and phycoerythrin (PE) conjugated anti-CD4 (BD PharMingen) were used, respectively. Anti-mouse NK1.1 with PE was used to label splenic natural killer (NK) cells (CD3−NK1.1+). For splenic neutrophils (Gr-1+Mac-3−), FITC conjugated mAbs for Gr-1 and PE conjugated anti-Mac-3 were used. Additional Abs including FITC conjugated rat anti-mouse CD24 and FITC conjugated rat anti-mouse CD25 were obtained from BD PharMingen and eBioscience (San Diego, CA), respectively. Isotype-matched irrelevant antibodies were used as controls. Following the addition of the reagents, the cells were incubated at 4 °C in the dark for 30 min. The cells were washed and enumeration performed on a Becton Dickinson LSRII Flow Cytometer in which log fluorescence intensity was read and a forward scatter threshold high enough to eliminate red blood cells. Ten thousand cells were counted for each sample.
2.7. DNA extraction
Feces were collected fresh from the mice and stored in −40 °C freezer until samples were ready to be processed. Bacterial DNAs for the acutely exposed mice were extracted using the Qiagen QIAamp DNA stool mini kit according to the manufacturer’s instructions. Extracted DNA was then placed into a 96 well plate and were normalized using SYBRGreen (Ambion). For the chronically TCDD treated mice, fecal samples were shipped to Molecular Research LP (Shallowater, TX; Mr. DNA http://mrdnalab.com/) for extraction, normalization, and inhibitor removal. DNA was extracted using the PowerSoil DNA isolation Kit according to the manufactures instructions.
2.8. PCR amplification and sequencing of bacterial 16S rRNA genes
Universal amplifications of the V1 to V3 hypervariable regions of the 16S rRNA genes were conducted using an optimized primer set comprising 27F and 534R (Frank et al., 2008). Amplicons were generated using the HotStarTaq Plus master mix kit (Qiagen, USA) in a DNA engine Tetrad2 instrument (Bio-Rad) under the following conditions: the first cycle consisted of 94 °C for 3 min, then 28 cycles at 94 °C for 30 s, 53 ° C for 40 s, and 72 °C for 1 min, and the final cycle at 72 °C for 5 min. The presence of amplicons was confirmed by gel electrophoresis on a 2% agarose gel and stained with SYBRGreen (Ambion). PCR products were quantified using Quant-iT Picogreen® quantification system (Invitrogen) and equimolar amounts (100 ng) of the PCR amplicons were mixed in a single tube using the QIAgility robotic platform. Amplification primers and reaction buffer were removed by processing the amplicons’ mixture with the AMPure Kit (Agencourt). The library preparation was performed using the Illumina TruSeq DNA library preparation protocol, and subsequently sequenced at Mr. DNA on MiSeq following the manufacturer’s guidelines.
For the acute exposure group, amplicon and sequencing were performed according to Rohland and Reich (2012). Briefly, the 16S variable region was amplified and 2 pairs of dual indexed barcodes were attached. Interior Custom dual indexed barcodes were attached followed by external dual adapter and then Illumina TruSeq barcodes. The internal methods were used to determine sample ID within a project while the external tags were used to differentiate between projects.
2.9. Bioinformatic analysis
The raw data for the chronic TCDD exposure were processed using QIIME 1.7.0 (Kuczynski et al., 2012) as follows: The raw data were first demultiplexed and quality filtered using the split_libraries.py script which removed the barcode and adapter sequences and truncated bases with a Q score <25. The demultiplexed sequences were checked for chimeras and subsequently filtered by the script identify_chimeric_sequences.py using usearch61 (Edgar, 2010). The pick_de_novo_otus.py workflow was used to generate data for downstream analysis. The core_diversity_analysis.py workflow was used to determine α and β diversity after the operational taxonomic unit (OTU) table was rarefied to a depth of 35,000 sequences per sample because the lowest sample contained 41,464 sequences per sample. The α diversity metrics used were as follows: Brillouin, Chao1, Dominance, Equitability, Heip_e, Margalef, Observed, PD_Whole_Tree, Shannon, Simpson_Reciprocal, and Simpson. The β diversities used were as follows: Chisq, Abundance Jaccard, Unweighted and Weighted Unifrac. Statistical significance for α diversity was determined using a non-parametric t-test with 999 Monte Carlo permutations. For β diversity, significance was determined using PERMANOVA (Anderson, 2001).
For the acute TCDD exposure, the raw forward and reverse reads were paired and then quality filtered by removing bases with a Q score <25 using Geneious version 8.1.6. The sequences were then merged and first separated by the forward barcode, then reversed and separated by the reverse barcode. The sequences were then merged into one Fastq file with each sample name corresponding 96 well plate location. The Fastq file was split into individual Fasta and Qual files using Qiime 1.9.0, and they were relabeled according the animal ID and concatenated using the add_qiime_labels.py command (Kuczynski et al., 2012). The same workflow for the chronically exposed treated mice was used, except that the sequences were rarefied to a depth of 3000 seqs per sample because the least amount of seqs per sample were 3026 after chimera checking and quality filtering.
2.10. LEfSe analysis
Linear discriminant analysis effect size (LEfSe) was used to determine statistically significant, differentially abundant taxa (Segata et al., 2011). The OTU biom table without singletons and chimeras was first split into taxonomic level using the summarize_taxa.py script and the resulting txt files were formatted for input into the LEfSe algorithm hosted on the Huttenhower galaxy server (http://huttenhower.sph.harvard.edu/galaxy). LEfSe first uses Kruskal-Wallis sum rank test to find significantly and differentially abundant features, then the Wilcoxon rank sum test to ensure the identified feature is biologically relevant. Linear discriminant analysis (LDA) is then performed on the identified features to determine the log10 effect size of each differentially significantly abundant feature. Features that had an LDA effect size of >2 were plotted.
2.11. Bacterial plating
Feces were weighed, and PBS added in a ratio of 10 ml per gram of feces. The feces were then homogenized and serially diluted 10 fold by sequentially adding 0.1 ml to 0.9 ml PBS. 0.1 ml of the appropriate dilutions were spread on three different types of agar plates: MacConkey (Mac), Brain-Heart Infusion (BHI), and de Man, Rogosa, and Sharpe (MRS). The plates were subsequently incubated overnight at 37 °C. The colony-forming units (CFUs) were counted manually.
2.12. Histopathology
Liver tissues were fixed in 10% buffered formalin and subjected to histopathological analysis. Tissues were stained with hematoxylin and eosin, and examined for pathological findings. Grading was performed within the study and a score was assigned based the total lesion severity (4 = Marked; 0 = no lesion).
2.13. Gut permeability assay
The mice were gavaged with either vehicle or TCDD and fasted for 6 h. The mice were then administered FITC-Dextran 4000 kDa by gavage as described (de La Serre et al., 2010). Briefly, 1 h following FITC-dextran administration, blood was collected from the tail vein. The serum was separated from the blood and absorbance was measured on a fluorescent spectrophotometer at 535 nm.
2.14. Statistical analysis
Results are presented as mean ± SEM. To determine the type of analysis to be used, the Bartlett’s Test for homogeneity was conducted. The software used was JMP Pro 10 (SAS Inc., Cary, NC). Homogenous data were analyzed using a one-way analysis of variance, and the Dunnett’s t test was used to determine differences between the control and experimental groups. Non-homogenous data were analyzed using a nonparametric analysis of variance and the Wilcoxon Rank Test to determine differences between the vehicle control group and exposure groups. A group was considered statistically significant from the control group if p ≤ 0.05.
For Correlation Analysis, data were processed using the R programming language (version 2.9.0). The cor function from the statistics package was used to determine Spearman’s correlation coefficient between pairs of variables. The heatmap was generated using the Pheatmap package after first filtering the microbiome data so that taxa were only retained if they had a relative abundance higher than 0.01. Scatterplots of specific correlations of variables were plotted in R using ggplot2, as scatterplots. Statistical and correlational values were determined using the spearman method of the cor.test function.
3. Results
3.1. Body weight and organ weights, food and water consumption, and blood glucose levels in STZ-treated male CD-1 mice following chronic TCDD exposure
TCDD treatment had no significant effects on the body weights, although TCDD-treated mice had numerically lower body weight after the third dose of STZ (Fig. 1A). For organ weights, TCDD treatment significantly increased both the absolute and relative weights of liver and spleen when compared to control mice (Table 1). In contrast, both the absolute and relative weights of thymus were decreased. No significant effects on either the absolute or the relative weights of kidneys and pancreas were observed (Table 1).
Fig. 1.
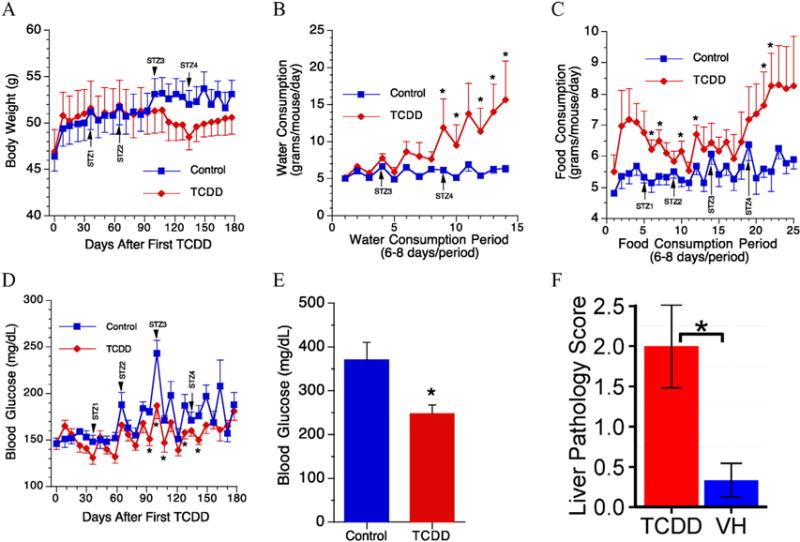
Body weight, water and food consumption, and blood glucose levels in chronic TCDD exposed mice. Measurements were taken weekly for body weight, water, and food consumption. STZ# represents time points at which mice were injected with STZ. Glucose was measured through tail-nick weekly. (A) Body weight, (B) water consumption, (C) food consumption, (D) blood glucose measured throughout experiment by tail-nick, (E) terminal blood glucose level using cardiac blood, and (F) bar chart of liver pathology score. *, p ≤ 0.05 between VH and TCDD treatment. N = 6.
Table 1.
Effects of TCDD on organ weights (both absolute and relative weights) in streptozotocin-treated male CD-1 mice.
| Groups | Thymus | Pancreas | Spleen | Kidneys | Liver | |
|---|---|---|---|---|---|---|
| VH | mg | 119 ± 10 | 310 ± 20 | 117 ± 4 | 960 ± 25 | 2663 ± 89 |
| % | 0.227 ± 0.014 | 0.598 ± 0.046 | 0.226 ± 0.013 | 1.843 ± 0.040 | 5.114 ± 0.155 | |
| TCDD | mg | 81 ± 9* | 276 ± 14 | 209 ± 5* | 974 ± 54 | 4259 ± 296* |
| % | 0.164 ± 0.019* | 0.558 ± 0.033 | 0.422 ± 0.018* | 1.955 ± 0.087 | 8.563 ± 0.541* |
Male CD-1 mice were gavaged biweekly with vehicle (corn oil) or TCDD (6 μg/kg) for up to 182 days. N = 6.
p ≤ 0.05 between VH and TCDD treatment.
The drinking water consumed (grams/mouse/day) was calculated as described (Guo et al., 2001) and the mean values are shown in Fig. 1B. The amount of water consumed by a vehicle control animal per day was approximately 5 g. No significant difference was observed in the amount of drinking water consumed between the TCDD-exposed animals and the vehicle control group in the early stages of exposure. However, there were significant increases after the fourth dose of STZ in the TCDD-exposed mice. Food consumption was also measured, and TCDD-exposed animals tended to eat more with statistical significances observed in six periods of food consumption (Fig. 1C). However, there were slight decreases in BGL in TCDD-treated mice when compared to the control with statistical significances observed on days 93, 100, 107, 128 and 142 after the initial TCDD treatment (Fig. 1D). In addition, the terminal BGL was also decreased (Fig. 1E).
3.2. Pathological and histopathological analysis of the liver following chronic TCDD exposure
Grossly, livers from two out of six TCDD-treated mice had granular and mottled appearance with multiple white foci observed. Histopathological analysis of the liver samples also revealed differences between the vehicle control (Fig. 2A) and TCDD-treated mice (Fig. 2B–D), and these lesions included (Table 2): (1) Multifocal hepatocyte proliferation without recapitulating normal lobular architecture (i.e., portal triads are missing), indicating regenerative nodules; (2) multifocal hepatocytic fatty change (single hepatocytes or small clusters of hepatocytes), degeneration, and rare necrosis in pre-existing tissue and in regenerative nodules; (3) multifocal hepatocytic megalocytosis; (4) multifocal lymphoplasmacytic, histiocytic, and sometimes neutrophilic inflammatory infiltrates in clusters of dissecting along sinusoids; (5) multifocal, moderate portal and dissecting fibrosis; (6) multifocal moderate oval cell hyperplasia; and (7) scattered starburst mitotic figures that could signify mitotic arrest. The overall severity (0–4 scale) was significantly higher in TCDD-treated mice (Fig. 1F). Histologically normal section in VH mice typically included a single, small (about 50 μm) hepatocellular necrotic focus narrowly surrounded by a tight cluster of neutrophils except for one mouse in which multifocal, mild lymphoplasmacytic and histiocytic, mostly periportal infiltrates were observed. Due to the pattern of the inflammatory infiltrates (periportal and not randomly scattered), it is possible that the infiltrates in this mouse predated treatment.
Fig. 2.
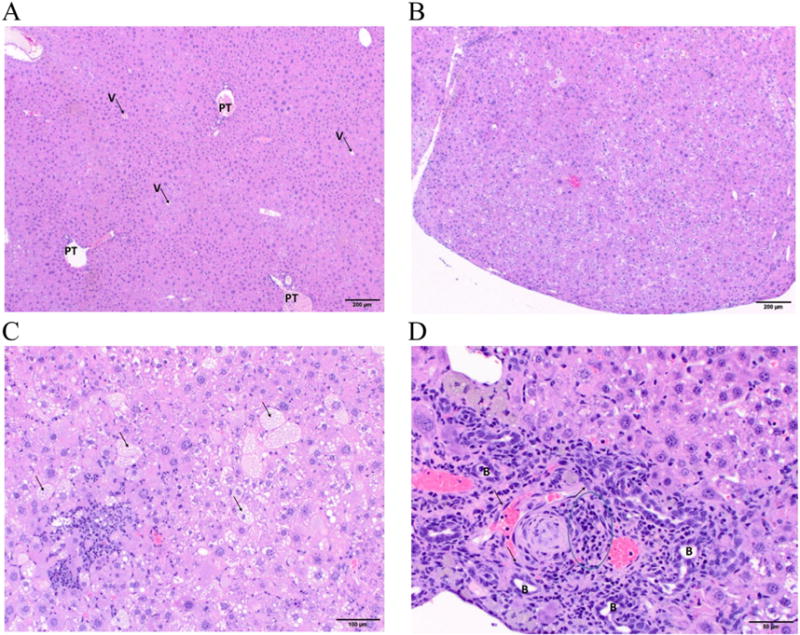
Liver histopathology in chronic TCDD exposed mice. (A) Vehicle mice: Low magnification photomicrograph of normal hepatic lobular architecture with easily identifiable portal triads (PT) and central veins (V). Hematoxylin and eosin stain, 40× original magnification, scale bar = 200 μm. (B) TCDD mice: Low magnification photomicrograph of a regenerative nodule (note bulging surface) that lacks discernable hepatic lobular architecture, due to the absence of discernable portal triads and central veins. Hematoxylin and eosin stain, 40× original magnification, scale bar = 200 μm. (C) TCDD mice: Mid-magnification photomicrograph of hepatic tissue with hepatocellular fatty change in numerous hepatocytes (arrows) and hepatocellular necrosis surrounded by a mixed inflammatory infiltrate. Hematoxylin and eosin stain, 100× original magnification, scale bar = 100 μm. (D) TCDD mice: High magnification photomicrograph of a subcapsular area with fibrosis and oval cell hyperplasia (arrows), mixed inflammatory infiltrate (outlined), and multiple profiles of proliferating biliary ducts (B). Hematoxylin and eosin stain, 200× original magnification, scale bar = 50 μm. N = 6.
Table 2.
Selected liver findings following TCDD exposure in streptozotocin-treated male CD-1 mice.
| Parameters | Vehicle | TCDD |
|---|---|---|
| Multifocal hepatocyte proliferation without recapitulating normal lobular architecture (i.e., portal triads are missing), indicating regenerative nodules | 0 | 2 |
| Multifocal hepatocytic fatty change (single hepatocytes or small clusters of hepatocytes), degeneration, and rare necrosis in pre-existing tissue and in regenerative nodules | 0 | 6 |
| Mild | 0 | 3 |
| Moderate | 0 | 3 |
| Multifocal hepatocytic megalocytosis | 0 | 2 |
| Multifocal lymphoplasmacytic, histiocytic, and sometimes neutrophilic inflammatory infiltrates in clusters of dissecting along sinusoids | 0 | 5 |
| Mild | 0 | 3 |
| Moderate to marked | 0 | 2 |
| Multifocal, moderate portal and dissecting fibrosis | 0 | 2 |
| Multifocal moderate oval cell hyperplasia | 0 | 2 |
| Scattered starburst mitotic figures that could signify mitotic arrest | 0 | 2 |
Male CD-1 mice were administered vehicle (Corn oil) or TCDD by gavage. Histopathological evaluations of livers were performed as described. Total number of mice evaluated and the number of mice with the findings are indicated in Table. N =6.
3.3. Surface marker expression by splenocyte differentials
Immune responses play an important role in MLD-STZ-induced diabetes (Gao et al., 2013; Barbu-Tudoran et al., 2013; Yaochite et al., 2013), and in TCDD-mediated toxicity (Mandal, 2005; Shan et al., 2014). Thus, flow cytometric analysis of splenocyte differentials was undertaken. TCDD treatment produced significant decreases in the percentages of splenic CD3+NK+ cells (Fig. 3A, B), CD3+CD24+ cells (Fig. 3C, D), CD4−CD8+ cells (Fig. 3E, F) and CD8+CD25+ cells (Fig. 3G, H). No significant changes were observed for CD3+NK− cells, CD3−NK+ cells, CD4+CD25− cells, CD4+CD25+ cells, CD4+CD8− cells and neutrophils (Mac-3−Gr1+; data not shown).
Fig. 3.
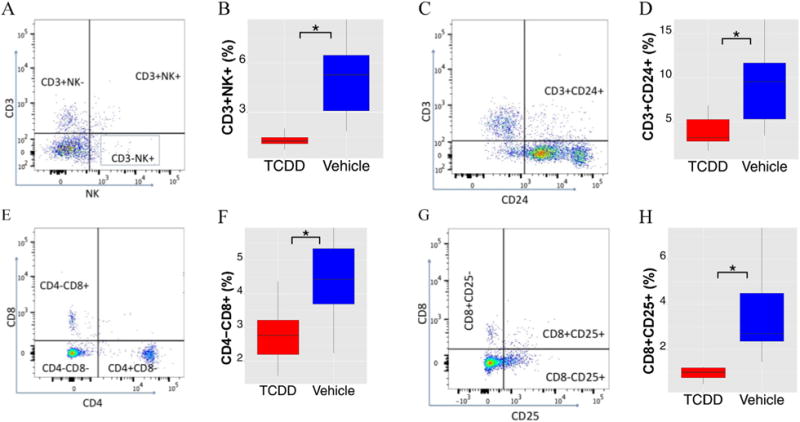
Flow cytometric analysis of splenocytes from chronic TCDD exposed mice. A, C, E, and G are representative dot plots of various cell types; B, %CD3+NK+ splenocytes; D, %CD3+CD24+ splenocytes; F, %CD4−CD8+ splenocytes; H, %CD8+CD25+ splenocytes. *, p ≤ 0.05 between VH and TCDD treatment. N = 6.
3.4. Changes in taxonomy of intestinal microbiota at phylum level following chronic TCDD exposure
To determine if there were any changes in intestinal microbiota following chronic TCDD exposure, plate counting was firstly used to identify the aerobically cultivable bacteria. The agar types used were Mac, MRS, and BHI. MRS is relatively selective for Lactobacilli growth and more generally, lactic acid bacteria, and the MRS enumeration showed that Lactobacilli were significantly (p = 0.017) more prevalent in the TCDD treated mice (Fig. 4A). BHI is a non-selective medium that supports the growth of fastidious organisms. BHI plating showed a relative increase in cultivable aerobic bacteria in TCDD treated group, but this was not statistically significant (Fig. 4B). MacConkey agar plates are highly selective and differential for gram-negative bacteria enteric bacilli. Mac enumeration did not result in colonies within the appropriate range 30 < CFUs < 300 to allow for statistical comparison of CFUs (data not shown). However, only two out of six vehicle mice produced colonies, while all TCDD-treated mice had colonies (data not shown).
Fig. 4.
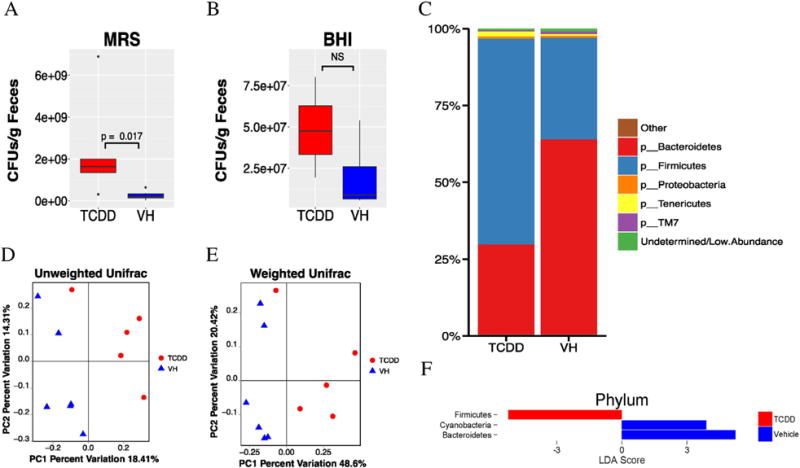
Taxonomic shifts in chronic TCDD exposed mice. Standard plate counting using MRS media, which favors the growth of lactic acid bacteria, and BHI, which promotes fastidious bacterial growth, were conducted and the results are summarized in (A and B), respectively. 16S sequencing was then performed, and the Phylum level taxonomy (C) was summarized by treatment as a barchart with low abundance taxa filtered out. Beta diversity was performed using the Unifrac metrics. PCoA was then used on the resulting distances matrixes, which were plotted in panels (D) Unweighted Unifrac (p = 0.003) and (E) Weighted Unifrac (p = 0.003). Statistical significance was determined through PERMANOVA. Significant differences in taxa were determined by LEfSe analysis. Taxa that were significantly different and had an LDA score > 2.0 were plotted (F). N = 6.
16S rRNA sequencing was then used to further characterize the changes in the microbiome community composition. Principal coordinate analysis of the β diversity metrics showed clustering based on treatment in both Unweighted and Weighted Unifrac metrics (p = 0.003, p = 0.004; Fig. 4D and E, respectively). Both metrics measure the similarities of OTUs irrespective of taxonomic assignment; however, weighted Unifrac considers the relative abundance and Unweighted Unifrac presence/absence. Thus, it was concluded that TCDD perturbed both the proportional and qualitative OTU composition of the microbiota. However, the overall decrease following TCDD exposure in α diversity, a measure of species richness or diversity within an individual sample was subtle, although several metrics were statistically significant, e.g., a decrease in richness of OTUs and species as measured by Observed OTUs (p = 0.048) and Margalef’s richness index (p = 0.049), and in evenness of species determined by Heip’s Evenness (p = 0.039) (data not shown).
The taxonomic profiles of the TCDD treated versus the vehicle mice were then compared by assigning taxonomy to OTUs and subsequently splitting the OTU table into phylogenetic level. The relative abundances of taxonomy for each treatment at the phylum level are shown in Fig. 4C. The TCDD treated mice had a noteworthy reduction in Bacteroidetes (28.9%) compared to vehicles (63.7%). In contrast, the TCDD treated mice had a substantial increase of Firmicutes (67.4%) compared to vehicles (32.9%). LDA using the LEfSe algorithm was employed to determine what features were statistically different between the two groups, and their biological significance (Segata et al., 2011). LEfSe analysis confirmed that the phylum Bacteroidetes was less abundant and Firmicutes were more abundant in TCDD-treated mice. In addition, Cyanobacteria were also much more prevalent in control mice (Fig. 4F).
The Bacteroidetes/Firmicutes (Bac/Firm) ratio provides an estimate of the predominance of two major phyla of commensal organisms, which has been associated with a number of metabolic disorders (Turnbaugh et al. 2006). Spearman correlation coefficients were then used to determine if the Bac/Firm ratio could be associated with changes in phenotypic determinants. The correlations between the Bac/Firm ratio and glucose (positive; Fig. 5A), the Bac/Firm ratio and liver weight (negative; Fig. 5B), the Bac/Firm ratio and liver pathology score (negative; Fig. 5C), the Bac/Firm ratio and spleen weight (negative; Fig. 5D), the Bac/Firm ratio and %CD3+NK+ splenocytes (positive; Fig. 5E), and the Bac/Firm ratio and CD8+CD25+ splenocytes (positive; Fig. 5F) were statistically significant. In addition, a positive correlation between the Bac/Firm ratio and thymus weight was also observed (p = 0.015; r = 0.71; data not shown).
Fig. 5.
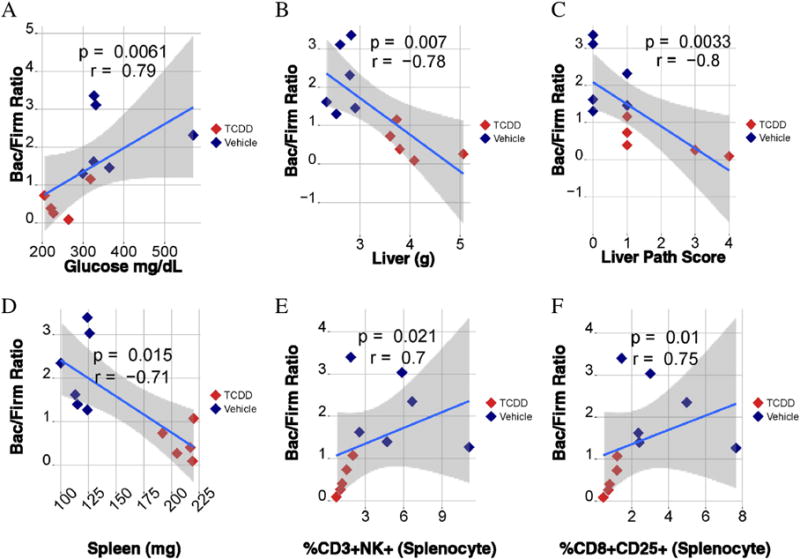
Correlational analysis of the microbiome (Bacteroidetes (Bac)/Firmicutes (Firm) ratio) and phenotypic endpoints. Spearman correlational analysis was performed (A–F). The strength and significance was determined by Spearman’s rho, which correspond to the “r” and “p” values, respectively, shown in each plot. The y axis shows Bac/Firm ratio for each animal versus blood glucose (A), liver weight (B), liver pathology score (C), spleen weight (D), %CD3+NK+ splenocytes (E), and %CD8+CD25+ (F) splenocytes. N = 6.
3.5. Changes in taxonomy of intestinal microbiota at family level following chronic TCDD exposure
Further analysis of microbiome at the family level suggested that the TCDD treated mice had increases in the families Lactobacillaceae (40.5% TCDD vs. 10.2% VH; Fig. 6A; this is in agreement with the results in Fig. 4A that Lactobacilli was more abundant), unclassified Clostridiales family (10.0% TCDD vs. 5.3% VH), Bacteroidaceae (6.8% TCDD vs. 4.2% VH) and Anaeroplasmataceae (1.7% TCDD vs. 0.4% VH). In contrast, the TCDD treated animals had reduction of the family Prevotellaceae (0.9% TCDD vs. 7.2%), unclassified Bacteroidales family (0.5% TCDD vs. 6.0% VH), S24-7 (10.6% TCDD vs. 21.9 VH), Rickenellaceae (9.7% TCDD vs. 23.7% VH), Clostridiaceae (0.2% TCDD vs. 0.8% VH), Ruminococcaceae (1.0% TCDD vs. 1.6% VH), and F16 (0.4% TCDD vs. 0.8% VH). At family level, the LEfSe analysis revealed that the TCDD treated mice had a higher abundance of Lactobacillaceae, Desulfovibrionaceae, Peptostreptococcaceae, and an unclassified family in Lactobacillales, and a lower abundance of Prevotellaceae, ACK-M1, several unclassified Bacteroidales families, an unclassified RF39 family, and an unclassified YS2 family. Fig. 6B shows the most abundant family level taxa (≥1%).
Fig. 6.
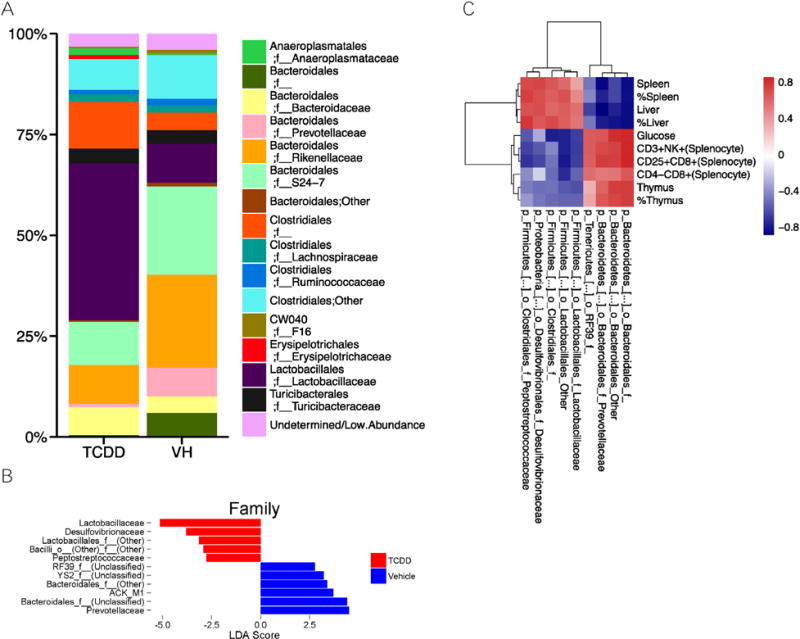
Taxonomic family level shifts in chronic TCDD exposed mice. Microbiome composition at the family level after filtering for low abundance taxa was summarized as a barchart (A). LEfSe analysis was used to determine which families were differentially abundant between treatments (B). The correlation between differentially abundant families and significantly different phenotypic endpoints were plotted as a heatmap of Spearman correlation coefficients, with hierarchal clustering based on Euclidean distance (C). N = 6.
Spearman correlation analysis was then performed to determine if the changes seen in the microbiome at family level could be directly associated with phenotypic alteration caused from TCDD exposure. Fig. 6C shows a heatmap based on the spearman correlational coefficients between phenotypic data (columns) and taxa at the family level. Cluster analysis revealed that broad changes in the taxa could be clustered with phenotypic changes seen postmortem. The relative abundance of the families Lactobacillaceae, Desulfovibrionaceae, Peptostreptococcaceae, and an unclassified family in Lactobacillales and another in Clostridiales correlated positively with spleen and liver weight, and relative spleen and liver weight. The aforementioned families negatively correlated with the %CD3+NK+, %CD25+CD8+ and %CD4−CD8+ splenocytes, blood glucose levels, thymus weight and relative thymus weight. The families Prevotellaceae, two unclassified Bacteroidales families, unclassified families in the RF39 order negatively correlated with spleen and liver weight, and relative spleen and liver weight. These families positively correlated with %CD3+NK+, %CD25+CD8+ and %CD4−CD8+ splenocytes, blood glucose levels, thymus weight and relative thymus weight.
3.6. Microbiota changes following acute TCDD exposure
To determine if the changes seen in the chronic TCDD study were due to direct effects of TCDD exposure, mice were acutely exposed to TCDD daily for two days. Feces were collected prior to dosing and 4 h post TCDD treatment. Overall, acute TCDD exposure induced relatively minor changes at the phylum level (Fig. 7A). There was a slight increase in the phylum Deferribacteres. TCDD treatment also slightly increased the relative abundance of Firmicutes as compared to the controls (VH: 32.6%; Day 1: 33.8% and Day 2: 39.4%). Conversely, TCDD slightly decreased the abundance of Bacteroidetes as compared to the controls (VH: 60%; Day 1: 53.3% and Day 2: 51.0%). While these changes were in the same direction as our chronic TCDD + STZ mice, they were not significantly different as determined through LEfSe (data not shown). Acute TCDD exposure did not appear to have any significant effects on either α diversity as measured by Phylogenetic Diversity or β diversity, as the clustering in PCoA plots of Weighted and Unweighted Unifrac appeared to be random (data not shown).
Fig. 7.
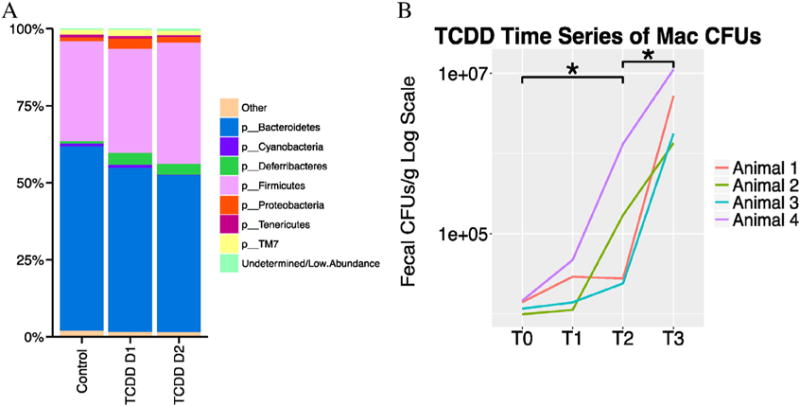
Taxonomic shifts from acute TCDD exposure. 16S sequencing was performed following a TCDD exposure time course, and the Phylum level taxonomy was summarized by treatment as a barchart with low abundance taxa filtered out (A). Bacterial enumeration using MacConkey agar with the time point before exposure followed by 3 time points, 4 h after exposure for (B), T0 = Day1—0 h, T1 = Day 1—4 h, T2 = Day2—0 h, T3 = Day 2—4 h,*p ≤ 0.05. N = 4.
Unlike with our chronic study, enumeration using MaConkey agar resulted in colony amounts that were within the statistical threshold (30 < CFUs 〈300), which showed that acute TCDD exposure significantly (p = 0.0286) increased CFUs (Fig. 7B). Because Mac agar is both highly selective and differential, these colonies are most likely gram negative, rod-shaped, facultative anaerobes. There were no significant differences in the colony counts using either BHI or MRS plates (data not shown).
4. Discussion
Our findings in STZ-induced hyperglycemic male CD-1 mice following chronic TCDD exposure, e.g., liver pathology, polydipsia (excessive thirst) and polyphagia (increased appetite), are consistent with previous studies (Mandal, 2005) that TCDD contributed to liver damage and caused a wasting-like disease. Although TCDD exposure is known to cause insulin resistance (Alonso-Magdalena et al., 2011), which is a contributory factor in metabolic diseases like diabetes, our results suggested that TCDD slightly decreased blood glucose levels in STZ-treated mice. TCDD was thought to reduce blood glucose in lab animals through an inhibition of gluconeogenesis (Viluksela et al., 1999). This could mimic some aspects of the anti-diabetic drugs such as metformin (Madiraju et al., 2014) and berbine (Jiang et al., 2015), as both have been shown to inhibit gluconeogenesis. However, this seemingly “beneficial” effect on blood glucose level does not negate the toxic profile of TCDD as demonstrated in our histopathological analysis in which severe liver damages were noted.
The gut microbiome has been connected to a wide range of diseases (Clemente et al., 2012, Sharon et al., 2014, Thorburn et al., 2014). Liver diseases, in particular nonalcoholic steatohepatitis (NASH), can be caused largely by dysbiosis within the gut (Madiraju et al., 2014; Boursier and Diehl, 2015). Alcoholic liver diseases also have a substantial microbiome component as germ free mice treated with alcohol had a drastic reduction in liver pathology compared with conventional mice (Canesso et al., 2014). Our results suggested that the TCDD treated mice had a substantial reduction in Bacteroidetes and an increase in Firmicutes. In agreement with our study, the Bac/Firm ratio has been shown to inversely associate with liver pathology (De Minicis et al., 2014). While relatively few studies have examined the role of the microbiome in toxicant-induced liver disease, several reports have shown that toxicant-mediated dysbiosis is an important mechanism. Decrease in Bacteroidetes has been associated with fungicide carbendazim induced hepatotoxicity (Jin et al. 2015). Importantly, patients with NASH also have a lower percentage of Bacteroidetes (Mouzaki et al., 2013), and high-fat diet can cause a decrease in Bacteroidetes and increases in Firmicutes (Hildebrandt et al., 2009). In addition, as in our study, there was a positive association between the Bac/Firm ratio and blood glucose levels in humans (Larsen et al. 2010). Taken together, this suggests the interesting notion that the Bac/Firm ratio underlies a common etiology of certain aspects of metabolic syndrome, mainly liver disease and hyperglycemia regardless of predominating (inherited vs. environmental) factors.
Although the increased relative abundance of Firmicutes and decreased abundance of Bacteroidetes from our acute TCDD treatment study did not reach the level of statistical significance, they are consistent with the general trend that was seen with our chronic TCDD treatment study. Additionally, STZ treatment produced a numerical increase in the relative abundance of Bacteroidetes and a decrease in Firmicutes as compared to non-STZ animals (data not shown), which is in agreement with the findings by Wirth et al. (2014). In a study by Zhang et al. (2015) that examined a TCDD like compound TCDF, it was reported that exposure also perturbed the microbiota composition. However, the taxonomic changes in Zhang et al. (2015) were opposite of our results, e.g., decreased relative abundance of Firmicutes and increased abundance of Bacteroidetes. These discrepancies can be largely attributed to the differences in dosing scheme (high-dose, short-term, vs. low-dose, long-term), strain, chemical differences (Boursier and Diehl, 2015), and subsequent metabolism (Olson et al., 1994). Zhang et al. (2015) treated C57BL/6J mice with 24 μg/kg TCDF in the diet for 5 days. In our study, CD-1 mice were dosed biweekly with a dose of 6 μg TCDD/kg bw for 26 weeks.
It is well documented that exposure to TCDD can induce immune suppression and thymic atrophy (Hao and Whitelaw, 2013), which is also true in our study (Table 1). In addition, there was a positive correlation between the Bac/Firm ratio and blood glucose levels, between Bac/Firm ratio and liver weight, and between Bac/Firm ratio and liver pathology score in our study. In the study by Zhang et al. (2015), no effects on microbiome were seen in AhR KO mice treated with TCDF, and this suggests that toxicants targeting the AhR initiate dysbiosis through an indirect mechanism. In our studies, modulation of gut microbiota, notably increased Mac CFUs, could also be observed with acute TCDD exposure; however, TCDD at 1–1000 nM in vitro had no such effects on bacteria grown on MacConkey agar (data not shown). It is possible that TCDD initially affects the immune cells in the gut, and dysregulation of the immune responses (e.g., decreased CD3+NK+ NKT cells) allows for pathogenic microbes to bloom leading to a death-spiral of dysbiosis and disease (Van Kaer et al., 2015). NKT cells have been implicated in the pathogenesis of several autoimmune diseases including T1D (Grose et al., 2008, Wilson et al., 1998). A significant decrease of NKT (CD3+NK+) cells was found in TCDD-treated mice in our study. In addition, we saw decreases in CD8+ cells including CD8+CD25+ T cells, and significant correlations have been found between various bacterial families and immune parameters in our studies. A member of the family Desulfovibrionaceae in the Proteobacteria phylum was previously associated with the pro inflammatory phenotype seen in metabolic syndrome (Zhang et al., 2010), which was negatively correlated with %CD3+CD24+ splenocytes in our study. Both Prevotellaceae and Rikenellaceae were positively correlated with %CD3+NK+ and %CD8+CD25+ splenocytes (data not shown). Both families have been implicated in obesity and T2D, respectively (Larsen et al. 2010; Zhang et al. 2009). It is possible that the microbiome changes observed in our chronic TCDD studies were not due to the direct modulation of TCDD but resulted from an indirect effect of TCDD, possibly through immunosuppression (Rooks et al., 2014), and systemic immunosuppression induced by TCDD exposure changes the gut microbial community structure to contribute to TCDD toxicity. It would be interesting to explore if TCDD affects T cell differentiation in future studies.
At the species level, TCDD treated mice had a higher abundance of several Lactobacillus species, including L. delbruekii, L. reuteri, Clostridium sp., and unclassified species in the family Peptostreptococcaceae, Enterococcaceae, and unclassified species from the order of Bacilli and Lactobacillales (data not shown). In contrast, TCDD treated animals had decreased abundance of Ruminococcus sp., Prevotello sp., Anaerostipes sp., and unclassified species from the family ACK-M1, the orders YS2, RF39, and two different unclassified species from the order Bacteroidales. Although the significances of these findings are currently unclear, correlation was found between the changes seen in the microbiome species and phenotypic alteration caused from TCDD exposure. For example, Lactobacillus reuteri was negatively correlated with blood glucose levels and thymus weight, while Ruminococcus sp. was positively correlated. Species from the genera Prevotella, Ruminococcus and Anaerostipes were positively correlated with liver weight. Clostridium was negatively correlated with liver pathology score, while Bilophila and Enterobacter were positively correlated.
Patients with nonalcoholic fatty liver disease had significantly increased gut permeability and a higher prevalence of small intestinal bacterial overgrowth (Miele et al., 2009). Surprisingly, despite the increased CFUs in BHI and Mac plates, the intestinal permeability as measured by FITC-Dextran was not increased (data not shown). In fact, TCDD could decrease the permeability to the Caco-2 cell monolayer in vitro (Natsume et al., 2003). Thus, TCDD could potentially have a beneficial effect on permeability because other AhR ligands increase mucus and anti-microbial peptide production by the host (Thorburn et al., 2014). This could also explain the overrepresentation of bacteria from the family Lactobacillaceae and CFUs grown on MRS agar in our study since Lactobacillus is a producer of AhR ligands (Thorburn et al., 2014), suggesting the ultimate effects of AhR activation would favor its growth. The hormone adiponectin produced by adipose tissue regulates lipid and glucose metabolism and acts as a critical peripheral signal to increase insulin sensitivity. Changes in adiponectin have been related to insulin resistance and metabolic syndrome in humans putatively induced by environmental dioxin exposure (Hectors et al., 2013; Kern et al., 2004). However, TCDD exposure did not significantly change the adiponectin level in our study (data not shown). This suggests that adiponectin is not causally related to the wasting syndrome.
In summary, our results demonstrate that modulation of gut microbiota could contribute to toxicity from chronic TCDD exposure. The effects appear to be a dynamic interplay between host and microbes because acute exposure did not dramatically perturb the overall taxonomic composition but did notably increase the cultivable gram-negative facultative anaerobic bacilli grown on MacConkey agar. Since most liver pathologies can be attributed to dysbiosis, the broad correlational analysis between taxa and phenotypic characteristics, while not definitive, certainly implicates the microbiota as causal in TCDD toxicity. This is the first attempt to link TCDD-mediated immune dysfunction to dysbiosis, liver toxicity and prediabetes. Further research to determine if induction of liver toxicity by TCDD resulted from microbiome modulation through immunosuppression is warranted.
Abbreviations
- AhR
aryl hydrocarbon receptor
- Bac/Firm ratio
the phylum level Bacteroidetes to Firmicutes ratio
- BHI
brain-heart Infusion
- LDA
linear discriminant analysis
- LEfSe
linear discriminant analysis effect size
- Mac
MacConkey
- MRS
de Man, Rogosa, and Sharpe
- NOD
non-obese diabetic
- PBS
phosphate buffered saline
- STZ
streptozotocin
- T1D
type 1 diabetes mellitus
- T2D
type 2 diabetes mellitus
- TCDD
2,3,7,8-tetrachlorodibenzo-p-dioxin
- TCDF
2,3,7,8-tetrachlorodibenzofuran
Footnotes
This study was supported in part by R21ES24487 (TL Guo). The authors would like to thank Dr. Steven D. Holladay of the University of Georgia for his critical and editorial review. There are no conflicts of interest to declare.
Conflict of interest
There are no conflicts of interest to declare.
Transparency Document
The Transparency document associated with this article can be found, in online version.
References
- Alonso-Magdalena P, Quesada I, Nadal A. Endocrine disruptors in the etiology of type 2 diabetes mellitus. Nat Rev Endocrinol. 2011;7:346–353. doi: 10.1038/nrendo.2011.56. [DOI] [PubMed] [Google Scholar]
- Anderson MJ. A new method for non-parametric multivariate analysis of variance. Austral Ecol. 2001;26:32–46. [Google Scholar]
- Barbu-Tudoran L, Gavriliuc OI, Paunescu V, Mic FA. Accumulation of tissue macrophages and depletion of resident macrophages in the diabetic thymus in response to hyperglycemia-induced thymocyte apoptosis. J Diabetes Complicat. 2013;27:114–122. doi: 10.1016/j.jdiacomp.2012.10.007. [DOI] [PubMed] [Google Scholar]
- Boursier J, Diehl AM. Implication of gut microbiota in nonalcoholic fatty liver disease. PLoS Pathog. 2015;11:e1004559. doi: 10.1371/journal.ppat.1004559. [DOI] [PMC free article] [PubMed] [Google Scholar]
- Canesso MCC, Lacerda NL, Ferreira CM, Goncalves JL, Almeida D, Gamba C, et al. Comparing the effects of acute alcohol consumption in germ-free and conventional mice: the role of the gut microbiota. BMC Microbiol. 2014;14:240. doi: 10.1186/s12866-014-0240-4. [DOI] [PMC free article] [PubMed] [Google Scholar]
- Clemente JC, Ursell LK, Parfrey LW, Knight R. The impact of the gut microbiota on human health: an integrative view. Cell. 2012;148:1258–1270. doi: 10.1016/j.cell.2012.01.035. [DOI] [PMC free article] [PubMed] [Google Scholar]
- Cranmer M, Louie S, Kennedy RH, Kern PA, Fonseca VA. Exposure to 2,3,7,8-tetrachlorodibenzo–dioxin (tcdd) is associated with hyperinsulinemia and insulin resistance. Toxicol Sci. 2000;56:431–436. doi: 10.1093/toxsci/56.2.431. [DOI] [PubMed] [Google Scholar]
- de La Serre CB, Ellis CL, Lee J, Hartman AL, Rutledge JC, Raybould HE. Propensity to high-fat diet-induced obesity in rats is associated with changes in the gut microbiota and gut inflammation. Am J Physiol Gastrointest Liver Physiol. 2010;299:G440–G448. doi: 10.1152/ajpgi.00098.2010. [DOI] [PMC free article] [PubMed] [Google Scholar]
- De Minicis S, Rychlicki C, Agostinelli L, Saccomanno S, Candelaresi C, Trozzi L, et al. Dysbiosis contributes to fibrogenesis in the course of chronic liver injury in mice. Hepatology (Baltimore, Md) 2014;59:1738–1749. doi: 10.1002/hep.26695. [DOI] [PubMed] [Google Scholar]
- Edgar RC. Search and clustering orders of magnitude faster than blast. Bioinformatics (Oxford, England) 2010;26:2460–2461. doi: 10.1093/bioinformatics/btq461. [DOI] [PubMed] [Google Scholar]
- Frank JA, Reich CI, Sharma S, Weisbaum JS, Wilson BA, Olsen GJ. Critical evaluation of two primers commonly used for amplification of bacterial 16s rrna genes. Appl Environ Microbiol. 2008;74:2461–2470. doi: 10.1128/AEM.02272-07. [DOI] [PMC free article] [PubMed] [Google Scholar]
- Fried KW, Guo GL, Esterly N, Kong B, Rozman KK. 2,3,7,8-Tetrachlorodibenzo-p-dioxin (tcdd) reverses hyperglycemia in a type ii diabetes mellitus rat model by a mechanism unrelated to ppar gamma. Drug Chem Toxicol. 2010;33:261–268. doi: 10.3109/01480540903390026. [DOI] [PubMed] [Google Scholar]
- Gao X, Liu H, He B, Fu Z. Resistance to streptozotocin-induced autoimmune diabetes in absence of complement C3: myeloid-derived suppressor cells play a role. PLoS One. 2013;8:e66334. doi: 10.1371/journal.pone.0066334. [DOI] [PMC free article] [PubMed] [Google Scholar]
- Goodman M, Narayan KM, Flanders D, Chang ET, Adami HO, Boffetta P, et al. Dose-response relationship between serum 2,3,7,8-tetrachlorodibenzo-p-dioxin and diabetes mellitus: a meta-analysis. Am J Epidemiol. 2015;181:374–384. doi: 10.1093/aje/kwu307. [DOI] [PMC free article] [PubMed] [Google Scholar]
- Grose RH, Thompson FM, Cummins AG. Deficiency of 6b11+ invariant nk t-cells in celiac disease. Dig Dis Sci. 2008;53:1846–1851. doi: 10.1007/s10620-007-0093-x. [DOI] [PubMed] [Google Scholar]
- Guo TL, McCay JA, Karrow NA, Brown RD, Musgrove DL, Luebke RW, et al. Immunotoxicity of sodium bromate in female b6c3f1 mice: a 28-day drinking water study. Drug Chem Toxicol. 2001;24:129–149. doi: 10.1081/dct-100102606. [DOI] [PubMed] [Google Scholar]
- Guo TL, Wang Y, Xiong T, Ling X, Zheng J. Genistein modulation of streptozotocin diabetes in male b6c3f1 mice can be induced by diet. Toxicol Appl Pharmacol. 2014;280:455–466. doi: 10.1016/j.taap.2014.08.028. [DOI] [PMC free article] [PubMed] [Google Scholar]
- Hao N, Whitelaw ML. The emerging roles of ahr in physiology and immunity. Biochem Pharmacol. 2013;86:561–570. doi: 10.1016/j.bcp.2013.07.004. [DOI] [PubMed] [Google Scholar]
- Hectors TLM, Vanparys C, van Gaal LF, Jorens PG, Covaci A, Blust R. Insulin resistance and environmental pollutants: experimental evidence and future perspectives. Environ Health Perspect. 2013;121:1273–1281. doi: 10.1289/ehp.1307082. [DOI] [PMC free article] [PubMed] [Google Scholar]
- Henriksen GL, Ketchum NS, Michalek JE, Swaby JA. Serum dioxin and diabetes mellitus in veterans of operation ranch hand. Epidemiology (Cambridge, Mass) 1997;8:252–258. doi: 10.1097/00001648-199705000-00005. [DOI] [PubMed] [Google Scholar]
- Hildebrandt MA, Hoffmann C, Sherrill-Mix SA, Keilbaugh SA, Hamady M, Chen YY, Knight R, Ahima RS, Bushman F, Wu GD. High-fat diet determines the composition of the murine gut microbiome independently of obesity. Gastroenterology. 2009 Nov;137(5):1716–24. e1–2. doi: 10.1053/j.gastro.2009.08.042. [DOI] [PMC free article] [PubMed] [Google Scholar]
- Jiang SJ, Dong H, Li JB, Xu LJ, Zou X, Wang KF, et al. Berberine inhibits hepatic gluconeogenesis via the lkb1-ampk-torc2 signaling pathway in streptozotocin-induced diabetic rats. World J Gastroenterol. 2015;21:7777–7785. doi: 10.3748/wjg.v21.i25.7777. [DOI] [PMC free article] [PubMed] [Google Scholar]
- Jin Y, Zeng Z, Wu Y, Zhang S, Fu Z. Oral exposure of mice to carbendazim induces hepatic lipid metabolism disorder and gut microbiota dysbiosis. Toxicol Sci. 2015;147:116–126. doi: 10.1093/toxsci/kfv115. [DOI] [PubMed] [Google Scholar]
- Kerkvliet NI, Steppan LB, Vorachek W, Oda S, Farrer D, Wong CP, et al. Activation of aryl hydrocarbon receptor by tcdd prevents diabetes in nod mice and increases foxp3+ t cells in pancreatic lymph nodes. Immunotherapy. 2009;1:539–547. doi: 10.2217/imt.09.24. [DOI] [PMC free article] [PubMed] [Google Scholar]
- Kern PA, Said S, Jackson WG, Jr, Michalek JE. Insulin sensitivity following agent orange exposure in Vietnam veterans with high blood levels of 2,3,7,8-tetrachlorodibenzo-p-dioxin. J Clin Endocrinol Metab. 2004 Sep;89(9):4665–4672. doi: 10.1210/jc.2004-0250. [DOI] [PubMed] [Google Scholar]
- Kostic AD, Gevers D, Siljander H, Vatanen T, Hyotylainen T, Hamalainen AM, et al. The dynamics of the human infant gut microbiome in development and in progression toward type 1 diabetes. Cell Host Microbe. 2015;17:260–273. doi: 10.1016/j.chom.2015.01.001. [DOI] [PMC free article] [PubMed] [Google Scholar]
- Kuczynski J, Stombaugh J, Walters WA, Gonzalez A, Caporaso JG, Knight R. Using qiime to analyze 16s rrna gene sequences from microbial communities. Current Protocols in Microbiology Chapter 1. 2012 doi: 10.1002/9780471729259.mc01e05s27. Unit 1E.5. [DOI] [PMC free article] [PubMed] [Google Scholar]
- Larsen N, Vogensen FK, van den Berg FW, Nielsen DS, Andreasen AS, Pedersen BK, et al. Gut microbiota in human adults with type 2 diabetes differs from non-diabetic adults. PLoS One. 2010;5:e9085. doi: 10.1371/journal.pone.0009085. [DOI] [PMC free article] [PubMed] [Google Scholar]
- Lebovitz HE. Type 2 diabetes: an overview. Clin Chem. 1999;45:1339–1345. [PubMed] [Google Scholar]
- Madiraju AK, Erion DM, Rahimi Y, Zhang XM, Braddock DT, Albright RA, et al. Metformin suppresses gluconeogenesis by inhibiting mitochondrial glycerophosphate dehydrogenase. Nature. 2014;510:542–546. doi: 10.1038/nature13270. [DOI] [PMC free article] [PubMed] [Google Scholar]
- Mandal PK. Dioxin: a review of its environmental effects and its aryl hydrocarbon receptor biology. J Comp Physiol B. 2005;175:221–230. doi: 10.1007/s00360-005-0483-3. [DOI] [PubMed] [Google Scholar]
- Markle JG, Frank DN, Mortin-Toth S, Robertson CE, Feazel LM, Rolle-Kampczyk U, et al. Sex differences in the gut microbiome drive hormone-dependent regulation of autoimmunity. Science (New York, NY) 2013;339:1084–1088. doi: 10.1126/science.1233521. [DOI] [PubMed] [Google Scholar]
- Miele L, Valenza V, La Torre G, Montalto M, Cammarota G, Ricci R, Mascianà R, Forgione A, Gabrieli ML, Perotti G, Vecchio FM, Rapaccini G, Gasbarrini G, Day CP, Grieco A. Increased intestinal permeability and tight junction alterations in nonalcoholic fatty liver disease. Hepatology. 2009 Jun;49(6):1877–1887. doi: 10.1002/hep.22848. [DOI] [PubMed] [Google Scholar]
- Mouzaki M, Comelli EM, Arendt BM, Bonengel J, Fung SK, Fischer SE, McGilvray ID, Allard JP. Intestinal microbiota in patients with nonalcoholic fatty liver disease. Hepatology. 2013 Jul;58(1):120–127. doi: 10.1002/hep.26319. [DOI] [PubMed] [Google Scholar]
- Natsume Y, Satsu H, Hatsugai Y, Watanabe H, Sato R, Ashida H. Evaluation of intestinal dioxin permeability using human Caco-2 cell monolayers. Food Sci Technol Res. 2003;9(4):364–366. [Google Scholar]
- Neel BA, Sargis RM. The paradox of progress: environmental disruption of metabolism and the diabetes epidemic. Diabetes. 2011 Jul;60(7):1838–1848. doi: 10.2337/db11-0153. [DOI] [PMC free article] [PubMed] [Google Scholar]
- Okey AB. An aryl hydrocarbon receptor odyssey to the shores of toxicology: the Deichmann lecture, International Congress of Toxicology-XI. Toxicol Sci. 2007 Jul;98(1):5–38. doi: 10.1093/toxsci/kfm096. [DOI] [PubMed] [Google Scholar]
- Olson JR, McGarrigle BP, Gigliotti PJ, Kumar S, McReynolds JH. Hepatic uptake and metabolism of 2,3,7,8-tetrachlorodibenzo-p-dioxin and 2,3,7,8-tetrachlorodibenzofuran. Fundam Appl Toxicol. 1994 May;22(4):631–640. doi: 10.1006/faat.1994.1069. [DOI] [PubMed] [Google Scholar]
- Qin J, Li Y, Cai Z, Li S, Zhu J, Zhang F, et al. A metagenome-wide association study of gut microbiota in type 2 diabetes. Nature. 2012;490:55–60. doi: 10.1038/nature11450. [DOI] [PubMed] [Google Scholar]
- Ramos-Rodriguez JJ, Ortiz O, Jimenez-Palomares M, Kay KR, Berrocoso E, Murillo-Carretero MI, Perdomo G, Spires-Jones T, Cozar-Castellano I, Lechuga-Sancho AM, Garcia-Alloza M. Differential central pathology and cognitive impairment in pre-diabetic and diabetic mice. Psychoneuroendocrinology. 2013;38:2462–2475. doi: 10.1016/j.psyneuen.2013.05.010. [DOI] [PubMed] [Google Scholar]
- Rohland N, Reich D. Cost-effective, high-throughput DNA sequencing libraries for multiplexed target capture. Genome Res. 2012;22:939–946. doi: 10.1101/gr.128124.111. [DOI] [PMC free article] [PubMed] [Google Scholar]
- Rooks MG, Veiga P, Wardwell-Scott LH, Tickle T, Segata N, Michaud M, Gallini CA, Beal C, van Hylckama-Vlieg JE, Ballal SA, Morgan XC, Glickman JN, Gevers D, Huttenhower C, Garrett WS. Gut microbiome composition and function in experimental colitis during active disease and treatment-induced remission. ISME J. 2014 Jul;8(7):1403–1417. doi: 10.1038/ismej.2014.3. [DOI] [PMC free article] [PubMed] [Google Scholar]
- Segata N, Izard J, Waldron L, Gevers D, Miropolsky L, Garrett WS, et al. Metagenomic biomarker discovery and explanation. Genome Biol. 2011;12:R60. doi: 10.1186/gb-2011-12-6-r60. [DOI] [PMC free article] [PubMed] [Google Scholar]
- Shan Q, Huang F, Wang J, Du Y. Effects of co-exposure to 2,3,7,8-tetrachlorodibenzo-p-dioxin and polychlorinated biphenyls on nonalcoholic fatty liver disease in mice. Environ Toxicol. 2014 doi: 10.1002/tox.22006. [DOI] [PubMed] [Google Scholar]
- Sharon G, Garg N, Debelius J, Knight R, Dorrestein PC, Mazmanian SK. Specialized metabolites from the microbiome in health and disease. Cell Metab. 2014;20:719–730. doi: 10.1016/j.cmet.2014.10.016. [DOI] [PMC free article] [PubMed] [Google Scholar]
- Thorburn AN, Macia L, Mackay CR. Diet, metabolites, and “western-lifestyle” inflammatory diseases. Immunity. 2014;40:833–842. doi: 10.1016/j.immuni.2014.05.014. [DOI] [PubMed] [Google Scholar]
- Turnbaugh PJ, Ley RE, Mahowald MA, Magrini V, Mardis ER, Gordon JI. An obesity-associated gut microbiome with increased capacity for energy harvest. Nature. 2006 Dec 21;444(7122):1027–1031. doi: 10.1038/nature05414. [DOI] [PubMed] [Google Scholar]
- Van Kaer L, Parekh VV, Wu L. The response of CD1d-restricted invariant NKT cells to microbial pathogens and their products. Front Immunol. 2015 May 13;6:226. doi: 10.3389/fimmu.2015.00226. [DOI] [PMC free article] [PubMed] [Google Scholar]
- Viluksela M, Unkila M, Pohjanvirta R, Tuomisto JT, Stahl BU, Rozman KK, et al. Effects of 2,3,7,8-tetrachlorodibenzo-p-dioxin (tcdd) on liver phosphoenolpyruvate carboxykinase (pepck) activity, glucose homeostasis and plasma amino acid concentrations in the most tcdd-susceptible and the most tcdd-resistant rat strains. Arch Toxicol. 1999;73:323–336. doi: 10.1007/s002040050626. [DOI] [PubMed] [Google Scholar]
- Warner M, Mocarelli P, Brambilla P, Wesselink A, Samuels S, Signorini S, et al. Diabetes, metabolic syndrome, and obesity in relation to serum dioxin concentrations: the seveso women’s health study. Environ Health Perspect. 2013;121:906–911. doi: 10.1289/ehp.1206113. [DOI] [PMC free article] [PubMed] [Google Scholar]
- Wilson SB, Kent SC, Patton KT, Orban T, Jackson RA, Exley M, et al. Extreme th1 bias of invariant valpha24jalphaq t cells in type 1 diabetes. Nature. 1998;391:177–181. doi: 10.1038/34419. [DOI] [PubMed] [Google Scholar]
- Wirth R, Bódi N, Maróti G, Bagyánszki M, Talapka P, Fekete É, Bagi Z, Kovács KL. Regionally distinct alterations in the composition of the gut microbiota in rats with streptozotocin-induced diabetes. PLoS One. 2014 Dec 3;9(12):e110440. doi: 10.1371/journal.pone.0110440. [DOI] [PMC free article] [PubMed] [Google Scholar]
- Yaochite JN, Caliari-Oliveira C, Davanso MR, Carlos D, Malmegrim KC, Cardoso CR, Ramalho LN, Palma PV, da Silva JS, Cunha FQ, Covas DT, Voltarelli JC. Dynamic changes of the Th17/Tc17 and regulatory T cell populations interfere in the experimental autoimmune diabetes pathogenesis. Immunobiology. 2013;218:338–352. doi: 10.1016/j.imbio.2012.05.010. [DOI] [PubMed] [Google Scholar]
- Zhang H, DiBaise JK, Zuccolo A, Kudrna D, Braidotti M, Yu Y, et al. Human gut microbiota in obesity and after gastric bypass. Proc Natl Acad Sci U S A. 2009;106:2365–2370. doi: 10.1073/pnas.0812600106. [DOI] [PMC free article] [PubMed] [Google Scholar]
- Zhang W, Moorthy B, Chen M, Muthiah K, Coffee R, Purchio AF, West DB. A Cyp1a2-luciferase transgenic CD-1 mouse model: responses to aryl hydrocarbons similar to the humanized AhR mice. Toxicol Sci. 2004 Nov;82(1):297–307. doi: 10.1093/toxsci/kfh260. [DOI] [PubMed] [Google Scholar]
- Zhang L, Nichols RG, Correll J, Murray IA, Tanaka N, Smith PB, et al. Persistent organic pollutants modify gut microbiota-host metabolic homeostasis in mice through aryl hydrocarbon receptor activation. Environ Health Perspect. 2015;123:679–688. doi: 10.1289/ehp.1409055. [DOI] [PMC free article] [PubMed] [Google Scholar]
- Zhang C, Zhang M, Wang S, Han R, Cao Y, Hua W, et al. Interactions between gut microbiota, host genetics and diet relevant to development of metabolic syndromes in mice. ISME J. 2010;4:232–241. doi: 10.1038/ismej.2009.112. [DOI] [PubMed] [Google Scholar]
- Zheng JF, Guo TL. HDDM, a formula consisting of seven herbs, had anti-diabetic but no immunomodulatory activities in multiple low doses of streptozotocin-treated female of B6C3F1 mice. Orient Pharm Exp Med. 2009;9:20–38. [Google Scholar]