Abstract
Objectives
To reduce unnecessary lab testing by predicting when a proposed future lab test is likely to contribute information gain and thereby influence clinical management in patients with gastrointestinal bleeding. Recent studies have demonstrated that frequent laboratory testing does not necessarily relate to better outcomes.
Design
Data preprocessing, feature selection, and classification were performed and an artificial intelligence tool, fuzzy modeling, was used to identify lab tests that do not contribute an information gain. There were 11 input variables in total. Ten of these were derived from bedside monitor trends heart rate, oxygen saturation, respiratory rate, temperature, blood pressure, and urine collections, as well as infusion products and transfusions. The final input variable was a previous value from one of the eight lab tests being predicted: calcium, PTT, hematocrit, fibrinogen, lactate, platelets, INR and hemoglobin. The outcome for each test was a binary framework defining whether a test result contributed information gain or not.
Patients
Predictive modeling was applied to recognize unnecessary lab tests in a real world ICU database extract comprising 746 patients with gastrointestinal bleeding.
Main results
Classification accuracy of necessary and unnecessary lab tests of greater than 80% was achieved for all eight lab tests. Sensitivity and specificity were satisfactory for all the outcomes. An average reduction of 50% of the lab tests was obtained. This is an improvement from previously reported similar studies with average performance 37% by [1–3].
Conclusions
Reducing frequent lab testing and the potential clinical and financial implications are an important issue in intensive care. In this work we present an artificial intelligence method to predict the benefit of proposed future laboratory tests. Using ICU data from 746 patients with gastrointestinal bleeding, and eleven measurements, we demonstrate high accuracy in predicting the likely information to be gained from proposed future lab testing for eight common GI related lab tests. Future work will explore applications of this approach to a range of underlying medical conditions and laboratory tests.
Keywords: Phlebotomy, Harm reduction, Blood transfusions, Non-linear models, Predictive value of tests, False positive reactions
1. State of the art
Laboratory testing occurs frequently in hospitalized patients [4]. This is especially so for patients in intensive care, where frequent blood draws are associated with general phlebotomy complications [1,5]. While part of this testing reflects changes in the intrinsic critical status of ICU patients, other tests are run by default, following general guidelines and not driven by patient-specific clinical questions [6,7]. Excessive use of laboratory blood tests increases resource utilization, contributes to blood loss, and may lead to incorrect diagnosis and treatment. In addition, laboratory tests in the ICU are sometimes obtained without a physician order, which hinders proper documentation [1]. However, modifying test-ordering practices in the ICU is challenging, mainly because of the pre-assumption that critical patients take a benefit from frequent testing, the ease of blood drawing from indwelling arterial and central venous catheters, and the difficulty of implementing durable changes of practice in a multidisciplinary environment such as the ICU.
Studies [8] and [9] have shown that general ward admissions average 1.1 draws per day per patient, extracting 12.4 ml of blood per day, resulting in 175 ml of blood drawn per hospitalization. These numbers are increased for an average ICU admission where there are 3.4 draws per day per patient, and 762.2 ml for the entire admission, and even more for ICU patients with an arterial line inserted, where there are 4.0 draws per day per patient, and 944 ml during the whole admission. Depending on the patient’s condition and the underlying reasons for admission, the cumulative amount of blood drawn for laboratory testing purposes might warrant transfusion replacement, an expensive and risky practice in itself.
Among the reasons for over-testing, one may find that many tests are ordered as part of a panel. Many factors contribute to this practice, including lack of awareness of the consequences of over-testing, arising from the medical culture promoting “more visible” care, the medico-legal environment and financial incentives arising from a fee-for-service reimbursement scheme [10]. Previous studies have shown that a significant percentage of the tests requested are medically unnecessary [11].
New guidelines for laboratory testing in surgical ICU patients have been defined to enhance the decision-making process for a test requirement, limit unnecessary testing and provide appropriate documentation of physician orders. In [1] it was concluded that decreasing the number of tests is not associated with additional morbidity, and decreasing the number of tests may decrease blood transfusions. Overall, in [1] it was found that the number of laboratory tests performed decreased by 37%. The reduction in the number of specific laboratory tests targeted by the guidelines paralleled the overall results. Blood glucose, arterial blood gas, chemistry, coagulation tests, and cardiac enzymes decreased by 51.4, 43.9, 37.6, 30.5, and 23.2%, respectively. The most important finding of [1] is that the introduction of new laboratory testing guidelines in a surgical ICU resulted in a significant decrease of the number of tests performed, and a significant increase in the number of tests obtained with a proper physician order. These results, sustained over time, were associated with no detectable morbidity, and may have resulted in a decrease of red blood cell transfusions. Other research works about unnecessary lab tests reduction have obtained similar results [2,3].
In related research [12], hematological monitoring data were interpolated by cubic spline and the interpolated data were estimated from their correlation with actual data by way of a leave-one-out cross validation (LOOCV). Furthermore, an attractor plot was applied as time series analysis in order to clarify the tendency of the interpolated hematological monitoring data. The hematological data of three patients who had received S-1 (a drug that is being studied for its ability to enhance the effectiveness of fluorouracil and prevent gastrointestinal side effects caused by fluorouracil when treating cancer) administration over 2 years period were investigated. White blood cell (WBC) count, red blood cell (RBC) count, hemoglobin (Hgb), hematocrit (Hct), mean corpuscular hemoglobin (MCH), mean corpuscular hemoglobin concentration (MCHC), platelets, coefficient of variation of the red blood cell distribution width (RDW-CV), platelet distribution width (PDW) and mean platelet volume (MPV) were interpolated by cubic spline. Those lab tests with small variances, such as RBC, were well predicted by this method. However, tests with higher variances, such as WBC, MCHC, PLT, and PDW were poorly predicted. Cubic spline was the best approach of various interpolation methods in this study. The importance of [12] relies in the fact that it is possible to predict future values of lab tests even using very rudimentary models.
A further laboratory risk is false positives associated with over-testing [13,14]. The probability of false positives (lab results out of the normal range, when in fact the real values are normal) is dependent on many things including laboratory equipment, employee training and correct phlebotomy technique. However, the incidence of false positives increases with the number of tests run [13]. For example, if a given lab test randomly misclassifies people as diseased at a 1% rate (i.e. the test is 99% accurate), then the probability of having a false positive in the healthy population after an arbitrary 50 lab tests is
| (1) |
where n is the number of lab tests, Pw(n) is the probability of obtaining one wrong result (in this case, a false positive) in n lab tests and Pr(n) is the probability of obtaining inaccurate result in a given lab test. One strategy to reduce this increasing probability of obtaining false positives is to avoid testing when no additional information is expected or, in other words, to reduce n.
2. Objectives
The objective of this paper is to propose a strategy to reduce unnecessary lab testing in the ICU. This is a retrospective study using data acquired from intensive care unit (ICU) patients. In this paper, we consider a specific group of patients at the ICU, gastrointestinal bleeding patients (GI bleeds). Although there might be different criteria for testing that evaluates the evolution of patients with GI hemorrhage, domain experts defined eight specific lab tests that are important to assess the response to delivered care: hematocrit (Hct), hemoglobin (Hgb), platelets, calcium, lactate, partial prothrombin time (PTT), international normalized ratio (INR) for blood clotting, and fibrinogen.
For those 8 lab tests, we analyze which of them provide a gain of information. A series of thresholds for normal ranges are defined for each lab (see Section 3.5), and a given test is considered to provide an information gain if its value goes beyond the defined thresholds, and considered not a gain of information otherwise. We hypothesize that by using artificial intelligence we would be able to find information in other variables that could tell us if a test would provide a gain of information or not. In this paper, the method proposed for the eight lab tests is explained in Section 3.5.
In this paper, we use the fuzzy modeling approach proposed by Takagi and Sugeno (TS), with rules If–Then rules that represents local input-output relations of a nonlinear system [15,16]. In application domains that involve a large amount of data with uncertainty, such as medicine or business, TS fuzzy models can serve as a useful tool for generating fuzzy rules or discovery knowledge in database, since almost all nonlinear dynamical systems can be represented by TS fuzzy models to a high degree of precision [17,18]. We choose TS models because of their ability to express the local dynamics of each fuzzy implication (rule) by a linear system model. The overall fuzzy model of the system is achieved by fuzzy “blending” of the linear system models. This means that a nonlinear problem can be solved by individual linear rules that are then combined in a nonlinear fashion. Since TS models perform well both with linear and nonlinear classifications/predictions resulting in transparent rules (see Section 3.8), we preferred them over decision trees, bayesian and neural networks [19–21].
3. Methods
3.1. Dataset
In this study, an ICU database named MIMIC II was used. MIMIC II is a publicly available database. However, the authors further received IRB exemption from Beth Israel Deaconess Medical Center (BIDMC) IRB board in June 2010, in Boston, MA, USA. MIMIC II was created as part of a Bioengineering Research Partnership (BRP) grant from the National Institute of Biomedical Imaging and Bioengineering entitled Integrating Data, Models and Reasoning in Intensive Care (RO1-EB001659). MIMIC II has been collected since 2001 at BIDMC including high frequency sampled data of bedside monitors, clinical data (laboratory tests, physicians’ and nurses’ notes, imaging reports, medications and billing codes like ICD9, DRG and CPT) and demographic data [22]. All data were appropriately de-identified [23]. As this is being written, MIMIC II continues to evolve with new versions being posted on the PhysioNet web site (http://www.physionet.org/). The version 2.6, used in this work, contains a total of 40,426 patients.
3.2. Modeling inputs
Table 1 shows the characteristics of the subset of variables used as information sources for modeling in this work. Five bedside monitor trends (heart rate, respiratory rate, O2 saturation, temperature and arterial blood pressure) as well as urine output collections, intravenous infusions volumes and packed red blood cells, fresh frozen plasma and platelets transfusions were used as inputs for the predictive models. Transfusions of packed red blood cells, packed platelets and fresh frozen plasma, were added as inputs as their effect on lab results is clinically important.
Table 1.
Characteristics of the variables used as inputs for the models.
| Input variables | Mean ± S.D. | Units |
|---|---|---|
| Heart rate | 86.58± 17.83 | [beats/min] |
| Oxygen saturation (SpO2) | 97.33 ± 4.40 | [%] |
| Respiratory rate | 19.85 ± 6.14 | [breaths/min] |
| Temperature | 97.97 ± 4.05 | [F] |
| Arterial blood pressure | 113.08 ± 28.70 | [mm Hg] |
| Intravenous infusions | 944.87 ± 1165 | [ml] |
| Packed red blood cell transfusions | 61.14 ± 174.80 | [ml] |
| Packed fresh frozen plasma transfusions | 23.91 ± 96.86 | [ml] |
| Platelets transfusions | 11.24 ± 60.17 | [ml] |
| Urine output | 0.02± 0.06 | [cm3/min] |
3.3. Modeling outputs
Hematocrit, hemoglobin, partial prothrombin time (PTT), fibrinogen, lactate, platelets, INR and calcium are the variables routinely tested among GI bleeds, and were considered as the outcomes to predict in this work. We note that these eight lab tests are components to three panels of laboratory tests, and that the three panels sum up to more than 30 individual tests, only a few of which are therefore relevant to this subset of patients [24]. Characteristics of the eight lab tests are shown in Table 2.
Table 2.
Characteristics of lab tests considered as outcomes for modeling purposes.
| Outcomes | Mean ± S.D. | Units | Mean tests per patient per admission (max–min) |
|---|---|---|---|
| Calcium | 8.30± 0.89 | [mg/dl] in serum or plasma | 9.42 (1–134) |
| PTT | 45.69 ± 25.07 | Partial thromboplastin time [s] | 9.55 (1–131) |
| INR | 1.70 ± 0.93 | ratio of sample’s PTT to normal PT | 13.22 (1–130) |
| Hematocrit | 29.55 ± 4.09 | [% volume fraction] of blood (%) | 14.75 (1–186) |
| Hemoglobin | 10.07 ± 1.46 | [mg/dl] in blood | 9.53 (1–124) |
| Fibrinogen | 272.20 ± 149.43 | [mg/dl] in platelet poor plasma | 2.47 (1–64) |
| Lactate | 3.29 ± 3.33 | [mol/ml] in blood | 4.81 (1–126) |
| Platelets | 178.33 ± 143.52 | [#/ml] in blood | 10.37 (1–141) |
3.4. Subset for modeling
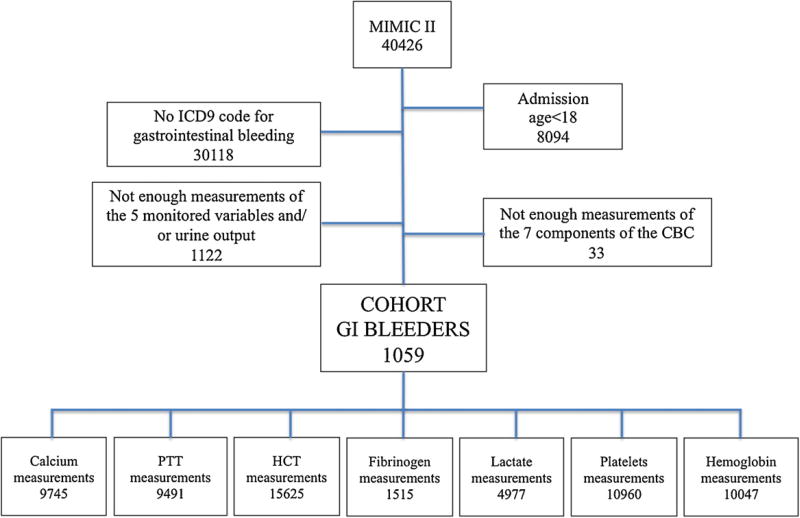
After defining the inputs and outputs required for modeling, the target subset of patients was selected using the following inclusion criteria:
patients 18 years or older;
patients with ICD9 codes related to gastrointestinal bleeding (15);
patients with at least one measurement for each of the 5 bedside monitor trends;
patients with more than one measurement of at least one of the lab tests proposed as outcomes.
The flow chart of patients’ inclusion criteria used to define the subset of patients considered is depicted in Fig. 1.
Fig. 1.
Flow chart of patients’ inclusion criteria used to define the subset of patients considered in this work, using MIMIC II database.
3.5. Modeling strategy
We utilized expert intensivists’ opinion to define the outcome framework. This framework is binary and dichotomizes lab results into information gain or no information gain categories. This is not the same as routine reference ranges reported on lab reports as normal or abnormal, as a falling hematocrit still bounded within normal range is an important information gain for GI bleeding patients. The outcome framework is as follows:
Gain of information (positive cases) when there is a drop d in the value of the lab test, or when those values are under or over certain critical lower or upper thresholds, TL and TU (this last when applicable), respectively (Table 3).
No gain of information (negative cases) viz: as per the above, if the variations were below the previously defined thresholds and drops.
Table 3.
Thresholds used for the definition of gain/no gain of information for each lab test and resulting number of tests considered relevant.
| Outcome variable | TL | TU | d | Number of relevant tests (% of total tests) |
|---|---|---|---|---|
| Calcium | 8.4 | 10.2 | 0.5 | 5724 (58.74) |
| PTT | 18 | 35 | 2 | 5425 (57.16) |
| INR | – | 1.5 | 0.2 | 3830 (43.27) |
| Hematocrit | 35 | 50 | 3 | 8745 (55.97) |
| Hemoglobin | 12 | 18 | 1 | 4809 (47.87) |
| Fibrinogen | 150 | – | 10 | 245 (16.17) |
| Lactate | 0 | 2 | 0.2 | 2550 (51.24) |
| Platelets | 150 | – | 10 | 5872 (53.58) |
The values of d, TL and TU (Table 3) used in this work correspond to conventional limits defined for normality in clinical practice [25].
Gain of information was defined as a subset of lab results that require clinical action. This means that, according to general guidelines [25], specific actions have to be taken, or the values are relevant enough to keep a close eye on the patient’s evolution. The series of thresholds for normal ranges defined for each lab (see Section 3) are used in this work in such a way that a given test is considered to provide an information gain if its value goes beyond the defined thresholds, and considered not a gain of information otherwise.
3.6. Workflow for lab test ordering decision-making
We simulated two different approaches for ordering lab tests. In the first process, clinicians collate the immediate previous lab value with other data, to decide if new lab tests are needed. Fig. 2a shows this approach, which we term online.
Fig. 2.
Schematic representation of the input/output configurations used for the modeling of each lab test: (a) online and (b) morning configurations.
In the second, clinicians collate the first lab value of the morning with other clinical data to decide if new lab tests are needed. Fig. 2b shows this approach which we term morning.
Finally, we predicted the 8 outcomes through the last two approaches only using data during periods in which the patient was receiving transfusions. This was done mainly under the suspicion that actively bleeding patients would not present drops in their lab values when transfused (their values would probably remain constant), but they should be considered relevant because of the patient’s condition.
3.7. Knowledge discovery process
Knowledge Discovery in Databases (KDD) is an interactive and iterative process [26–28], involving numerous steps, which aims to discover hidden patterns and/or useful information in large datasets that do not express those patterns easily. The main role of the KDD process in this work is to predict the relevancy of a set of lab tests for gastrointestinal bleeding ICU patients, based on existing data specific to the patient. The relevancy of a given test is assessed in terms of the information it would add, that could change management.
The preprocessing applied to the raw dataset consisted of correcting misalignments and missing data, and selecting the most predictive variables.
According to [29], misalignments can be corrected using one variable in the dataset as a template, and shifting the data points of other variables to align sampling times. In this work, each lab test was used as the template to unshift the values of all the other variables, as it defines the points for which predictions are required. Although [29] proposes to use the variable with the highest sampling rate (in this dataset it corresponds to heart rate, with a mean sampling time of 0.76 h), in this work it would create an excessive amount of points for which the lab tests are not expected to be measured (lab tests have an average sampling time of 10.34 h). As proposed in [14], all the existing entries are shifted to the closest template alignment location, and values are then obtained through an interpolation strategy using the template variable as a time reference. The values for the new sampling times were obtained through cubic interpolation, as suggested by [29]. Missing data were classified and imputed according to the strategy suggested in [29].
In data modeling, a usual practice is to use independent randomly selected subsets of data to train, test and validate the models [30]. In this way, the results obtained through validation can be considered as the performance of the obtained models in real new data. In this work, the dataset was first randomly divided into two equal parts, one for the feature selection process (FS dataset) and the other for the model selection (MS dataset). This was done to select the relevant features and to assess the model’s performances over independent datasets.
The subsets of features were defined over the FS dataset by randomly selecting the train (60%), test (30%) and validation (10%) sets from the FS dataset; the subset of features resulting in the highest accuracy for the validation set was selected.
Data reduction involves finding those variables with useful information to model and predict the pursued outcome. A forward selection process was use in this work to reduce data dimensionality and to find the predictive variables [31].
A leave-one-out cross-validation (LOOCV) process was used to select the best model, by using a subset 10% of the MS dataset, defined as the validation set, and the remaining 90% as the training set [30]. The performance criterion used in this work to select the best model was the area under the ROC curve (AUC), as used by [31].
3.8. Fuzzy modeling
The prediction task proposed in this paper was performed using fuzzy modeling, due to the nonlinear nature of much medical physiology, and many studies demonstrating good suitability and performance with databases [32–36]. An additional motivation for using fuzzy modeling is the easily understandable rules that are generated after classifying data, which is useful for medical interpretation and guidelines creation.
Fuzzy modeling is a tool that allows an approximation of non-linear systems when there is little or no previous knowledge of the system to be modeled. A detailed description of fuzzy logic and modeling can be found in [36]. Briefly, fuzzy models use rules and logical connectives to establish relations between the features defined to derive the model. A fuzzy classifier contains a rule base consisting of a set of fuzzy if-then rules together with a fuzzy inference mechanism.
Since the relations between the input variables can have a non linear nature, fuzzy systems were used in this work to binary classify gain/no-gain of information for each lab test as follows: by using variable Y as the lab test for which the information gain is to be assessed, and variables X as inputs in a fuzzy model, X go through a forward selection of features [37,31] to obtain the subset of X that better classifies Y. To avoid magnitude effects in the classification process [38], variable(s) X were normalized as follows:
| (2) |
where Xnorm is the normalized version of X, while Xmin and Xmax represent the minimum and maximum values of X, respectively. The minimum–maximum normalization method is commonly used in engineering applications to normalize the data due to its linear transforming form [38]. Additionally, Y was normalized by setting the lab tests with information gain to 1, and those with no gain to 0.
In this work, Takagi–Sugeno (TS) fuzzy models were used [15], which consist of fuzzy rules where each rule describes a local input–output relation. We used TS fuzzy models due to their general acceptance, simplicity and availability of software tools to perform it. When TS fuzzy systems are used, each discriminant function consists of rules of the type
| (3) |
where x1, …, xM are the values of each feature of the vector Xnorm, and is the consequent function for rule . In these rules, the index c indicates that the rule is associated with the output class c. Therefore, the output of each discriminant function dc(Xnorm) can be interpreted as a score (or evidence) for the associated class c given the input feature vector. The degree of activation of the ith rule for class c is given by:
| (4) |
where . The discriminant output for each class c, with c = 1, …, C, is computed by aggregating the individual rules contribution:
| (5) |
The classifier assigns the class label corresponding to the maximum value of the discriminant functions, i.e.
| (6) |
When the fuzzy model classifies Y as 1, the corresponding lab test is considered to provide an information gain. On the other hand, if Y is classified as 0, that lab test is considered to not provide an information gain and thus, it should not be done in real practice.
A multi-criteria optimization process was used in this paper in order to simultaneously maximize the sensitivity, specificity and accuracy of the models [39–41]. Through this approach, individual weights can be assigned to each criterion during the creation of the models. In this work, more weight was assigned to the sensitivity of the models, since the medical and economical impact of misclassifying a test that should be done is higher than just doing a test that can be avoided. This multi-criteria approach allows the maximization of sensitivity, without neglecting the specificity and accuracy of the models.
Summarizing, a fuzzy system is the modeling algorithm we used to determine if a lab test would provide an information gain or not. In the positive case, the test should be carried out in clinical practice; in the negative case it should not be done.
In this paper, the fuzzy models were created using the Fuzzy Toolbox®, a component of the MATLAB® suite, using Genfis3. The code with the specific details can be requested to the author by email.
4. Results
4.1. Resulting subset
In this work, we selected a specific subset of patients presenting hemorrhage in any part of their gastrointestinal tract (GI bleeds). This selection was done because of the impact of lab results in the therapeutic decision-making process among these patients, the frequency of testing that is higher than for other common underlying medical conditions, and because these patients show significant variations in the lab results during their ICU stay. Although these variations can be challenging from the predictive modeling point of view, they become a good test bench under the assumption that if models do well in predicting highly variable tests, they would do even better with tests that remain pretty much constant during the whole admission. The resulting subset consisted of 746 GI bleeds.
4.2. Prediction results
Prediction results classifying information gain or no information gain for the online configuration can be seen in Table 4. The accuracy of classifications is greater than 80% for all lab tests. The values of sensitivity and specificity also have high accuracy.
Table 4.
Prediction results for the online configuration. AUC: area under the receiving-operator curve – sensitivity: rate of correctly classified tests with gain of information – specificity: rate of correctly classified tests with no gain of information.
| Lab test | Accuracy (%) ± S.D. | AUC ± S.D. | Sensitivity ± S.D. | Specificity ± S.D. |
|---|---|---|---|---|
| Calcium | 85.4± 2.3 | 0.85± 0.01 | 0.88± 0.03 | 0.81 ± 0.1 |
| PTT | 86.1 ± 1.2 | 0.86 ± 0.03 | 0.89 ± 0.01 | 0.82 ± 0.2 |
| INR | 90.7 ± 2.1 | 0.90 ± 0.01 | 0.91 ± 0.01 | 0.89 ± 0.01 |
| Hematocrit | 81.7 ± 1.6 | 0.81 ± 0.05 | 0.84 ± 0.02 | 0.78 ± 0.1 |
| Hemoglobin | 83.6 ± 3.1 | 0.82 ± 0.02 | 0.85 ± 0.03 | 0.81 ± 0.2 |
| Fibrinogen | 84.3 ± 2.8 | 0.84 ± 0.01 | 0.87 ± 0.03 | 0.80 ± 0.4 |
| Lactate | 80.3 ± 2.2 | 0.82 ± 0.01 | 0.82 ± 0.02 | 0.77 ± 0.4 |
| Platelets | 88.1 ± 1.3 | 0.87 ± 0.01 | 0.90 ± 0.01 | 0.85 ± 0.2 |
Results for the morning configuration are detailed in Table 5. Accuracy is greater than 80% for all labs. Sensitivity and specificity also have high accuracy.
Table 5.
Prediction results for the morning configuration.
| Lab test | Accuracy (%) ± S.D. | AUC ± S.D. | Sensitivity ± S.D. | Specificity ± S.D. |
|---|---|---|---|---|
| Calcium | 87.4 ± 1.1 | 0.86 ± 0.02 | 0.90 ± 0.01 | 0.81 ± 0.03 |
| PTT | 87.1 ± 1.5 | 0.88 ± 0.01 | 0.90 ± 0.02 | 0.85 ± 0.01 |
| INR | 92.1 ± 1.8 | 0.92 ± 0.02 | 0.93 ± 0.02 | 0.91 ± 0.01 |
| Hematocrit | 83.7± 2.7 | 0.82 ± 0.00 | 0.84 ± 0.04 | 0.79 ± 0.03 |
| Hemoglobin | 86.6 ± 2.8 | 0.86 ± 0.01 | 0.87 ± 0.02 | 0.84 ± 0.00 |
| Fibrinogen | 86.3 ± 3.3 | 0.84 ± 0.03 | 0.89 ± 0.01 | 0.80 ± 0.01 |
| Lactate | 82.3 ± 1.1 | 0.81 ± 0.01 | 0.83 ± 0.02 | 0.79 ± 0.03 |
| Platelets | 90.1 ± 1.9 | 0.90 ± 0.00 | 0.92 ± 0.01 | 0.88 ± 0.01 |
In Tables 4 and 5 it can be seen that the morning configuration results in a generally higher performance range of classification metrics.
Results for patients actively bleeding, using only data during transfusion periods, were comparable to those shown in Tables 4 and 5, and thus not shown in detail in this work.
4.3. Reduction of unnecessary lab testing
The models proposed in this paper predicted which lab tests provide a gain of information based on the definition of meaningful thresholds for each lab. Those tests predicted as not providing an information gain are the ones that in clinical practice could be reduced, i.e. there would no need to draw blood and run those test. In Table 6 the details of the reduction results are presented for the morning approach. In the last row of Table 6 it is possible to see that the average reduction obtained using this approach reaches a 50% of the total amount of lab tests.
Table 6.
Lab test reduction results for the morning configuration.
| Lab test | Original number of tests | Tests providing information gain |
Percentual reduction | Percentual false negatives |
|---|---|---|---|---|
| Calcium | 9745 | 5724 | 58.74% | 10% |
| PTT | 9491 | 5425 | 57.16% | 10% |
| INR | 8851 | 4981 | 56.28% | 7% |
| Hematocrit | 15,625 | 8745 | 55.97% | 16% |
| Hemoglobin | 10,047 | 4809 | 47.87% | 13% |
| Fibrinogen | 1515 | 245 | 16.17% | 11% |
| Lactate | 4977 | 2550 | 51.24% | 17% |
| Platelets | 10,960 | 5872 | 53.58% | 8% |
| Average | 8901.37 | 4793.875 | 49.62% | 11.5% |
The last column in the same table shows the percentage of the tests incorrectly recognized by the model as not providing an information gain (false negatives). These results mean that, in average, 11.5% of the tests that would not be done following this approach, are in fact important and should be done, i.e. the costly error of the model in terms of health care delivery and decision-making.
Results for the online approach, not shown in this paper, demonstrated a similar reduction performance.
4.4. Specific results of fuzzy modeling
Fuzzy models were chosen as the modeling tool for this work. Fuzzy models have the ability to tackle non-linear relations between variables, and to provide linguistic interpretation of inputs and outputs. Non-linear data relationships and linguistic interpretation is well suited to clinical scenarios [36] (see Section 3). The linguistic interpretation especially comes from the rules that fuzzy models generate in the form of “if-then” statements, obtained from the combination of membership functions created for each input and output [16]. The if part is known as the antecedent, while the then part is known as the consequent.
Clinical experts reviewed all the rules generated by the model and considered the rules valid.
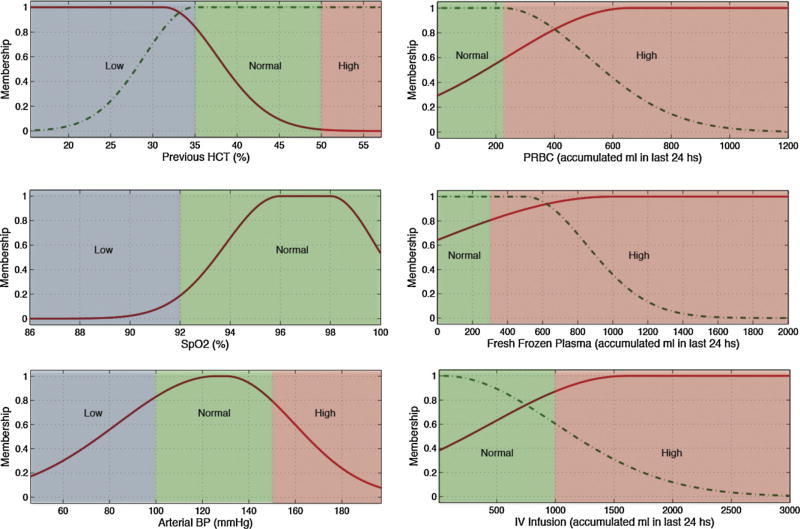
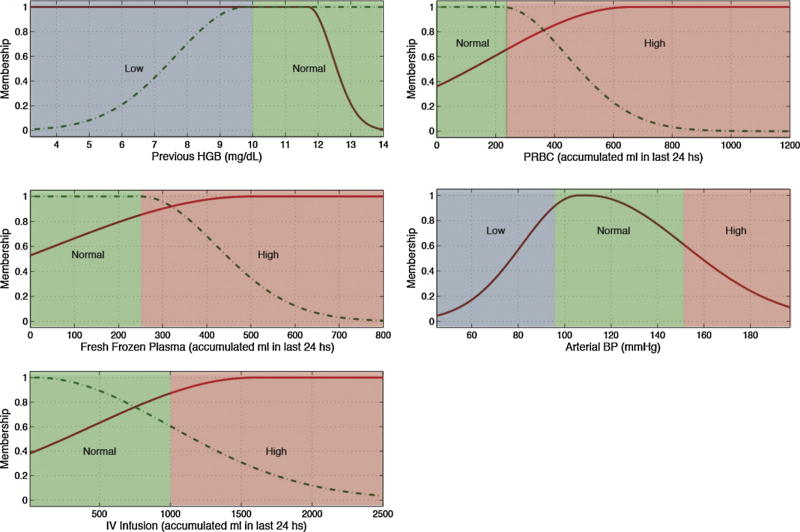
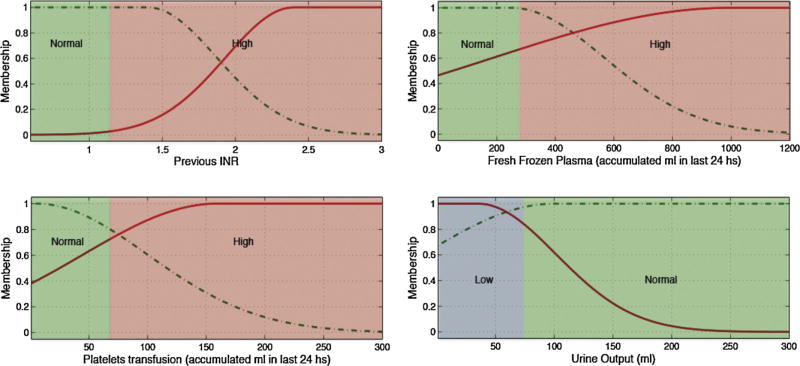
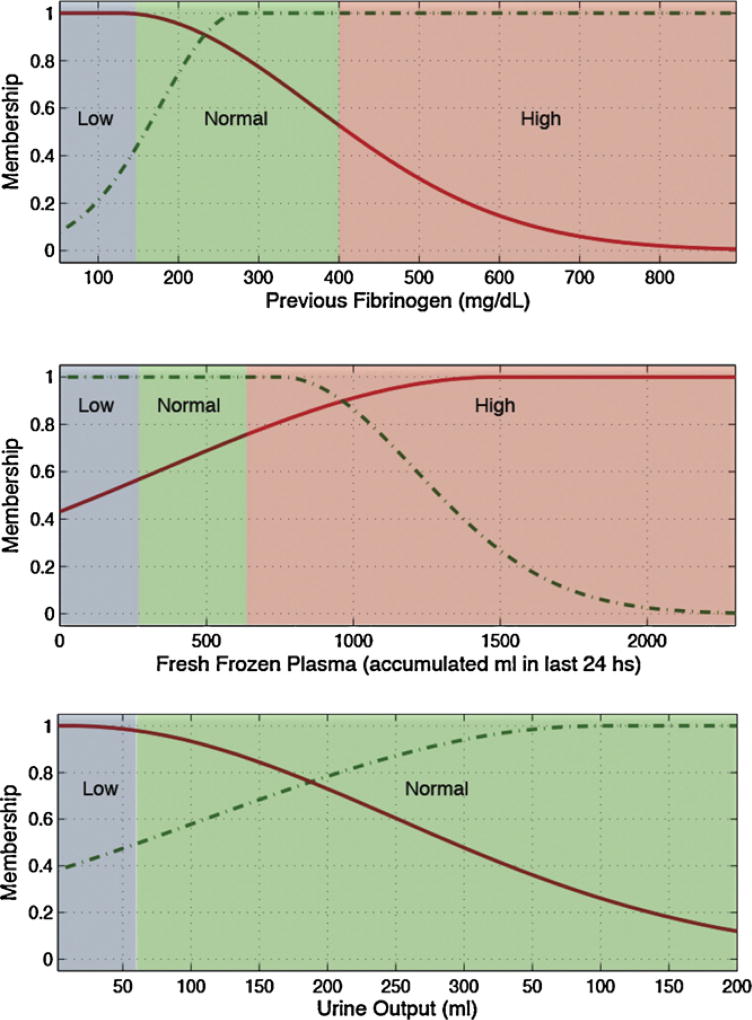
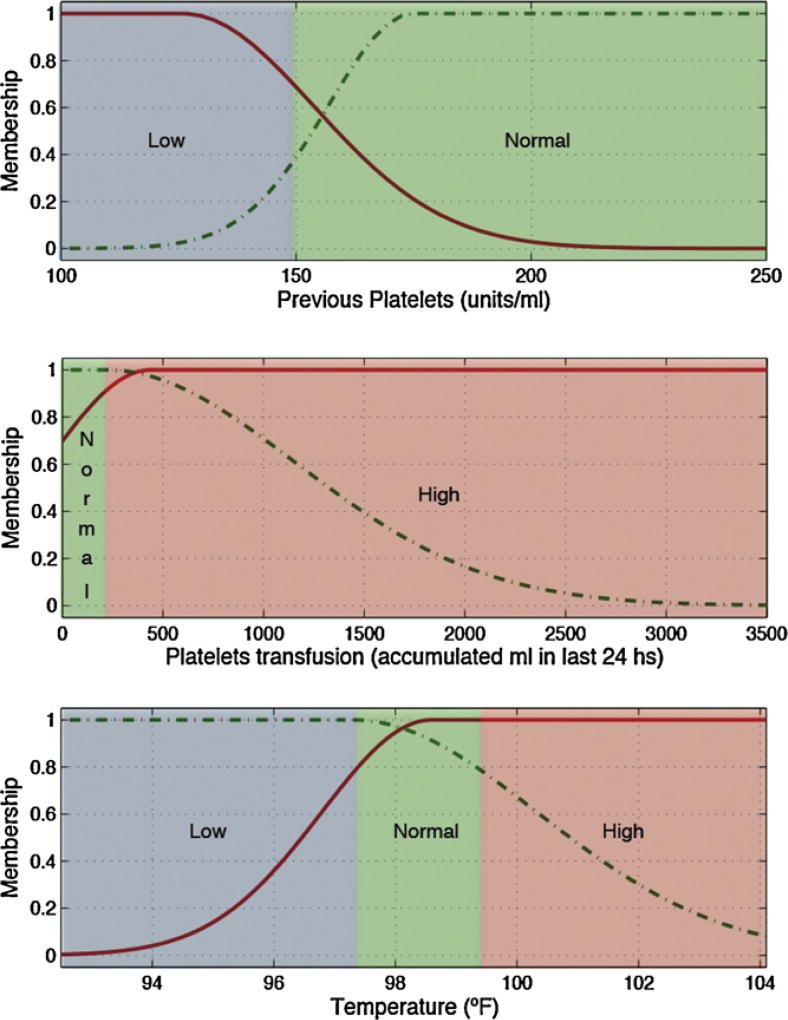
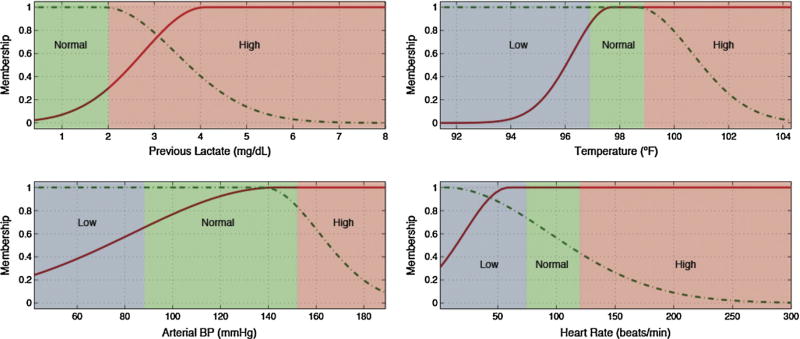
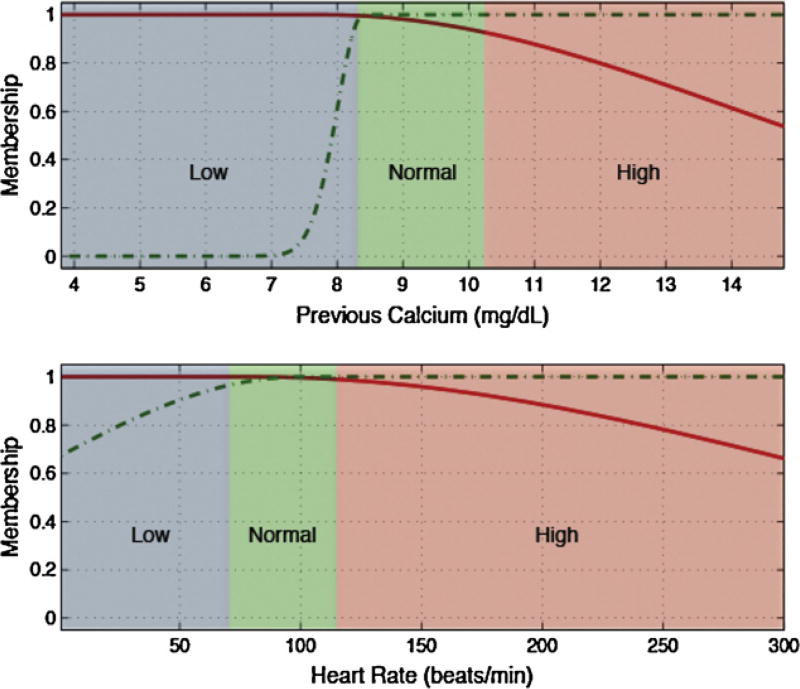
Low, normal and high ranges for each input variable, depicted as blue, green and red backgrounds in Figs. 3 and 4 and in the electronic appendix, where defined according to generally accepted clinical limits [25].
Fig. 3.
Membership functions of the most predictive variables for hematocrit.
Fig. 4.
Membership functions of the most predictive variables for hemoglobin.
Variables selected for each predicted lab test and the rules generated to identify tests with gain of information are detailed in Table 7.
Table 7.
Predictive variables (morning configuration) for each lab test and associated fuzzy rules.
| Lab test | Predictive variables | Rules created (Simplified interpretation) |
|---|---|---|
| Calcium |
|
If Previous Calcium is low and Heart Rate is low then Next Calcium test is relevant |
| Lactate |
|
If Previous Lactate is low and Temperature is high and Arterial blood pressure is high and Heart Rate is normal/high then Next Lactate test is relevant |
| Fibrinogen |
|
If Previous Fibrinogen is low and amount of Fresh frozen plasma transfusion is high and Urine Output is low then Next Fibrinogen test is relevant |
| Platelets |
|
If Previous Platelets is low and amount of Platelets transfusion is high and Temperature is high then Next Platelets test is relevant |
| PTT |
|
If Previous PTT is low and amount of Fresh frozen plasma transfusion is high and amount of Platelets transfusions is high then Next PTT test is relevant |
| INR |
|
If Previous INR is high and amount of Fresh frozen plasma transfusion is high and amount of Platelets transfusions is high and Urine Output is low then Next INR test is relevant |
| Hematocrit |
|
If Previous Hematocrit is low and amount of PRBC is high and SpO2 is normal and amount of Fresh frozen plasma transfusions is high and Arterial blood pressure is normal and IV Infusion is high then Next Hematocrit test is relevant |
| Hemoglobin |
|
If Previous Hemoglobin is low and amount of PRBC is high and Fresh frozen plasma transfusions is high and Arterial blood pressure is normal and IV Infusion is high then Next Hematocrit test is relevant |
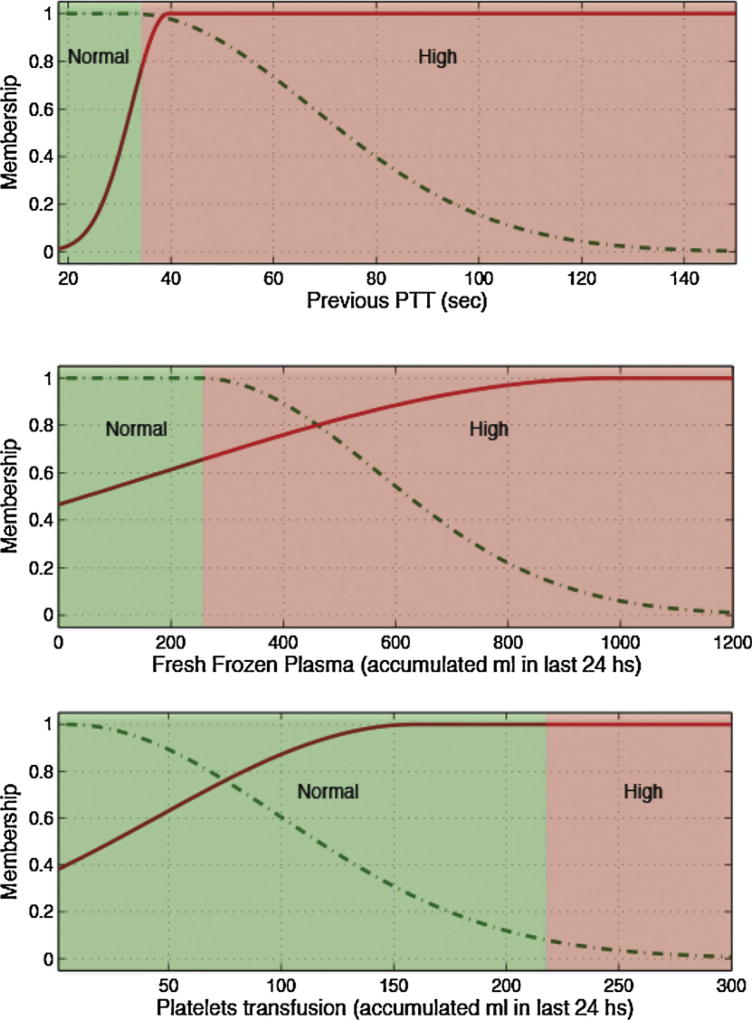
Several pairs of lab tests have similar antecedents, namely hematocrit and hemoglobin, and PTT and INR. These pairings have close physiological relationships and the similarities add first principle clinical validity. This is graphically demonstrated in Figs. 3 and 4 and Figs. 5 and 6, respectively.
Fig. 5.
Membership functions of the most predictive variables for PTT.
Fig. 6.
Membership functions of the most predictive variables for INR.
For all lab tests, and for both online and morning approaches, the greatest contributor to the predictive model was the previous value of the lab test in question.
5. Discussion
The classification results obtained were good in terms of the accuracy, and in recognizing relevant and not relevant tests. The online and morning modeling was undertaken to simulate ICU clinicians’ approaches. Both configurations resulted in high accuracy, sensitivity and specificity. Sensitivity was higher than specificity in all cases, suggesting that fuzzy models found a better set of rules to correctly predict lab tests that represent a gain of information than those which not. One reason for this could be that a significant amount of non relevant lab tests have values that are very close to the proposed outcome thresholds (upper and lower laboratory test ranges), or the drop in laboratory values (outcome variable d in the model formula) is slightly smaller than the cutoff we determined.
The morning configuration gave better results in terms of general accuracy, specificity and sensitivity, suggesting that lab values during a given day have a stronger relationship than values from a previous day (online configuration). This may simply reflect a temporality relationship whereby the closest lab test in time is the best predictor of the next lab test, and the morning configuration best suits lab test closeness. It is also possible that other morning-related activities could make this the better predictor. For example, many clinical interventions and activities not captured by this dataset are deliberately scheduled for business hours when more resources in staff and materials are present. Trial of extubation is one example and this may have some influence on morning blood tests. Furthermore, it is well recognized that humans have cyclical physiological patterns across a range of measurable parameters, e.g. early morning cortisol, and it is possible that these also could influence a morning blood draw as compared to a night blood draw from the previous day.
Table 6 shows the results in terms of the test reduction that can be obtained applying the proposed models in GI bleeds at the ICU. We are able to demonstrate a 50% reduction in testing, which improves the 37% previously published by [1–3]. However, we note a specific risk related to false negatives, shown in the last column of Table 6. In this table we see 11.5% of the tests predicted as not providing an information gain should actually be ordered and would assist decision-making. However, even given this, these results are still better than those obtained by a human with average training in the subject. As a rule of thumb, it is generally accepted that clinicians can correctly classify medical situations with 0.8–0.85 sensitivity, and the models proposed in this paper have an 0.89 average sensitivity for the tests used as outcomes. Although these results are promising, more testing and comparison to human decision-making is required before applying this models in clinical practice.
In Table 7, Figs. 3–6 and in the electronic appendix we can see that all of the hematological blood tests (hemoglobin, hematocrit, PTT, INR and platelets) have transfusions as significant predictors, and indeed in our modeling, the major predictor. This is not unexpected when one considers the direct relationship between transfusion and subsequent hematological assessment. This does however raise interesting prospects around the application of these findings in resource-constrained environments. More specifically, the assessment of transfusion volume replacement can be assessed with “lo-tech” methods as simple as before and after observation and recording, whereas oxygen saturation involves slightly more “hi-tech” resources from bedside monitors. Further work could explore the predictive value of transfusions alone as a simply acquired input variable.
The authors of this paper have previously published a method for test reduction, using neural networks and fuzzy models to determine which hematocrit tests should be done [42]. However, that piece of work did not consider the online and morning approaches proposed here. Moreover, in this work all the labs relevant for GI bleeds were considered, using a misclassification balance method (see Section 3.8). Finally, neural networks were not used in this work because of their black-box nature, and because of showing statistically significant lower performance than fuzzy models.
6. Limitations
We focused solely on data from GI bleeds and so the generalizability of these models cannot be extended to other clinical conditions.
We used a time series format to feed the models and to obtain the predictions, in which each test is not considered individually, but related to previous values. Analysis of individual and/or first tests cannot be carried out with the method proposed in this paper.
We did not undertake comorbidity analysis. Modeling of smaller subsets of patients sharing comorbidities concomitant to GI bleeding, indicating higher similarity, could improve the classification accuracy.
The use of medications that potentially influence coagulation properties of blood were not considered. One limitation of seeking to address this principle would be the desire to then consider all medicines that might potentially influence all of the input variables, individually and collectively, and this list could be large and somewhat unmanageable.
Finally, as is consistent with standard modeling practice, the variables selected as inputs were limited by patients with enough measurements. Other variables may be used, contributing to improve accuracy.
7. Conclusion
Reducing frequent lab testing and the potential clinical and financial implications are an important issue in intensive care. In this work we present an artificial intelligence method to predict the benefit of proposed future laboratory tests. Using ICU data from 746 patients with gastrointestinal bleeding, and 11 easily acquired physiological measurements, we demonstrate high accuracy in predicting the likely information to be gained from proposed future lab testing for 8 common GI related lab tests.
The approaches proposed in this work reached a reduction of unnecessary lab tests of 50%, which considerably improves the previously published 37% obtained with other methods.
Future work will explore applications of this approach to a range of underlying medical conditions and laboratory tests.
Summary points.
Frequent laboratory testing does not necessarily relate to better outcomes.
Reducing frequent lab testing has important clinical and financial implications.
Artificial intelligence has proven successful in modeling medical outcomes with non-linear relations between inputs and outputs.
Predictive modeling through fuzzy systems was applied to a real world ICU database extract comprising 746 patients with gastrointestinal bleeding.
Eight different lab components were predicted using eleven minimally invasive measurements.
Classification accuracy of greater than 80%.
Approximately half of the total amount of tests in those 746 patients could be reduced according to the criteria used in this work.
Acknowledgments
The authors would like to acknowledge the help and space provided by the Division of Clinical Informatics of the Beth Israel Deaconess Medical Center and the Massachusetts Institute of Technology. Both human and technical resources were available through them, and were critical for the development of this work. This work is supported by the Portuguese Government under the programs: project PTDC/SEMENR/100063/2008, Fundação para a Ciência e Tecnologia (FCT), and by the MIT-Portugal Program and FCT grants SFRH/BPD/65215/2009, SFRH/43043/2008 and SFRH/43081/2008, Ministério do Ensino Superior, da Ciência e da Tecnologia, Portugal.
Appendix A
Membership functions for the reduction of lab tests
Fig. A.1.
Membership functions of the most predictive variables for fibrinogen.
Fig. A.2.
Membership functions of the most predictive variables for platelets.
Fig. A.3.
Membership functions of the most predictive variables for lactate.
Fig. A.4.
Membership functions of the most predictive variables for calcium.
Footnotes
Author contributions
Federico Cismondi is responsible for the collection of data, data cleansing and preprocessing, modeling and article writing. Leo A. Celi is responsible for the evaluation of medical significance and accuracy, interpretation, results discussion and article writing. André S. Fialho is responsible for the evaluation of modeling correctness and accuracy of results. Susana M. Vieira is responsible for the evaluation and supervision of results accuracy and article writing. Shane R. Reti is responsible for the evaluation and supervision of medical relevancy, data accuracy and article writing. João M.C. Sousa is responsible for the project coordination, supervision of results and article writing. Stan N. Finkelstein is responsible for the project coordination, supervision of results and article writing.
Conflict of interest
All the authors declare that there were no conflict of interest for the development of the project in general, and for the creation of this manuscript in particular.
References
- 1.Kumwilaisak K, Noto A, Schmidt UH, Beck CI, Crimi C, Lewandrowski K, Bigatello LM. Effect of laboratory testing guidelines on the utilization of tests and order entries in a surgical intensive care unit. Crit. Care Med. 2008;36(11) doi: 10.1097/CCM.0b013e31818b3a9d. [DOI] [PubMed] [Google Scholar]
- 2.May TA, Clancy M, Critchfield J, Ebeling F, Enriquez A, Gallagher C, Genevro J, Kloo J, Lewis P, Smith R, Ng VL. Reducing unnecessary inpatient laboratory testing in a teaching hospital. Am. J. Clin. Pathol. 2006;126:200–206. doi: 10.1309/WP59-YM73-L6CE-GX2F. [DOI] [PubMed] [Google Scholar]
- 3.Gortmaker SL, Bickford AF, Mathewson HO, Tirrell KDPC. A successful experiment to reduce unnecessary laboratory use in a community hospital. Med. Care. 1988;126:631–642. doi: 10.1097/00005650-198806000-00011. [DOI] [PubMed] [Google Scholar]
- 4.Roberts DE, Bell DD, Ostryzniuk T, Dobson K, Oppenheimer L, Martens D, Honcharik N, Cramp H, Loewen E, Bodnar S. Eliminating needless testing in intensive care an information-based team management approach. Crit. Care Med. 1993;10:1452–1458. doi: 10.1097/00003246-199310000-00011. [DOI] [PubMed] [Google Scholar]
- 5.Ezzie ME, Aberegg SK, O JM., Jr Laboratory testing in the intensive care unit. Crit. Care Clin. 2007;23:435–465. doi: 10.1016/j.ccc.2007.07.005. [DOI] [PubMed] [Google Scholar]
- 6.Mehari SM, Havill JH. Written guidelines for laboratory testing in intensive care-still effective after 3 years. Crit. Care Resucitation. 2001;3:158–162. [PubMed] [Google Scholar]
- 7.Garland A, Shaman Z, Baron J, Connors JAF. Physician-attributable differences in intensive care unit costs. A single-center study. Am. J. Respir. Crit. Care Med. 2006;174:1206–1210. doi: 10.1164/rccm.200511-1810OC. [DOI] [PubMed] [Google Scholar]
- 8.Smoller BR, Kruskall MS. Phlebotomy for diagnostic laboratory tests in adults. N. Engl. J. Med. 1986;314:1233–1235. doi: 10.1056/NEJM198605083141906. [DOI] [PubMed] [Google Scholar]
- 9.Low GRHLL, Stoltzfus DP. The effect of arterial lines on blood-drawing practices and costs in intensive care units. Chest. 1995;108:216–219. doi: 10.1378/chest.108.1.216. [DOI] [PubMed] [Google Scholar]
- 10.Astion ML. Interventions that improve laboratory utilization: from gentle guidance to strong restrictions. Lab. Errors Pat. Saf. 2006;2(4):8–9. [Google Scholar]
- 11.Baigelman W, Bellin SJ, Cupples LA, Dombrowski D, Coldiron J. Overutilization of serum electrolyte determinations in critical care units. Intensive Care Med. 1985;11(6):304–308. doi: 10.1007/BF00273541. [DOI] [PubMed] [Google Scholar]
- 12.Sotoishi N, Katsube T, Ogawa K, Yakou S, Takayama K. Time series analysis of the clinical laboratory test result on chemotherapy for gastric cancer. J. Pharm. Pharmaceut. Sci.: Publ. Can. Soc. Pharmaceut. Sci. (Société Canadienne des Sciences Pharmaceutiques) 2008:1482–1826. doi: 10.18433/j3hs3p. [DOI] [PubMed] [Google Scholar]
- 13.Bates DW, Goldman L, Lee TH. Contaminant blood cultures and resource utilization: the true consequences of false-positive results. J. Am. Med. Assoc. 1991;265:365–369. [PubMed] [Google Scholar]
- 14.Woolley RJ. Drug testing of physicians: the danger of false positives. J. Am. Med. Assoc. 1990;264(24):3148. [PubMed] [Google Scholar]
- 15.Takagi T, Sugeno M. Fuzzy identification of systems and its applications to modelling and control. IEEE Trans. Syst. Man Cybernet. 1985;15:116–132. [Google Scholar]
- 16.Sugeno M, Yasukawa T. A fuzzy-logic-based approach to qualitative modeling. IEEE Trans. Fuzzy Syst. 1993;1:7–31. [Google Scholar]
- 17.Buckley J. Universal fuzzy controllers. Automatica (J. IFAC) 1992;28(6):1245–1248. [Google Scholar]
- 18.Fantuzzi C, Rovatti R. On the approximation capabilities of the homogeneous Takagi-Sugeno model. Fuzzy Syst. 1996;2 [Google Scholar]
- 19.Theodoridis T, Agapitos A, Hu H. A qa-tsk fuzzy model vs evolutionary decision. trees towards nonlinear action pattern recognition. In: LaBerge D, Samuels SJ, editors. Proceedings of the 2010 IEEE International Conference on Information and Automation. Harbin, China: 2010. pp. 27–29. [Google Scholar]
- 20.Perlovsky LI. Aspects of Automatic Text Analysis. Springer; Germany: 2007. [Google Scholar]
- 21.Wieland R, Mirschel W. Adaptive fuzzy modeling versus artificial neural networks. Environ. Model. Softw. 2008;23(2):215–224. [Google Scholar]
- 22.Clifford GD, Scott DJ, Villarroel M. User Guide and Documentation for the MIMIC II Database. version 2.1. 2009 [Google Scholar]
- 23.Douglass M, Clifford GD, Reisner A, Moody GB, Mark RG. Computer-assisted de-identification of free text in the MIMIC II database. Comput. Cardiol. 2004;31:341–344. [Google Scholar]
- 24.Porter RS. The Merck Manual of Diagnosis and Therapy. John Wiley & Sons; 2011. [Google Scholar]
- 25.Lee M. Basic Skills in Interpreting Laboratory Data. ASHP; 2009. [Google Scholar]
- 26.Fayyad U, Shapiro GP, Smyth P. From data mining to knowledge discovery in databases. AI Mag. 1996;17(3):37–54. [Google Scholar]
- 27.Cios KJ, Kurgan LA. Trends in data mining and knowledge discovery. In: Pal NR, Jain LC, Teoderesku N, editors. Knowledge Discovery in Advanced Information Systems. Springer; 2005. pp. 200–202. [Google Scholar]
- 28.Pyle D. Data Preparation for Data Mining. Morgan Kaufmann; San Francisco, CA: 1999. [Google Scholar]
- 29.Cismondi F, Fialho AS, Vieira SM, Sousa JMC, Reti SR, Howell MD, Finkelstein SN. Computational intelligence methods for processing misaligned, unevenly sampled time series containing missing data. CIDM. 2011:224–231. [Google Scholar]
- 30.Fialho AS, Cismondi F, Vieira SM, Sousa JMC, Reti SR, Howell MD, Finkelstein SN. Predicting outcomes of septic shock patients using feature selection based on soft computing techniques. In: Huellermeier RKE, Hoffmann F, editors. Applications 13th International Conference, IPMU 2010, Proceedings, Part II, Ser. Communications in Computer and Information Science (CCIS) Vol. 81. Springer-Verlag; Berlin/Heidelberg: 2010. pp. 65–74. [Google Scholar]
- 31.Mendonça LF, Vieira SM, Sousa JMC. Decision tree search methods in fuzzy modeling and classification. Int. J. Approx. Reason. 2007;44:106–123. [Google Scholar]
- 32.Leite CR, Sizilio GR, Neto AD, Valentim RA, Guerreiro AM. A fuzzy model for processing and monitoring vital signs in ICU patients. Biomed. Eng. Online. 2011;10:68. doi: 10.1186/1475-925X-10-68. [DOI] [PMC free article] [PubMed] [Google Scholar]
- 33.Wolf M, Keel M, von Siebenthal K, Bucher HU, Geering K, Lehareinger Y, Niederer P. Improved monitoring of preterm infants by fuzzy logic. Technol. Health Care. 1996:193–201. [PubMed] [Google Scholar]
- 34.Burke MJ, Downes R. A fuzzy logic based apnoea monitor for sids risk infants. J. Med. Eng. Technol. 2006;6(30):397–411. doi: 10.1080/03091900600590140. [DOI] [PubMed] [Google Scholar]
- 35.Otero A, Félix P, Barro S, Palacios F. Addressing the flaws of current critical alarms: a fuzzy constraint satisfaction approach. Artif. Intell. Med. 2009;7(3):219–238. doi: 10.1016/j.artmed.2009.08.002. [DOI] [PubMed] [Google Scholar]
- 36.Sousa JMC, Kaymak U. Fuzzy Decision Making in Modeling and Control. World Scientific Publ. Co.; Singapore: 2002. [Google Scholar]
- 37.Liu H, Hiroshi M. Feature Selection for Knowledge Discovery and Data Mining. Kluwer Academic Publishers; Norwell, MA, USA: 1998. [Google Scholar]
- 38.Milligan GW, Cooper MC. A study of standardization of variables in cluster analysis. J. Classif. 1988;5:181–204. [Google Scholar]
- 39.Vieira SM, Sousa JMC, Kaymak U. Fuzzy criteria for feature selection. Fuzzy Sets Syst. 2012;89(1):1–18. [Google Scholar]
- 40.Horn AL, Cismondi F, Fialho AS, Vieira SM, Sousa JMC, Reti SR, Howell MD, Finkelstein SN. 18th World Congress of the International Federation of Automatic Control (IFAC) Italy: 2011. Multi-objective performance evaluation using fuzzy criteria: increasing sensitivity prediction for outcome of septic shock patients. [Google Scholar]
- 41.Cismondi F, Horn AL, Fialho AS, Vieira SM, Reti SR, Sousa JMC, Finkelstein SN. Multi-stage modeling using fuzzy multi-criteria feature selection to improve survival prediction of ICU septic shock patients. Expert Syst. Appl. 2012;39(16):12332–12339. [Google Scholar]
- 42.Cismondi F, Fialho AS, Vieira SM, Sousa JMC, Reti SR, Celi LA, Howell MD, Finkelstein SN. Predicting laboratory testing in intensive care using fuzzy and neural modeling; 2011 IEEE International Conference on Fuzzy Systems (FUZZ); 2011. [Google Scholar]


