

We describe a new method for measuring the effects of epigenetic marks on protein-DNA interactions.
Abstract
Methylation of CpG (cytosine-phosphate-guanine) dinucleotides is a common epigenetic mark that influences gene expression. The effects of methylation on transcription factor (TF) binding are unknown for most TFs and, even when known, such knowledge is often only qualitative. In reality, methylation sensitivity is a quantitative effect, just as changes to the DNA sequence have quantitative effects on TF binding affinity. We describe Methyl-Spec-seq, an easy-to-use method that measures the effects of CpG methylation (mCPG) on binding affinity for hundreds to thousands of variants in parallel, allowing one to quantitatively assess the effects at every position in a binding site. We demonstrate its use on several important DNA binding proteins. We calibrate the accuracy of Methyl-Spec-seq using a novel two-color competitive fluorescence anisotropy method that can accurately determine the relative affinities of two sequences in solution. We also present software that extends standard methods for representing, visualizing, and searching for matches to binding site motifs to include the effects of methylation. These tools facilitate the study of the consequences for gene regulation of epigenetic marks on DNA.
INTRODUCTION
Methylation of CpG (cytosine-phosphate-guanine) (hereinafter mCpG) dinucleotides is a common epigenetic mark that can either positively or negatively affect the binding of transcription factors (TFs) to specific sites in genomic DNA and alter gene expression (1–7). The effect of methylation on binding affinity for most TFs is unknown, but a recent modification of the high-throughput systematic evolution of ligands by exponential enrichment (HT-SELEX) approach—methyl-SELEX—has greatly increased the number of TFs with measured sensitivities to mCpG (8). Of the nearly one-half of human TFs assayed, about 40% were insensitive to methylation, about 25% showed decreased binding to mCpG, and the remaining ~35% of assayed TFs showed increased binding to mCpG, sometimes to alternative motifs (3, 8). The number of TFs with increased affinity to mCpG-containing DNA is surprising given that DNA methylation is usually associated with transcriptional repression. Many of the TFs with increased affinity are homeodomain proteins involved in developmental processes. The work by Yin et al. (8) provides a very valuable resource about the sensitivity of many TFs to CpG methylation. However, it still covers less than half of human TFs and none from model organisms, although specificities of closely related TFs can sometimes be inferred based on protein similarity (9). Another similar method, EpiSELEX-seq, has been applied to a smaller number TFs with an emphasis on inferring quantitative models of the effects of DNA methylation (10).
The specificities for the TFs in recent studies are represented by position weight matrices (PWMs) for each of the two states of DNA: methylated and unmethylated (8, 10). The scores obtained from the PWM for particular sequences are useful for predicting and ranking potential binding sites in a genome and for predicting the direction of change in binding affinity for variant binding sites, including changes from CpG to mCpG. However, as the authors of methyl-SELEX point out, their scores are “only rough estimates of affinity, and calibration of the motifs using standards, and/or methods such as Spec-seq should be used if precise relative affinity values are desired” (8). We describe Methyl-Spec-seq, an augmented version of Spec-seq (11, 12) that provides high-resolution measurements of relative binding affinity for hundreds to thousands of binding sites in parallel, including the effects of DNA methylation on binding affinity. Methyl-Spec-seq allows one to determine the effects of introducing mCpG at every position within a binding site by enzymatic methylation of DNA libraries, and by using synthetically methylated DNAs, one can also determine the contributions of methyl groups from the two DNA strands independently. It is easy to perform and requires only standard molecular biology techniques and equipment. To assess the accuracy of the Methyl-Spec-seq results, we introduce a method of two-color competitive fluorescence anisotropy (2color-CFA). By measuring the anisotropy of two different DNA sequences, each labeled with a different fluorophore in the same binding reaction, the relative affinity of the two sequences in equilibrium solution conditions can be directly determined. We also introduce an enhanced software platform to deal with the new data. In modeling the effects of methylation on DNA binding affinity, we considered DNA as being composed of a six-letter alphabet. As illustrated in fig. S1, besides the normal A, C, G, and T, there is methyl-C, denoted by M, and a G that is opposite to a methyl-C on the complementary strand, denoted by W (upside-down M). PWMs and sequence logos only display the information from one strand of DNA, although the specificity determining base interaction may occur with either strand. Therefore, it is necessary to distinguish between two types of G bases—those opposite to a C from those opposite to a methyl-C. We extend the energy PWM (ePWM) model to include all six possible bases, and we devise a new energy logo, Meth-eLogo, that includes the energetic contributions of the methylated bases to binding energy. We also describe software for searching DNA sequences that can show the potential binding sites in genomic regions under the two different states of methylated and unmethylated DNA. In addition to quantitatively validating the effect of mCpG on the binding specificity of the imprinting maintenance zinc finger protein ZFP57, we demonstrate the use of Methyl-Spec-seq and the associated methods on identifying the effect of mCpG on the binding specificity of CCCTC-binding factor (CTCF), B cell–activating transcription factor 1 (BATF1), glioma-associated oncogene homolog 1 (GLI1), and homeobox B13 (HOXB13). Furthermore, we report previously undocumented binding motifs for BATF1 and GLI1 and exhibit how the software platform can be used to infer opposing effects of mCpG on DNA binding of ZFP57 and GLI1 that can potentially modulate regulation of the PTCH1 gene. We also show, with both ZFP57 and HOXB13, that Methyl-Spec-seq can easily determine the independent energetic contribution of the methyl group on each strand, information not generally obtained with other approaches.
RESULTS
Methylation sensitivity of ZFP57
ZFP57 was previously identified to be a critical TF for maintaining genomic imprinting patterns among placental mammals (13, 14). Zinc fingers 2 and 3 of mouse ZFP57 can preferentially bind to methylated TGCCGC hexamer sites over unmethylated ones (15, 16), and mutations disrupting its DNA binding domain cause transient neonatal diabetes mellitus type 1 (17). Figure 1A describes the basic workflow of Methyl-Spec-seq and its use in studying the DNA binding specificity and methylation sensitivity of mouse ZFP57. Figure 1B lists the nine randomized libraries used, each containing three randomized positions, for a total complexity of 576 sequences. We include six positions 5′ of the consensus motif to test whether zinc finger 1 contributes to specificity. One library is entirely unmethylated (ZFP57-R2-unmethylated). In some libraries, the C at position 4 and/or the C opposite the G at position 5 are methylated during synthesis of the DNA, whereas in the randomized positions, methylation will occur at CpG dinucleotides only if the DNA is treated with M.SssI methyltransferase (see Materials and Methods). The four versions of the synthetic consensus hexamer are unmethylated (TGCCGC), top-strand hemimethylated (TGCMGC), bottom-strand hemimethylated (TGCCWC), and duplex methylated (TGCMWC). Figure 1C shows the relative binding energy for the 64 variants of positions −2 to 0 from the five different R2 libraries: unmethylated, enzymatically methylated, synthetically duplex methylated (both top and bottom strands), and hemimethylated, on each of the top and bottom strands. The overall range of binding affinities across the 64 variants is small, just more than 1 kT (k is Boltzmann’s constant and T is the temperature used in experiments), indicating that those positions do not contribute much to binding specificity. Positions −5 to −3 also show very little variation in binding energy (Fig. 1D), allowing us to conclude that zinc finger 1 does not contribute much to specificity. However, there is a consistent decrease in binding energy (increase in binding affinity) of about 1.8 kT for the fully methylated DNA compared to the unmethylated DNA. The enzymatically methylated DNA has a binding energy nearly identical to that of the synthetically duplex methylated DNA, indicating that the enzymatic methylation was very efficient. When only the top strand is methylated, the decrease in binding energy (increase in affinity) compared to unmethylated is only about −0.3 kT, whereas the hemimethylated bottom strand shows a change of about −1.5 kT in binding energy. This is consistent with previous measurements that showed that almost the entire preference for binding methylated DNA is due to the methyl group on the bottom strand (16).
Fig. 1. Overview of Methyl-Spec-seq.
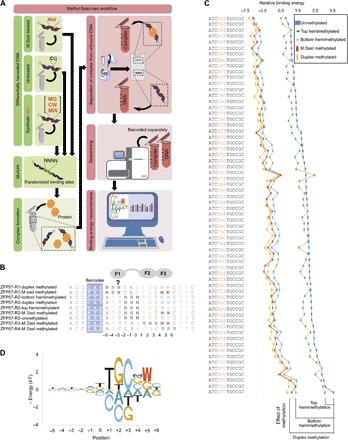
(A) Schematic representation of the general workflow of Methyl-Spec-seq (see Materials and Methods). Briefly, differentially barcoded DNA libraries with variable regions are mixed and used in protein-DNA binding reactions. The DNA libraries are either treated with M.SssI methyltransferase enzyme to incorporate methyl-CpGs or left untreated and can also have synthetic 5′-methyl cytidine (mC). The letters “M” and “W” in red represent mC and mC on the complementary strand opposing a G, respectively. The protein-DNA complex is separated from the unbound DNA, following the binding reaction, in 9% polyacrylamide gel. The bound and unbound fractions are then polymerase chain reaction (PCR)–amplified (eight cycles) using Illumina-specific primers (text S1), and the resulting indexed samples are sequenced to generate energy logos for the binding sites. (B) Randomized double-stranded DNA (dsDNA) library used to measure the binding specificity of ZFP57 and the effect of methylation on binding. The full-length DNA libraries are shown in text S1. The regions highlighted in blue are the unique barcodes to distinguish the libraries during sequencing, whereas “N” in bold represent variable regions within the libraries. (C) Relative binding energy for all 64 variants in R2 libraries with different types of methylation, ranked from low to high binding energies of the unmethylated DNA. The relative binding energies are represented in units of kT, where k is the Boltzmann constant and T is the temperature used in the binding experiments. The 64 sequences of R2 libraries are listed vertically, and the relative binding energies depending on the methylation status are plotted. (D) Meth-eLogo based on the regression of the ZFP57 reference site and all its single variants. The significant effect of methylation at positions 4 and 5, which is the binding site for finger 3 (F3), is also shown. The effect of CpG methylation (mCPG) on binding specificity was calculated from the ePWM listed in fig. S2.
We extend the standard energy matrix model [ePWM, a version of a PWM where the elements of the matrix are the energetic contributions of each base at each position to the total binding energy (18, 19)] to include the energetic contributions of methyl groups on C (other possible base modifications are easily added) (fig. S2). In the Meth-eLogo (Fig. 1D), M indicates the contribution of the methyl group to C on the “top strand” (the one shown in the Meth-eLogo), and W indicates the energy contribution of the methylated C on the other strand, opposite to the G that is included in the eLogo. These energy contributions are the changes in binding energy, when the Cs are methylated compared to the unmethylated Cs. Therefore, in the Meth-eLogo, ignoring M and W provides the standard eLogo for unmethylated sequences, and C + M and G + W are the energies associated with methylated sequences. Methylation energies can be either positive (decreasing binding affinity) or negative (increasing binding affinity) and are shown either below the line or above the line, respectively.
2color-CFA: Validation of Methyl-Spec-seq
Fluorescence anisotropy is a method for measuring binding affinity in solution (20, 21). CFA has been developed as a sensitive assay of the relative affinity of two sequences, where one is fluorescently labeled and the other is an unlabeled competitor (22). By labeling both DNAs with distinct fluorophores [we use fluorescein (FAM) and carboxytetramethylrhodamine (TAMRA)], one can simultaneously assess the binding occupancy of each sequence under identical conditions and therefore directly measure relative binding affinity (see Materials and Methods). The principles of 2color-CFA are illustrated in Fig. 2A. We chose the duplex methylated ATCTATTGCMWC as the reference site with TAMRA labeled on the 5′ end (ME-TAMRA), and FAM was used to label the competitor dsDNA probes with four different methylation states: unmethylated (UN-FAM), top-strand hemimethylated (HM-top-FAM), bottom-strand hemimethylated (HM-bottom-FAM), and duplex methylated (ME-FAM), as illustrated in Fig. 2B. For the reactions with the same preferred sequence for both fluorophores (ME-FAM and ME-TAMRA), the binding probability for the two probes should always be the same; therefore, as we increased the protein concentration from low to high, there should be a linear correspondence between ME-FAM and ME-TAMRA anisotropy signals, which matches our observation quite well (Fig. 2C, ME-FAM versus ME-TAMRA). Furthermore, this establishes the relative amount of change in the anisotropy values for the two fluorophores at equivalent site occupancies. From the anisotropy data for competition between the reference sequence, ME-TAMRA, and each of the four other sequences, UN-FAM, HM-top-FAM, HM-bottom-FAM, and ME-FAM, we can determine relative affinities (Fig. 2C; see fig. S3 for complete data).
Fig. 2. Overview of 2color-CFA.
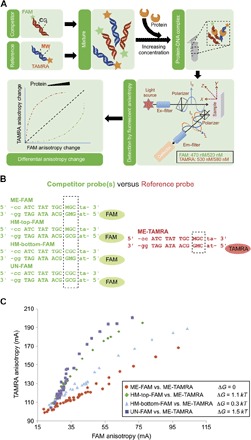
(A) General workflow of 2color-CFA (see Materials and Methods). Briefly, DNAs with either presence or absence of mC are labeled with two different fluorophores, FAM and TAMRA, and mixed together. This mixture of DNAs is titrated with increasing protein concentration, and the fluorescence anisotropy of both fluorophores is measured and plotted. (B) Competitor oligos with different methylation states are labeled with FAM. The reference probe is duplex methylated and labeled with TAMRA. (C) FAM versus TAMRA anisotropy correspondence curves for different competitors and the reference sequence. The horizontal axis represents FAM anisotropy involving the protein-competitor complex, whereas the vertical axis represents TAMRA signal for the protein-reference complex. The inset shows the binding energy differences between the competitor sequences and the reference. Energy differences are computed from the natural log of the ratio in Eq. 3, obtained from the best linear fit to the data using only points with TAMRA anisotropy values <150.
The anisotropy for DNA sequence Si, labeled with fluorophore X, depends on the probability (or fraction) of the sequence that is bound, P(B|Si)
| (1) |
where bX,i is the background anisotropy for that sequence and fluorophore, which is the anisotropy in the absence of protein. ax,i is the rate of change of the anisotropy with changes in the binding probability of the sequence, which depends on the protein concentration
| (2) |
where [TF] is the concentration of the free protein (TF) and Ki is the association constant of the TF for sequence Si. If the reaction is at low protein concentration, such that Ki[TF] ≪ 1, then P(B| Si) ≈ Ki[TF]. Combining these equations for experiments performed at low protein concentration, we can determine the relative affinities of two sequences, Si and Sj, from the measured anisotropy of two different fluorophores; we use FAM(F) and TAMRA(T) (see Materials and Methods)
| (3) |
where f(⋅) refers to the slope of the ratios of the two anisotropy measurements obtained over several protein concentrations. Figure 2C shows the entire set of data points, from four independent experiments, for many different protein concentrations for the four different methylation states of the DNA, all using the ME-TAMRA as the reference sequence (fig. S3). The slopes are obtained using only those points for which the TAMRA anisotropy is less than 150, where the points are all approximately linear; the R2 for the slopes ranges from 0.86 (for UN-FAM) to 0.97 (MET-FAM), indicating the highly reproducible measurements. The ratio is obtained from the experiment, where the reference sequence is labeled with both fluorophores (ME-TAMRA and ME-FAM). For the other sequences, the relative binding energies are 1.5, 1.1, and 0.3 kT for unmethylated, top-methylated, and bottom-methylated, respectively. Those values are consistent with the ones obtained from Methyl-Spec-seq although slightly smaller in magnitude. They are also somewhat smaller numbers than those reported previously, but all of the results consistently show that the strong preference for methylated DNA over unmethylated DNA is due almost entirely to the methyl group on the bottom strand (16).
CTCF binding affinity drops with CpG-methylation (mCPG) at some positions
After we validated the resolution and throughput of Methyl-Spec-seq by using ZFP57 and demonstrating that the specificity information obtained from the use of enzymatically methylated DNA is comparable to that of synthetically methylated DNA, we extended this method to studying another ZFP—CTCF. We demonstrate that it is feasible to systematically scan the whole binding site and test the mCPG at every position within the binding site by enzymatic methylation. Our library design and Methyl-Spec-seq results for the mouse CTCF insulator protein are shown in Fig. 3. CTCF is a critical component for establishing the three-dimensional genomic architecture and known to be subject to mCpG modulation (23, 24). However, a recent study shows that most genomic sites for CTCF have the same occupancy whether or not they are methylated (25). In our randomized libraries design, including both unmethylated and enzymatically methylated DNA, we deliberately picked a non-CpG–containing site, CCACTAGGGGGCACTA, as the reference site instead of the canonical CCACTAGGGGGCGCTA (the difference in sequence is underlined; Fig. 3A). The libraries R1 to R5 were designed to overlap by 1 base pair (bp) so that CpG dinucleotides in every possible position will be included at least once. Each library has four randomized positions; thus, there are more than 1200 different sequences in each of the methylated and unmethylated libraries. Some previous work suggested the existence of an “upstream motif” at variable distance to the canonical core motif (26), but in this work, we focused only on characterizing the commonly found core motif using the partially truncated mouse CTCF carrying only zinc fingers 1 to 9 for the protein-DNA binding assay.
Fig. 3. Methyl-Spec-seq analysis of CTCF.
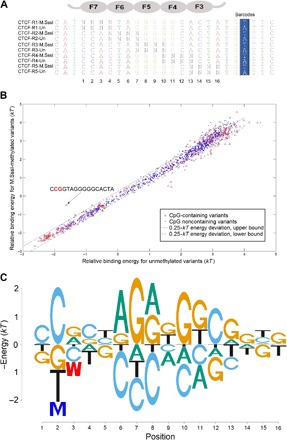
(A) Randomized dsDNA libraries for CTCF. The full-length libraries with the 5′ and 3′ flanking sites are shown in fig. S4. The 3′ internal barcodes are highlighted in blue. These DNAs were either methylated using CpG methyl transferase (M.SssI) or left untreated (Un) before mixing and used for binding assay (see Materials and Methods). (B) Comparison of binding energies between unmethylated (horizontal axis) and methylated (vertical axis) sites. The red circles denote CpG-containing sites in the libraries, whereas the blue circles represent sites that do not contain any CpG. The 0.25 kT energy deviation bounds are also shown in dashed lines. (C) Energy logo based on the CTCF reference site and all of its single nucleotide variants. The substantial effect of methylation at positions 2 and 3 is highlighted.
One advantage of working with enzymatically methylated DNA is that M.SssI can only methylate the CpG dinucleotide but has no effect on other dinucleotide sequences. Therefore, all non-CpG–containing sites shared between unmethylated and M.SssI-treated DNA libraries serve as controls to gauge the intrinsic reproducibility in our experiment. As shown in Fig. 3B, for almost all high-affinity (low-energy) sites, the energy deviation between unmethylated and M.SssI-treated non-CpG–containing sites falls within 0.25 kT deviation bounds, which is consistent with the measurement resolution of our other Spec-seq experiments (12, 27–30).
Among the CpG-containing sites, methylation of CCGGTAGGGGGCACTA has a higher binding energy of 1 kT than the unmethylated one, indicating that mCpG in positions 2 and 3 can inhibit DNA binding by decreasing the affinity up to threefold, which is consistent with a prior report showing that positions 2 and 3 are most sensitive to DNA methylation (31). Although there are some divergences for low-affinity (high-energy) binding sites, we did not find any strongly methylation-sensitive locus besides positions 2 and 3. The CTCF Meth-eLogo (Fig. 3C) is based on the energy values of reference site and all its single variants, including the methylation effect (fig. S2).
Methyl-Spec-seq reveals new binding preference for BATF1
BATF is an activating protein 1 (AP1) family member composed of a heterodimer of JunB and BATF1 (Fig. 4A) (32, 33). In determining its specificity for binding sites, we discovered that it binds with nearly equal affinity to both 7-bp- and 8-bp-long sites containing the AP1 consensus sequences TGA(C/G)TCA and TGACGTCA, respectively (Fig. 4, C and D), which has not been reported previously. Because the 8-bp-long binding site contains a CG in the center, we tested its methylation sensitivity. Figure 4B shows the libraries used for Methyl-Spec-seq and the effect of methylation on binding energy (fig. S4). For the 8-bp site, we observe an increase in binding energy of nearly 0.6 kT with the presence of mCpG on either strand and about 1.2 kT for fully methylated DNA (Fig. 4E and fig. S2). This is nearly identical to the reduction in binding affinity reported for the related TF activating transcription factor 4 when methylated at the central CpG (10).
Fig. 4. Methyl-Spec-seq analysis of BATF1.
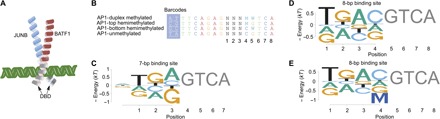
(A) Cartoon of JunB and BATF1 protein binding dsDNA. (B) DNA libraries with 3-bp randomized regions for AP1. See text S1 for the full-length DNAs with flanking sites. (C) Binding energy logos for AP1 binding to 7-bp sites. (D) Binding energy logos for AP1 binding to unmethylated 8-bp sites. (E) Binding energy logo for 8-bp sites includes effects of methylation. All logos are based on consensus sites for the 7- and 8-bp sequences and their respective single-nucleotide variants. Only half-sites are shown with the assumption of symmetric binding sites.
Effect of mCpG on GLI1 binding affinity and regulation of PTCH1
GLI1 is a ZFP involved in the hedgehog signaling pathway (34) with a known consensus site of GACCACCCA (35, 36) that interacts with zinc fingers 4 and 5 via an unusual arrangement of amino acid–DNA contacts (37). One gene regulated by GLI1 is PTCH1, the upstream signaling regulator of Sonic hedgehog pathway (38). This essentially forms an autoregulatory feedback to modulate the protein homeostasis of GLI1 inside the nucleus. Although the GLI1 consensus site contains no CpGs, expression of PTCH1 and binding by GLI1 have been shown to be sensitive to methylation of the promoter region in certain cancers (38–40). Using Spec-seq and libraries with a 7-bp-long region 3′ of the known consensus, we find an extended consensus sequence of CGTCGCA that may interact with zinc fingers 2 and 3 (Fig. 5A). This extended consensus sequence, which contains two CpGs, is present in the PTCH1 promoter region of placental mammals (Fig. 5B). We tested whether methylation of those CpGs affected binding using Methyl-Spec-seq with the libraries shown in Fig. 5C. Methylation of both of the preferred CpGs has a large increase in binding energy (Fig. 5, A and C, and fig. S2). There is a ZFP57 binding sequence (Fig. 1D) adjacent to the GLI1 binding site that is conserved in the placental mammals, all of which contain the ZFP57 gene (Fig. 5B). Although, to our knowledge, there is no evidence for ZFP57 binding to this site, it is interesting to speculate that ZFP57 and GLI1 alternatively bind to this region depending on its methylation status. The predicted binding energy for this region, on the basis of the ePWMs that include the methylation energies (fig. S2), is shown in Fig. 5D. In the unmethylated state, GLI1 is predicted to bind with high affinity and ZFP57 with very low affinity, whereas if the DNA is methylated, the predicted binding affinities are reversed. By using ePWMs that contain information about the effects of methylation on binding energy, one can readily obtain predictions about differences in binding site occupancy under alternative states of DNA methylation.
Fig. 5. Methyl-Spec-seq analysis of GLI1.
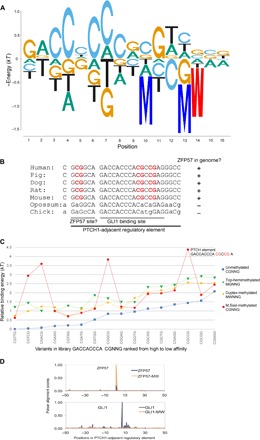
(A) Energy logo based on the regression of GLI1 binding sites. The methylation effect at positions 10 to 14 (binding site for fingers 2 and 3) is included. See text S1 for a list of libraries, with differential methylation profiles, used for binding studies. (B) Comparative genomics for protein patched homolog 1 (PTCH1) regulatory element bound by GLI1 and the adjacent bases that include a ZFP57 consensus sequence in the placental mammals. (C) The effect of methylation on two CpG loci inside the PTCH1 element. (D) Alignment scoring involving the PTCH1 adjacent regulatory element (B) and 50-bp flanking sites (human genome) against ZFP57 and GLI1 ePWMs, including the effect of methylation. See fig. S2 for the ePWMs. “-MW” refers to predictions on mCpG-containing DNA.
mCpG contributions to alternative motifs for HOXB13
HOXB13 is a homeodomain TF that is required for normal prostate development (41, 42), and mutations of the gene are associated with prostate and other cancers (43, 44). Using HT-SELEX, Jolma et al. identified a primary motif with a preferred sequence of CCAATAAAA and a secondary motif of CTCGTAAAA, with differences between them in three consecutive positions (underlined) (9, 45). From protein binding microarray data, a motif that is a combination of the those two motifs [C(C/T)(C/A)(A/G)TAAAA] was found (9). Using methyl-SELEX, Yin et al. (8) found the CAA version of the motif enriched only in unmethylated DNA, whereas the TCG motif was preferred in both methylated and unmethylated DNA. They also found evidence for both motifs in ChIP-seq (chromatin immunoprecipitation sequencing) data. The fact that the two preferred binding sites differ at each of three consecutive positions implies nonadditivity in the binding interaction. To quantify the contributions of different sequences at those positions and to measure the effects of methylation on the two strands independently, we designed libraries in which all possible sequences occur at those three positions in four possible states: unmethylated, duplex methylated, and hemimethylated, on each strand separately (Fig. 6A). Replicate experiments show highly reproducible results across the entire range of binding affinities (fig. S5).
Fig. 6. HOXB13-binding specificity and methylation sensitivity.
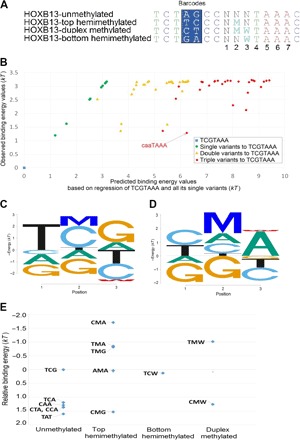
(A) The randomized library design for mouse HOXB13, with a total diversity of 100. Two-base barcodes were used to differentiate each methylation state. (B) For unmethylated DNA, an ePWM was generated from the binding energies of TCG and all single-base variants. From that ePWM, the binding energy is predicted for all unmethylated sequences. The predicted and measured energies are plotted. (C) Energy logo based on the regression of primary motif site TCG and all its single variants, with different methylation states included. (D) Energy logo based on the regression of secondary motif site CCA/CAA and all single variants, including methylation states. (E) All sequences, for each possible methylation state, within a range of 1.6 kT (either positive or negative) of the reference unmethylated TCG.
Consistent with the finding on unmethylated DNA by Jolma et al. (45), if we used the ePWM derived from TCG and all its single variants to predict the binding energy of every sequence, we found that the measured values for many variants are significantly below the predicted energies (higher affinity than predicted by the ePWM, Fig. 6B). CAA is the most significant outlier, but several other sequences with multiple changes from the TCG reference also show much higher affinity than predicted, indicating a large degree on nonindependence between positions in the binding site interaction.
When considering the effects of methylation, there are several surprising results not observed in the previous report (8). These are partially represented by the Meth-eLogos that have been generated separately for the reference sequence TCG and all single base variants, including methylation state (Fig. 6C), and for the alternative reference C(A/C)A and its single base variants, including methylation state (Fig. 6D; ePWMs are shown in fig. S2). The first surprise is that only the methyl group on the middle position contributes to increased binding affinity; the bottom-hemimethylation at the third position has essentially no contribution [the average is about 0.1 kT increase in binding energy for the TCG motif and −0.1 kT for the C(A/C)A motif, within the measurement uncertainty range and too small to be included in the ePWMs]. This is inconsistent with the structural model presented by Yin et al. (8) that suggested that the methyl groups on both strands would contribute to increased binding affinity of methylated DNA, and although methylation of the C at position 2 increases binding affinity for both motifs, the quantitative effects are much different. For the TCG motif, the average contribution of top-hemimethylation is −0.8 kT, whereas for the C(A/C)A motif, the average contribution is −1.5 kT (fig. S2).
The independent effects of methylation on the two strands and the large degree of context dependence are illustrated in Fig. 6E. The reference sequence is unmethylated TCG with a defined energy of 0. For each of the four possible methylation states, all sequences within a range of 1.6 kT (either positive or negative) are shown. In unmethylated DNA, there are five sequences with binding energies between 1.1 and 1.6 kT: TCA, TAT, CAA, CTA, and CCA. Only the reference sequence TCG can be methylated opposite the G at position 3 (bottom-hemimethylated DNA), which increases the binding energy (~0.1 kT). When the C at position 2 is methylated (top-hemimethylated DNA), CMA is the highest-affinity sequence in the entire collection, decreasing the binding energy by −3.1 kT over CCA. TMG decreases the energy to −0.8 kT but is no better than TMA, which decreases the energy by about −2 kT. ACA and CCG are not within the range plotted for unmethylated DNA, but methylation of their Cs in position 2 decreases the binding energy sufficiently to bring them into the plot. AMA decreases the binding energy to about 0 (the same as the unmethylated reference), and CMG decreases to about 1.4 kT, within the range of several of the top unmethylated sequences. Among all of those sequences, only TCG and CCG can be duplex methylated, and in both cases, there is a very small decrease in binding energy compared to the top-hemimethylated DNA.
Although the results with hemimethylated DNA are probably not relevant to in vivo binding, they are informative about the mechanism of interaction. Clearly, only one of the two methyl additions contributes significantly to increased binding affinity, and the magnitude of that increase is highly context-dependent. These results indicate that the interaction of HOXB13 with DNA and the effects on the interaction from adding a methyl group at one specific position are highly complex and nonindependent and probably involve alternative modes of binding to the DNA.
DISCUSSION
Methyl-Spec-seq provides quantitative measurements of the effect of mCpG on the specificity of DNA binding proteins. The affinity of individual proteins may be either increased or decreased upon methylation, and the effects may vary at different positions within the binding site. By simultaneously assessing the relative affinities of hundreds to thousands of binding sites, including the effects of methylation, it facilitates the quantitative modeling of mCpG effects on gene regulation. It is easy to independently assay the effects of methylation on each strand, which may lead to insights into the mechanistic details of the interaction. It requires only standard molecular biology equipment and availability of synthetic DNA and DNA sequencing facilities. A 2color-CFA method that can accurately measure relative binding affinities between two sequences under equilibrium solution conditions shows that Methyl-Spec-seq results are quantitatively quite accurate. We also introduce augmented software that allows one to include the contributions of methylation of C residues to standard ePWMs and to provide a convenient method of visually displaying that information with Meth-eLogos. We also describe the use of the extended ePWMs in searching genomes, where one can predict the probability of binding to specific sites in either methylated or unmethylated states. The recent report of methylation sensitivity for a large fraction of human TFs provides a valuable resource (8), but in cases where the TF of interest is not included in that collection or more precise energy parameters are desired, Methyl-Spec-seq provides a very tractable approach to obtain the needed information.
MATERIALS AND METHODS
Methyl-Spec-seq libraries design
As opposed to conventional Spec-seq workflow, in Methyl-Spec-seq, each DNA sequence can exist in multiple methylation states: unmethylated, hemimethylated, and duplex methylated (Fig. 1A and fig. S1) (11, 12). Moreover, each methylated CpG site could be made either by direct chemical synthesis (either hemimethylated or duplex) at designated positions or by M.SssI enzymatic treatment for every CpG dinucleotide inside the template. Text S1 includes detailed lists of all the used randomized DNA template sequences and corresponding primers in aligned format. Each methylation state of DNA sequence is uniquely distinguished by a barcode in the flanking region of randomized binding sites. For mouse ZFP57 specifically, we designed five 3-nucleotide–long barcodes in designated positions (−8 to −6) to represent unmethylated, top hemimethylated, bottom hemimethylated, chemically duplex methylated, and M.SssI-methylated DNA, respectively. Duplex DNA libraries for ZFP57, excluding R1–duplex methylated, R2-top hemimethylated, R2-bottom hemimethylated, and R2-duplex methylated, were made by incubating templates and 5′-FAM labeled primer, Physics-FAM, or Physics-GMG-FAM (text S1) in a single round of Taq-polymerase [New England Biolabs (NEB)] extension (95°C for 15 s and 52°C for 12 min, cooled to room temperature). All randomized libraries, except for GLI1-Rand6–duplex methylated, were annealed and extended in a forward-template/reverse-primer fashion.
Enzymatic methylation of CpGs by M.SssI
Up to 2 μg of fully extended dsDNA libraries was incubated with 20 U of M.SssI enzyme (NEB) at 37°C for 1 hour. Given previous report of M.SssI’s potential topoisomerase activity (46) in the presence of Mg2+, we used a buffer containing 50 mM NaCl, 10 mM tris-HCl (pH 7.9), 10 mM EDTA, and 320 μM S-Adenosylmethionine (SAM) at 25°C for optimal activity. After M.SssI methylation, purified dsDNA libraries were further digested by a cocktail of methyl-CpG–sensitive restriction enzymes, including Hpa II (CCGG), Hha I (GCGC), Aci I (CCGC), Hpy CH4IV (ACGT), and BstU I (CGCG), so that all those remaining unmethylated sites matching any of the above cutting sites should be digested. The digestion reaction was run in 1× NEB CutSmart buffer at 37°C for 30 min.
Pooling of dsDNA libraries with different methylation states
The dsDNA libraries with different methylation states were mixed together according to their internal sequence diversity, so that, on average, each sequence variant would have a similar percentage in the final sequencing pool.
Cloning, expression, and purification of recombinant proteins
The coding sequences of ZFP57 (77 to 198; UniProt Q8C6P8-1), CTCF (241 to 523; UniProt Q61164-1), and HOXB13 (202 to 286; UniProt P70321) were PCR-amplified from cDNA libraries of mouse embryonic stem cells or mouse genomic DNA. GLI1 (226 to 398; UniProt P47806-1), BATF (full; UniProt O35284), and JunB (146 to 344; UniProt P09450-1) were separately synthesized by gBlocks [Integrated DNA Technologies (IDT)] service. All linear dsDNA fragments except JunB were cloned into NEB dihydrofolate reductase control vector (as in fig. S8) by In-Fusion homology recombination for Escherichia coli–based protein expression under T7 promoter (BL21) cells, whereas JunB was separately cloned into pBR322-based vector for coexpression with BATF gene. All clones were verified by Sanger sequencing.
After extensive trial-and-error efforts to express ZFPs in E. coli, we found that hisSUMO tag conferred ideal protein solubility and stability for downstream work. At least 15 residue linkers were put between the SUMO (small ubiquitin-like modifier) tag and the gene of interest (ZFP57, CTCF, Gli1, and HOXB13). The protein expression and nickel column–based purification protocols were essentially the same as our previously published work except that 100 μM ZnCl2 was added into LB culture medium, cell suspension buffer, and protein binding and elution buffer for proper folding of ZFPs. Purified protein stocks were stored in 25% glycerol, 10 mM tris-HCl (pH 7.5 at 25°C), 100 mM NaCl, 100 μM ZnCl2, and 1 mM tris(2-carboxyethyl)phosphine (TCEP) at −20°C condition for long-term use.
The AP1 family TFs JunB and BATF1 function as heterodimers (Fig. 4B) (33); thus, we designed two separate constructs, JunB-6×His (low copy, kanamycin-resistant) and mCherry-BATF1 (high copy, ampicillin-resistant), and cotransformed them into E. coli BL-21 (DE3) cells under the co-selection of kanamycin and ampicillin. After overnight isopropyl-β-d-thiogalactopyranoside (IPTG) induction of 100 ml of liquid culture at 30°C, cell pellets were harvested, sonicated, and spun down. The supernatant was used for Sepharose (GE Healthcare) ion-exchange chromatography and nickel column purification sequentially. During the whole process, mCherry was used as indicator for the presence of heterodimer TFs. The final product was analyzed on SDS–polyacrylamide gel electrophoresis gel to confirm the purity and 1:1 molar ratio between JunB and BATF1.
The purified protein stocks were stored in 10 mM tris-HCl (pH 7.5) containing 25% glycerol, 100 mM NaCl, 100 μM ZnCl2, and 1 mM TCEP at −20°C. Protein concentration was measured by using the equation C = (1.55 × A280) − (0.76 × A260), where C is the concentration of the protein in milligrams per milliliter, A280 is the absorbance of protein samples at 280 nm, and A260 is the absorbance at 260 nm.
Besides E. coli (BL21)–based protein expression, we succeeded in using the PURExpress system (NEB) for cell-free expression of hisSUMO-HOXB13 protein. Briefly, up to 200 ng of linear PCR fragment of hisSUMO-HOXB13 construct-carrying T7 promoter and terminator was coincubated with the 25-μl PURExpress reactions with murine RNase inhibitor inside for 2 hours at 37°C. The expressed product could be directly used for electrophoretic mobility shift assay (EMSA) work and was confirmed by Spec-seq result later. Without SUMO tag on the N terminus, we could not detect a shifted band for the in vitro expressed HOXB13 protein alone; thus, this SUMO-based expression strategy may serve as a good starting point for other Spec-seq assays.
DNA separation by EMSA, extraction, amplification, and sequencing
All protein-DNA binding reactions were run in 1× NEB CutSmart buffer [50 mM potassium acetate, 20 mM tris-acetate, 10 mM Mg acetate, and bovine serum albumin (100 μg/ml) (pH 7.9)] in 20 μl volume. Usually, 200 ng of premixed dsDNA libraries was used in each reaction. The DNA was titrated with protein, from low to high concentration, into a series of samples and incubated at room temperature for at least 30 min. EMSAs were run in 9% tris-glycine gel at 200 V for 30 min in a cold room (~4°C) by default. The Supplementary Materials figs. S6 and S7 include EMSA sample gel pictures for all the proteins. The DNA extraction, amplification, and sequencing protocols are the same with normal Spec-seq (28). Briefly, the FAM-labeled DNA fragments in the bound and unbound fractions were visualized by a Bio-Rad imager with a 520-nM band-pass filter. The visible bands were excised from the gels, and DNAs were extracted and purified using acrylamide extraction buffer (100 mM NH4OAc, 10 mM Mg acetate, and 0.1% SDS) and Qiagen gel purification columns, as previously described. The DNAs were amplified for 10 cycles and barcoded simultaneously by indexed Illumina primers (see text S1).
Methyl-Spec-seq data analysis and energy logo visualization
In a protein-DNA binding reaction, the dissociation constant, KD, is defined as the ratio of the equilibrium concentrations of reactants and the DNA-protein complex
| (4) |
Therefore, in a binding reaction involving a TF and a library of DNAs, the ratio of the concentrations of the bound and unbound species, directly proportional to the number of individual DNA molecules in those fractions, determines the relative specificity of the competing DNA binding sites (11, 12)
| (5) |
| (6) |
Note that NB and NU are the numbers of reads of a species (S) in bound or unbound fractions, respectively.
In Methyl-Spec-seq, depending on the library design, each sequencing read carries two pieces of information—the DNA methylation status and the binding site sequence. The sequencing results from Illumina 1X75 MiSeq runs were filtered and sorted based on conserved regions and methylation-specific barcodes and then counted for binding-site energy analysis. As with conventional Spec-seq (11, 12), for any specific binding site, the relative affinity should be directly proportional to the ratio of bound to unbound reads (Eq. 6), and the relative binding energy can be derived from the natural logarithm of that and represented in kT units.
For all TFs, ePWMs and eLogos (18, 19) were based on the data regression of the TF’s binding energy to its reference sequence and sequences with single-nucleotide mismatches, where methylated “M” or “W” represents the additional energy contribution between methylated and unmethylated cytosine, either in the top or bottom strand. The Meth-ePWMs for each protein in this study are provided in fig. S2. Software for the regression, eLogo production, and sequence searches are described in text S2.
Two-color competitive fluorescence anisotropy
Fluorescence anisotropy is a powerful solution-based technique to characterize protein-ligand interactions (20, 21, 47). For protein-DNA interaction studies, one usually titrates the protein of interest from low to high concentration while keeping the fluorescently labeled DNA probe at the same concentration for the binding reactions and then records the anisotropy signal change to estimate binding affinity between protein and its target sequence. There are three related issues. First, the fluorescence anisotropy signal is known to be highly sensitive to buffer conditions, that is, pH, temperature, presence of glycerol, and ionic strength, all of which change the rotational speed of fluorophores, thus very often repeating an experiment could produce variable results by up to 50% affinity difference or 0.5 kT energy deviation. To characterize the potentially subtle effect of mCpG on protein-DNA interactions, this data variation is far from ideal. Second, to determine the absolute binding affinity between any protein and its ligand, one must have accurate knowledge of functional protein concentration titrated into each sample instead of total protein concentration. For some “hard-to-fold” proteins like zinc finger domains, it is entirely possible that only a small fraction of recombinant proteins produced are properly folded and functional; therefore, the determined binding affinity for each sequence could be underestimated. Third, choosing a suitable site for fluorescent labeling becomes more challenging because of the protein-fluorophore interactions in high protein concentration range, and it is indicated by altered total fluorescence emission intensity. Under these conditions, the true saturation range for a protein-DNA interaction is confounded and compromises data accuracy. For most applications, only the relative affinities to different DNA sequences or, equivalently, the differences in binding free energy are needed, not absolute KD values. Relative binding affinities can be measured using CFA, where the binding to the labeled DNA is in competition with an unlabeled DNA with a different sequence (22). That approach relieves some of the complications of standard fluorescence anisotropy experiments, but there remain issues about knowing the absolute differences in concentration of the two DNAs and variations in conditions between different reactions.
To address the above problems and validate our Methyl-Spec-seq results, we developed a modified version of the competitive fluorescence anisotropy method, 2color-CFA, to study TF-DNA interaction specificity and methylation sensitivity (Fig. 2A). By measuring the anisotropy to both fluorescently labeled DNA sequences competing for the same pool of protein in exactly the same reaction, we can obtain relative affinities directly from the changes in anisotropy of the two fluorophores. We label the two DNA probes with TAMRA and FAM separately, using TAMRA for the reference site (methylated) and FAM for the competitor site. In a control experiment, the reference sequence is labeled with both TAMRA and FAM to determine the relative change in anisotropy for the two fluorescent dyes under identical occupancies of the binding sites. This difference is taken into account when determining the relative occupancy of two different binding sites, from which relative binding affinities are obtained (Eqs. 1 to 3).
Preparation of reference and competitor probes
High-performance liquid chromatography–purified FAM- and TAMRA-labeled DNA oligos were purchased from IDT. Under 2× NEB buffer 4 conditions, 30 μl of 100 nM forward strand oligo and 20 μl of 100 nM FAM- or TAMRA-labeled reversed strand oligo were mixed together, denatured at 95°C, and then annealed by gradient temperature decrease to room temperature at an average speed of 1°C/5 s. The final dsDNA oligo probes were calibrated at a concentration of 40 pM/μl. Figure 2B shows a full list of oligo sequences used in 2color-CFA.
Protein-DNA binding reaction
All protein-DNA binding reactions were run in 1× NEB CutSmart buffer in 96-well plate format (Corning, Nonbinding Surface) at room temperature (25°C). In each 100-μl reaction, 30 nM FAM- and TAMRA-labeled dsDNA were used as a starting point for anisotropy measurement. Protein solutions were titrated into each sample from 0 to 100% relative concentrations using a preprogrammed Eppendorf epMotion 5075 liquid handler. Because it is known that fluorescence anisotropy experiment is sensitive to the buffer salt condition, usually no more than 5% v/v protein solution was titrated into each sample. In addition, protein blank buffer with the same composition as the protein stock was used to counterbalance the effect of increasing volume of protein solution in each subsequent set.
Fluorescence anisotropy measurement
After incubating the binding reactions for at least 30 min to reach equilibrium, the sample plate was loaded onto a Tecan Safire 2 plate reader for anisotropy measurement. The G factor was set to be 1.0 by default and can be further calibrated to match the instrument condition. For FAM, excitation and emission wavelengths were set at 470 and 520 nM, respectively, at a bandwidth of 20 nM, whereas for TAMRA, they were set at 530 and 580 nM, respectively, at the same bandwidth. Each sample was measured 15 times at room temperature (25°C), and the mean anisotropy was calculated. Anisotropy measurement data from four independent experiments are shown in fig. S3.
Supplementary Material
Acknowledgments
We thank the anonymous reviewers for several good suggestions that improved the manuscript, including the addition of HOXB13 in the analysis. Funding: This work was supported by NIH grant HG000249. Author contributions: Z.Z. conceived the Methyl-Spec-seq method, developed it and the 2color-CFA method, and performed experiments on all proteins except BATF1. B.R. performed additional experiments on GLI1 and ZFP57, including fluorescence anisotropy. Y.K.C. performed Methyl-Spec-seq on BATF1. D.G. developed software for Meth-ePWMs and logos. G.D.S. supervised the overall work. Z.Z., B.R., and G.D.S. wrote the manuscript. Competing interests: The authors declare that they have no competing interests. Data and materials availability: All data needed to evaluate the conclusions in the paper are present in the paper and/or the Supplementary Materials. Additional data related to this paper may be requested from the authors. Raw reads for all of the Methyl-Spec-seq experiments, as well as tabulated results for each sequence variant, can be found in the National Center for Biotechnology Information short-read archive under accession codes GSE98686, GSE98669, GSE98542, and GSE102703. The plasmids for expressing each protein are available at http://addgene.org/Gary_Stormo/.
SUPPLEMENTARY MATERIALS
Supplementary material for this article is available at http://advances.sciencemag.org/cgi/content/full/3/11/eaao1799/DC1
fig. S1. General illustration of the use of M and W nomenclature to represent methylated bases in a DNA sequence.
fig. S2. Methyl-Spec-seq ePWMs.
fig. S3. Replicates of FAM and TAMRA anisotropy signals that were used to calculate the effect of mC on the relative binding specificity of ZFP57.
fig. S4. The relative binding energies of all 64 variants (AP1 libraries) with different methylation profiles, ranked from the strongest (lowest energy) to the weakest binder of the unmethylated library.
fig. S5. Replicate experiments with HOXB13.
fig. S6. EMSA sample images for mouse ZFP57 (F1 to F3) and CTCF (F1 to F9).
fig. S7. EMSA sample images for Gli1, JunB/BATF, and HOXB13.
fig. S8. Schematic maps of plasmids used for cloning and expression of proteins.
text S1. DNA oligo sequences for primers and libraries.
text S2. Instructions for software use.
REFERENCES AND NOTES
- 1.Schübeler D., Function and information content of DNA methylation. Nature 517, 321–326 (2015). [DOI] [PubMed] [Google Scholar]
- 2.Suzuki M. M., Bird A., DNA methylation landscapes: Provocative insights from epigenomics. Nat. Rev. Genet. 9, 465–476 (2008). [DOI] [PubMed] [Google Scholar]
- 3.Hughes T. R., Lambert S. A., Transcription factors read epigenetics. Science 356, 489–490 (2017). [DOI] [PubMed] [Google Scholar]
- 4.Dantas Machado A. C., Zhou T., Rao S., Goel P., Rastogi C., Lazarovici A., Bussemaker H. J., Rohs R., Evolving insights on how cytosine methylation affects protein-DNA binding. Brief. Funct. Genomics 14, 61–73 (2015). [DOI] [PMC free article] [PubMed] [Google Scholar]
- 5.Gutierrez-Arcelus M., Lappalainen T., Montgomery S. B., Buil A., Ongen H., Yurovsky A., Bryois J., Giger T., Romano L., Planchon A., Falconnet E., Bielser D., Gagnebin M., Padioleau I., Borel C., Letourneau A., Makrythanasis P., Guipponi M., Gehrig C., Antonarakis S. E., Dermitzakis E. T., Passive and active DNA methylation and the interplay with genetic variation in gene regulation. eLife 2, e00523 (2013). [DOI] [PMC free article] [PubMed] [Google Scholar]
- 6.Zhu H., Wang G., Qian J., Transcription factors as readers and effectors of DNA methylation. Nat. Rev. Genet. 17, 551–565 (2016). [DOI] [PMC free article] [PubMed] [Google Scholar]
- 7.Muers M., Gene expression: Disentangling DNA methylation. Nat. Rev. Genet. 14, 519 (2013). [DOI] [PubMed] [Google Scholar]
- 8.Yin Y., Morgunova E., Jolma A., Kaasinen E., Sahu B., Khund-Sayeed S., Das P. K., Kivioja T., Dave K., Zhong F., Nitta K. R., Taipale M., Popov A., Ginno P. A., Domcke S., Yan J., Schübeler D., Vinson C., Taipale J., Impact of cytosine methylation on DNA binding specificities of human transcription factors. Science 356, eaaj2239 (2017). [DOI] [PMC free article] [PubMed] [Google Scholar]
- 9.Weirauch M. T., Yang A., Albu M., Cote A. G., Montenegro-Montero A., Drewe P., Najafabadi H. S., Lambert S. A., Mann I., Cook K., Zheng H., Goity A., van Bakel H., Lozano J.-C., Galli M., Lewsey M. G., Huang E., Mukherjee T., Chen X., Reece-Hoyes J. S., Govindarajan S., Shaulsky G., Walhout A. J. M., Bouget F.-Y., Ratsch G., Larrondo L. F., Ecker J. R., Hughes T. R., Determination and inference of eukaryotic transcription factor sequence specificity. Cell 158, 1431–1443 (2014). [DOI] [PMC free article] [PubMed] [Google Scholar]
- 10.Kribelbauer J. F., Laptenko O., Chen S., Martini G. D., Freed-Pastor W. A., Prives C., Mann R. S., Bussemaker H. J., Quantitative analysis of the DNA methylation sensitivity of transcription factor complexes. Cell Rep. 19, 2383–2395 (2017). [DOI] [PMC free article] [PubMed] [Google Scholar]
- 11.Stormo G. D., Zuo Z., Chang Y. K., Spec-seq: Determining protein-DNA–binding specificity by sequencing. Brief. Funct. Genomics 14, 30–38 (2015). [DOI] [PMC free article] [PubMed] [Google Scholar]
- 12.Zuo Z., Stormo G. D., High-resolution specificity from DNA sequencing highlights alternative modes of Lac repressor binding. Genetics 198, 1329–1343 (2014). [DOI] [PMC free article] [PubMed] [Google Scholar]
- 13.Li X., Ito M., Zhou F., Youngson N., Zuo X., Leder P., Ferguson-Smith A. C., A maternal-zygotic effect gene, Zfp57, maintains both maternal and paternal imprints. Dev. Cell 15, 547–557 (2008). [DOI] [PMC free article] [PubMed] [Google Scholar]
- 14.Strogantsev R., Krueger F., Yamazawa K., Shi H., Gould P., Goldman-Roberts M., McEwen K., Sun B., Pedersen R., Ferguson-Smith A. C., Allele-specific binding of ZFP57 in the epigenetic regulation of imprinted and non-imprinted monoallelic expression. Genome Biol. 16, 112 (2015). [DOI] [PMC free article] [PubMed] [Google Scholar]
- 15.Quenneville S., Verde G., Corsinotti A., Kapopoulou A., Jakobsson J., Offner S., Baglivo I., Pedone P. V., Grimaldi G., Riccio A., Trono D., In embryonic stem cells, ZFP57/KAP1 recognize a methylated hexanucleotide to affect chromatin and DNA methylation of imprinting control regions. Mol. Cell 44, 361–372 (2011). [DOI] [PMC free article] [PubMed] [Google Scholar]
- 16.Liu Y., Toh H., Sasaki H., Zhang X., Cheng X., An atomic model of Zfp57 recognition of CpG methylation within a specific DNA sequence. Genes Dev. 26, 2374–2379 (2012). [DOI] [PMC free article] [PubMed] [Google Scholar]
- 17.Mackay D. J. G., Callaway J. L. A., Marks S. M., White H. E., Acerini C. L., Boonen S. E., Dayanikli P., Firth H. V., Goodship J. A., Haemers A. P., Hahnemann J. M. D., Kordonouri O., Masoud A. F., Oestergaard E., Storr J., Ellard S., Hattersley A. T., Robinson D. O., Temple I. K., Hypomethylation of multiple imprinted loci in individuals with transient neonatal diabetes is associated with mutations in ZFP57. Nat. Genet. 40, 949–951 (2008). [DOI] [PubMed] [Google Scholar]
- 18.Foat B. C., Morozov A. V., Bussemaker H. J., Statistical mechanical modeling of genome-wide transcription factor occupancy data by MatrixREDUCE. Bioinformatics 22, e141–e149 (2006). [DOI] [PubMed] [Google Scholar]
- 19.Stormo G. D., Modeling the specificity of protein-DNA interactions. Quant. Biol. 1, 115–130 (2013). [DOI] [PMC free article] [PubMed] [Google Scholar]
- 20.Heyduk T., Ma Y., Tang H., Ebright R. H., Fluorescence anisotropy: Rapid, quantitative assay for protein-DNA and protein-protein interaction. Methods Enzymol. 274, 492–503 (1996). [DOI] [PubMed] [Google Scholar]
- 21.LeTilly V., Royer C. A., Fluorescence anisotropy assays implicate protein-protein interactions in regulating trp repressor DNA binding. Biochemistry 32, 7753–7758 (1993). [DOI] [PubMed] [Google Scholar]
- 22.Chattopadhyay A., Zandarashvili L., Luu R. H., Iwahara J., Thermodynamic additivity for impacts of base-pair substitutions on association of the Egr-1 zinc-finger protein with DNA. Biochemistry 55, 6467–6474 (2016). [DOI] [PMC free article] [PubMed] [Google Scholar]
- 23.Bell A. C., Felsenfeld G., Methylation of a CTCF-dependent boundary controls imprinted expression of the Igf2 gene. Nature 405, 482–485 (2000). [DOI] [PubMed] [Google Scholar]
- 24.Hark A. T., Schoenherr C. J., Katz D. J., Ingram R. S., Levorse J. M., Tilghman S. M., CTCF mediates methylation-sensitive enhancer-blocking activity at the H19/Igf2 locus. Nature 405, 486–489 (2000). [DOI] [PubMed] [Google Scholar]
- 25.Maurano M. T., Wang H., John S., Shafer A., Canfield T., Lee K., Stamatoyannopoulos J. A., Role of DNA methylation in modulating transcription factor occupancy. Cell Rep. 12, 1184–1195 (2015). [DOI] [PubMed] [Google Scholar]
- 26.Nakahashi H., Kieffer Kwon K.-R., Resch W., Vian L., Dose M., Stavreva D., Hakim O., Pruett N., Nelson S., Yamane A., Qian J., Dubois W., Welsh S., Phair R. D., Pugh B. F., Lobanenkov V., Hager G. L., Casellas R., A genome-wide map of CTCF multivalency redefines the CTCF code. Cell Rep. 3, 1678–1689 (2013). [DOI] [PMC free article] [PubMed] [Google Scholar]
- 27.Chang Y. K., Srivastava Y., Hu C., Joyce A., Yang X., Zuo Z., Havranek J. J., Stormo G. D., Jauch R., Quantitative profiling of selective Sox/POU pairing on hundreds of sequences in parallel by Coop-seq. Nucleic Acids Res. 45, 832–845 (2017). [DOI] [PMC free article] [PubMed] [Google Scholar]
- 28.Roy B., Zuo Z., Stormo G. D., Quantitative specificity of STAT1 and several variants. Nucleic Acids Res. 45, 8199–8207 (2017). [DOI] [PMC free article] [PubMed] [Google Scholar]
- 29.Sasse S. K., Zuo Z., Kadiyala V., Zhang L., Pufall M. A., Jain M. K., Phang T. L., Stormo G. D., Gerber A. N., Response element composition governs correlations between binding site affinity and transcription in glucocorticoid receptor feed-forward loops. J. Biol. Chem. 290, 19756–19769 (2015). [DOI] [PMC free article] [PubMed] [Google Scholar]
- 30.Zuo Z., Chang Y., Stormo G. D., A quantitative understanding of lac repressor’s binding specificity and flexibility. Quant. Biol. 3, 69–80 (2015). [DOI] [PMC free article] [PubMed] [Google Scholar]
- 31.Renda M., Baglivo I., Burgess-Beusse B., Esposito S., Fattorusso R., Felsenfeld G., Pedone P. V., Critical DNA binding interactions of the insulator protein CTCF: A small number of zinc fingers mediate strong binding, and a single finger-DNA interaction controls binding at imprinted loci. J. Biol. Chem. 282, 33336–33345 (2007). [DOI] [PubMed] [Google Scholar]
- 32.Schraml B. U., Hildner K., Ise W., Lee W.-L., Smith W. A.-E., Solomon B., Sahota G., Sim J., Mukasa R., Cemerski S., Hatton R. D., Stormo G. D., Weaver C. T., Russell J. H., Murphy T. L., Murphy K. M., The AP-1 transcription factor Batf controls TH17 differentiation. Nature 460, 405–409 (2009). [DOI] [PMC free article] [PubMed] [Google Scholar]
- 33.Glasmacher E., Agrawal S., Chang A. B., Murphy T. L., Zeng W., Vander Lugt B., Khan A. A., Ciofani M., Spooner C. J., Rutz S., Hackney J., Nurieva R., Escalante C. R., Ouyang W., Littman D. R., Murphy K. M., Singh H., A genomic regulatory element that directs assembly and function of immune-specific AP-1–IRF complexes. Science 338, 975–980 (2012). [DOI] [PMC free article] [PubMed] [Google Scholar]
- 34.Koebernick K., Pieler T., Gli-type zinc finger proteins as bipotential transducers of Hedgehog signaling. Differentiation 70, 69–76 (2002). [DOI] [PubMed] [Google Scholar]
- 35.Winklmayr M., Schmid C., Laner-Plamberger S., Kaser A., Aberger F., Eichberger T., Frischauf A.-M., Non-consensus GLI binding sites in Hedgehog target gene regulation. BMC Mol. Biol. 11, 2 (2010). [DOI] [PMC free article] [PubMed] [Google Scholar]
- 36.Kinzler K. W., Vogelstein B., The GLI gene encodes a nuclear protein which binds specific sequences in the human genome. Mol. Cell. Biol. 10, 634–642 (1990). [DOI] [PMC free article] [PubMed] [Google Scholar]
- 37.Pavletich N. P., Pabo C. O., Crystal structure of a five-finger GLI-DNA complex: New perspectives on zinc fingers. Science 261, 1701–1707 (1993). [DOI] [PubMed] [Google Scholar]
- 38.Ågren M., Kogerman P., Kleman M. I., Wessling M., Toftgård R., Expression of the PTCH1 tumor suppressor gene is regulated by alternative promoters and a single functional Gli-binding site. Gene 330, 101–114 (2004). [DOI] [PubMed] [Google Scholar]
- 39.Nitzki F., Tolosa E. J., Cuvelier N., Frommhold A., Salinas-Riester G., Johnsen S. A., Fernandez-Zapico M. E., Hahn H., Overexpression of mutant Ptch in rhabdomyosarcomas is associated with promoter hypomethylation and increased Gli1 and H3K4me3 occupancy. Oncotarget 6, 9113–9124 (2015). [DOI] [PMC free article] [PubMed] [Google Scholar]
- 40.Zuo Y., Song Y., Zhang M., Xu Z., Qian X., Role of PTCH1 gene methylation in gastric carcinogenesis. Oncol. Lett. 8, 679–682 (2014). [DOI] [PMC free article] [PubMed] [Google Scholar]
- 41.Economides K. D., Capecchi M. R., Hoxb13 is required for normal differentiation and secretory function of the ventral prostate. Development 130, 2061–2069 (2003). [DOI] [PubMed] [Google Scholar]
- 42.Javed S., Langley S. E. M., Importance of HOX genes in normal prostate gland formation, prostate cancer development and its early detection. BJU Int. 113, 535–540 (2014). [DOI] [PubMed] [Google Scholar]
- 43.Brechka H., Bhanvadia R. R., VanOpstall C., Vander Griend D. J., HOXB13 mutations and binding partners in prostate development and cancer: Function, clinical significance, and future directions. Genes Dis. 4, 75–87 (2017). [DOI] [PMC free article] [PubMed] [Google Scholar]
- 44.Hoffmann T. J., Sakoda L. C., Shen L., Jorgenson E., Habel L. A., Liu J., Kvale M. N., Asgari M. M., Banda Y., Corley D., Kushi L. H., Quesenberry C. P. Jr, Schaefer C., Van Den Eeden S. K., Risch N., Witte J. S., Imputation of the rare HOXB13 G84E mutation and cancer risk in a large population-based cohort. PLOS Genet. 11, e1004930 (2015). [DOI] [PMC free article] [PubMed] [Google Scholar]
- 45.Jolma A., Yan J., Whitington T., Toivonen J., Nitta K. R., Rastas P., Morgunova E., Enge M., Taipale M., Wei G., Palin K., Vaquerizas J. M., Vincentelli R., Luscombe N. M., Hughes T. R., Lemaire P., Ukkonen E., Kivioja T., Taipale J., DNA-binding specificities of human transcription factors. Cell 152, 327–339 (2013). [DOI] [PubMed] [Google Scholar]
- 46.Matsuo K., Silke J., Gramatikoff K., Schaffner W., The CpG-specific methylase Sssl has topoisomerase activity in the presence of Mg2+. Nucleic Acids Res. 22, 5354–5359 (1994). [DOI] [PMC free article] [PubMed] [Google Scholar]
- 47.J. R. Lakowicz, in Principles of Fluorescence Spectroscopy. (Springer, 1999), pp. 291–319. [Google Scholar]
Associated Data
This section collects any data citations, data availability statements, or supplementary materials included in this article.
Supplementary Materials
Supplementary material for this article is available at http://advances.sciencemag.org/cgi/content/full/3/11/eaao1799/DC1
fig. S1. General illustration of the use of M and W nomenclature to represent methylated bases in a DNA sequence.
fig. S2. Methyl-Spec-seq ePWMs.
fig. S3. Replicates of FAM and TAMRA anisotropy signals that were used to calculate the effect of mC on the relative binding specificity of ZFP57.
fig. S4. The relative binding energies of all 64 variants (AP1 libraries) with different methylation profiles, ranked from the strongest (lowest energy) to the weakest binder of the unmethylated library.
fig. S5. Replicate experiments with HOXB13.
fig. S6. EMSA sample images for mouse ZFP57 (F1 to F3) and CTCF (F1 to F9).
fig. S7. EMSA sample images for Gli1, JunB/BATF, and HOXB13.
fig. S8. Schematic maps of plasmids used for cloning and expression of proteins.
text S1. DNA oligo sequences for primers and libraries.
text S2. Instructions for software use.