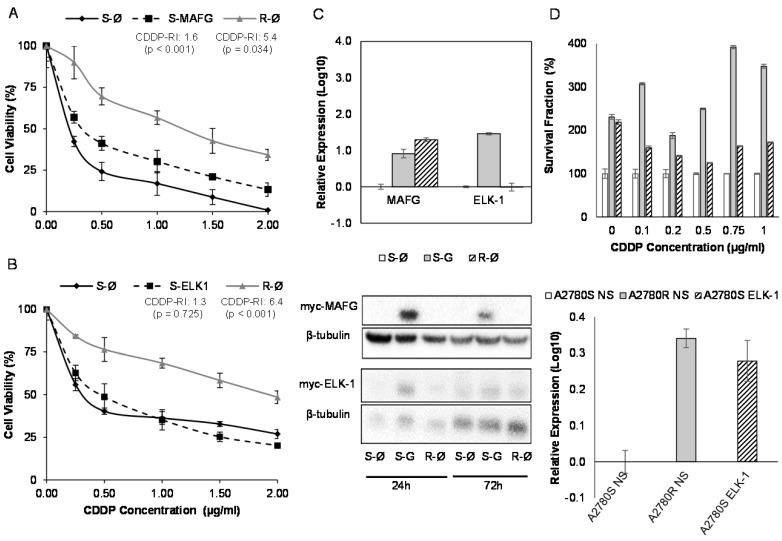
Figure 7.
Effect of overexpression of MAFG and ELK-1 on cell sensitivity to CDDP in A2780 cell lines. (A-B) Viability curves of A2780 cell lines transfected with pCMV6 (S-Ø and R-Ø) and with the overexpression vectors (S-MAFG and S-ELK-1). Each experimental group was exposed for 48 h to 6 different CDDP concentrations, and data were normalized to each untreated control, set to 100%. The data represent the mean ± SD of at least 3 independent experiments performed in quadruplicate at each drug concentration for each cell line analyzed. The CDDP-RI (Resistant Index to CDDP) was calculated as “IC50 from the R-Ø / IC50 from the S-Ø" and “IC50 from the S-transfected with the gene / IC50 from the S-Ø” ± SD. p<0.01 was considered as significant change in drug sensitivity (Student's t-test). (C) Validation of the transfection efficacy at mRNA and protein levels. Top, Relative expression levels of MAFG and ELK-1 measured by quantitative RT-PCR, in the cell line A2780, represented in Log10 scale; In each experimental group, the sensitive cell line transfected with pCMV6 plasmid was used as a calibrator. Each bar represents the combined relative expression of 2 independent experiments measured in triplicate. Bottom, total cell protein (20µg) at 24 and 72 hours was subjected to WB, membranes were hybridized with antibodies against c-Myc and β-tubulin as loading control. S: Sensitive; S-G: Sensitive transfected with the gene; R: Resistant; β-tub: β-tubulin. (D) Stable overexpression of ELK-1 in A2780S cell line. Top, Viability assay after the nonsilencing (NS) plasmid transductions (S-NS white; R-NS stripped) and overexpressing ELK-1 plasmid (S-ELK-1 grey). Each experimental group was exposed for 72 h to 6 different CDDP concentrations, and data were normalized to each sensitive subtype. Data represents the mean ± SD of at least 3 independent experiments performed with 4 wells at each drug concentration for each cell line analyzed. Bottom, relative ELK-1 expression levels measured by qRT-PCR and represented in Log10 scale. The sensitive cell line with nonsilencing vector was used as a calibrator. Each bar represents the combined relative expression of 2 independent experiments measured in triplicate.

