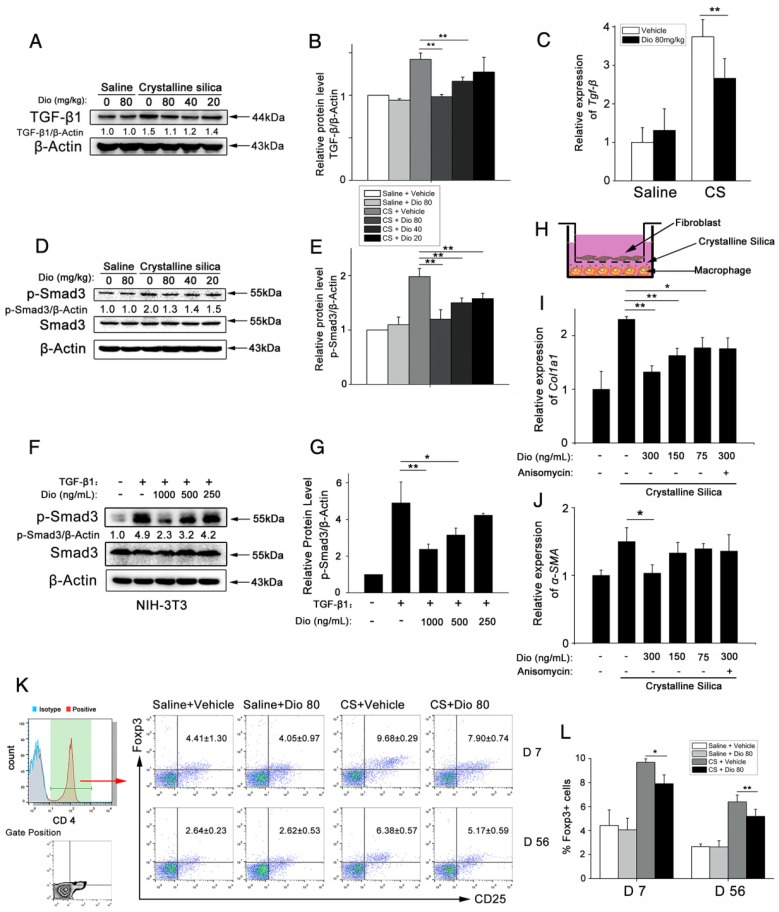
Figure 8.
Dioscin regulated the TGF-β1-Samd3 signaling pathway and regulatory T cell functions. (A, B) Western blot analysis and quantification of TGF-β1 in lungs of dioscin-treated mice at 56 d (n=3). β-Actin was used as the loading control. Quantification of TGF-β1 levels relative to β-Actin is shown below the band. (C) qPCR analysis of Tgf-β1 in the lung tissues (n=6-8 per group). *, P<0.05; **, P<0.01. Error bars indicate the mean ± SD. The experiment was performed in triplicate. (D, E) Western blot analysis and quantification of Smad3 signaling in the lungs of treated mice at 56 d (n=3). β-Actin was used as the loading control. Quantification of p-Smad3 levels relative to β-Actin is shown below the band. (F, G) Western blot analysis of p-Smad3 and Smad3 in NIH-3T3 fibroblast, 30 min after TGF-β1 (5 ng/mL) and dioscin treatment. Quantification of p-Smad3 levels relative to β-Actin is shown below the band. (H) Schematic design of transwell experiment: RAW 264.7 macrophages were primed by LPS (25 ng/mL) for 3 h, and then treated with CS (50 μg/cm2) together with dioscin or anisomycin (2 ng/mL) for 24 h in the lower plate, while NIH-3T3 fibroblasts were attached in the upper chamber. After that, the upper chamber was inserted back to the lower plate, and macrophages and fibroblasts were co-cultured for another 24 h. Then, the mRNA expressions of Col1a1 (I) and α-SMA (J) in NIH-3T3 fibroblast were determined by qPCR (n=3). (K, L) Percentage of CD4+CD25+FoxP3+ cells (regulatory T cells) in hilar lymph nodes was assayed by FACS analysis (n=5). *, P<0.05; **, P<0.01. Error bars indicate the mean ± SD.

