

Abstract
Surface water from 38 streams nationwide was assessed using 14 target-organic methods (719 compounds). Designed-bioactive anthropogenic contaminants (biocides, pharmaceuticals) comprised 57% of 406 organics detected at least once. The 10 most-frequently detected anthropogenic-organics included 8 pesticides (desulfinylfipronil, AMPA, chlorpyrifos, dieldrin, metolachlor, atrazine, CIAT, glyphosate) and 2 pharmaceuticals (caffeine, metformin) with detection frequencies ranging 66–84% of all sites. Detected contaminant concentrations varied from less than 1 ng L−1 to greater than 10 μg L−1, with 77 and 278 having median detected concentrations greater than 100 ng L−1 and 10 ng L−1, respectively. Cumulative detections and concentrations ranged 4-161 compounds (median 70) and 8.5–102,847 ng L−1, respectively, and correlated significantly with wastewater discharge, watershed development, and Toxic Release Inventory metrics. Log10 concentrations of widely monitored HHCB, triclosan, and carbamazepine explained 71%–82% of the variability in the total number of compounds detected (linear regression; p-values: <0.001–0.012), providing a statistical inference tool for unmonitored contaminants. Due to multiple modes of action, high bioactivity, biorecalcitrance, and direct environment application (pesticides), designed-bioactive organics (median 41 per site at μg L−1 cumulative concentrations) in developed watersheds present aquatic health concerns, given their acknowledged potential for sub-lethal effects to sensitive species and lifecycle stages at low ng L−1.
Keywords: Surface water, organic contaminants, contaminant mixtures, pharmaceuticals, pesticides, USA, aquatic health
Toc Graphic
Introduction
Chemical-mixture exposures in streams are global concerns1, 2 and the lack of information on the composition and associated effects of real-world-mixture exposures are fundamental obstacles to aquatic-ecosystem risk assessment3–9. Comprehensive targeted-chemical surface-water assessments are expensive and, consequently, uncommon10, 11 despite the acknowledged importance of improved understanding of surface-water contaminant complexity2, 8, 12 and the direct influence of the scope of contaminant characterization on perceived risks to stream health2, 12. Combined approaches incorporating chemical and effects-based analyses simultaneously preserve targeted-chemical forensic capabilities, interrogate cumulative bio-activities at multiple molecular endpoints without prior knowledge of mixture composition, and promote technical improvement via cross-examination of respective results mismatches3, 8, 9, 11, 13–16. To that end, the U.S. Geological Survey (USGS) and U.S. Environmental Protection Agency (EPA) conducted an extensive, field-based, split-sample assessment of targeted-chemical composition (14 methods, 916 total analytes, 893 organic analytes) and cumulative biochemical activity of water samples from urban/agricultural-impacted streams across the United States (USA) during 2012–147. The results of the target-organic, contaminant-mixture exposure assessment are presented herein; split-sample biological-activity results are presented separately (e.g.,17). Candidate contaminant subsets for improved multi-residue chemical screening8 and potential land-use land-cover (LULC) predictors of surface-water organic-contaminant-mixture complexity (composition and concentrations) are also assessed, herein. Results of this overall effort are expected to yield insights into chemical mixtures present in a wide range of surface waters across the USA and their potential for eliciting adverse ecological health consequences.
Material and Methods
Site Selection
Thirty-four urban/agricultural-impacted sites and 4 undeveloped sites spanning 24 States and Puerto Rico (Figure 1, Table S1) were selected based on data from more than a thousand stream sites assessed in previous USGS studies of contaminants of emerging environmental concern7. Upstream drainage areas and population densities ranged 12 to 16,000 km2 and 0 to 1,200 people per km2, respectively7, 18. Site selection and sample collection timing focused on capturing a range of mixed-contaminant exposure profiles; no effort was made to address site-specific temporal variability or to target high-impact contamination events, such as seasonal pesticide application windows.
Figure 1.
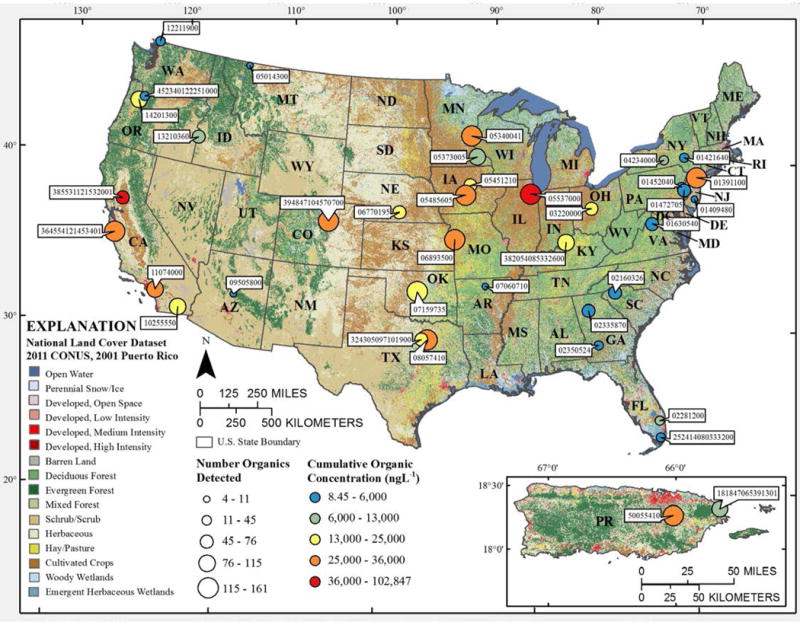
Total numbers and cumulative concentrations (ng L−1) of organic analytes detected in water during 2012–2014 sampling of 38 stream sites (Table S1) across the nation. Numeric labels indicate USGS NWIS92 stream station IDs.
Sampling Methods
Water samples were collected once from each stream during November 2012 to June 2014. Sampling protocols, bottles, preservation supplies, pre-printed laboratory request and chain of custody forms, shipping labels, and cooler packing diagrams were provided to each sampling team, to ensure consistency in sampling methods. Grab samples were collected (approximately 1h total sampling time) from the center of flow at each site by USGS staff using established trace-level protocols19–23. Water samples were homogenized in Teflon churns, decanted into individual containers, and shipped over night on ice to USGS and EPA laboratories for analysis. Complete sampling details are provided elsewhere18.
Water Chemistry Assessment
Surface-water samples were analyzed using 14 methods for a total of 893 targeted organic analytes (719 non-redundant) at 3 USGS laboratories: National Water Quality Laboratory (NWQL), in Denver, Colorado (volatile organic compounds24; steroid hormones and related compounds25; wastewater indicator compounds26, 27; human-use pharmaceuticals, pharmaceutical metabolites, and polar organic compounds28; pesticides and pesticide metabolites29–31; and halogenated organic compounds18); Organic Geochemistry Research Laboratory (OGRL), in Lawrence, Kansas (acetamide herbicides and degradation products32; glyphosate, glufosinate, and aminomethylphosphonic acid33; steroid hormones and phytoestrogens34; triazine and phenylurea herbicides35; and antibiotics33); and Organic Chemistry Research Laboratory (OCRL), in Sacramento, California (pesticide and pesticide degradates36; diuron, diuron degradates, and neonicotinoid insecticides37; and disinfection by-products38). This study included filtered and unfiltered sample methods, as noted in Table S3. Method details and complete results are provided at18, 39, 40.
Quality Assurance Quality Control (QAQC)
Field blanks and matrix spikes were completed at 15 and 13 sites, respectively, with 2–8 field blanks and 3–4 matrix spikes per method18. Nine organics were detected (once each) in both blank and environmental samples. Because the median sample concentration exceeded the blank concentration, data for 7 of these are presented without censoring (Table S2); interpretation of environmental results below blank detection levels warrants caution. Because blank concentrations exceeded the median sample concentrations, hexachlorobenzene and pentachloroanisole data were censored to nondetect for this publication (Table S2). QAQC details are provided elsewhere18.
Statistical Analyses
Laboratory-reporting levels (LRL) were determined for each analyte based on the long-term method detection level (MDL)41, 42. Detections between the LRL and MDL are confirmed identifications but considered semi-quantitative (estimated)41. Results below the MDL were reported as censored (< LRL)41; censored data were set to half the LRL and estimated values were used as reported, for statistical analyses.
Site groupings with statistically distinct contaminant profiles were identified by unconstrained divisive cluster analysis (UncTree) of 4th-root-transformed data and statistical-significance testing (SimProf; α = 0.05) routines of Primer 7 (PRIMER-E Ltd., Plymouth, UK43–45). Statistical relations between Euclidean-distance-resemblance matrices for detected-contaminant and LULC were assessed by permutation-based, non-parametric, multi-variate analysis (Primer 7)43–45. Resemblance matrices were calculated on log-transformed and normalized data to address method-related differences in reporting units and, thus, censoring levels43–45. Non-metric multi-dimensional scaling (NMDS), one-way analysis of similarity (ANOSIM), and permutation-based cophenetic correlation (RELATE, permutations = 999) routines (Primer 7)45 were used to explore relationships between site-specific detected-contaminant and LULC resemblance matrices. Subsequently, correlations between site-specific summary contaminant metrics (cumulative, maximum, and median concentrations/detections) and individual LULC metrics, as well as individual contaminant metrics, were assessed by Spearman Rank Correlation (SigmaPlot 13, Systat Software, San Jose, CA).
Results and Discussion
Building on prior studies largely in Europe (see for overview46), in 1999–2000 the USGS Toxics program surveyed 139 stream sites across the USA using 5 target-organic-chemical methods (95 total organic waste analytes; geospatial-chemical space of 13k cells)10; this study established the ubiquity and corresponding geospatial importance of organic contaminants of emerging concern as potential drivers of aquatic-ecosystem and downstream human health in the USA47. The Kolpin et al. study10 also provided one of the earliest glimpses into the complexity of surface-water organic-contaminant mixtures, despite the fact that comprehensive chemical characterization was not a study objective and methods for some well-established environmental-contaminant classes (e.g., pesticides and VOC) were not included.
In 2012–2014 the USGS and EPA conducted a follow-up survey of surface-water samples from 38 streams across the nation employing a substantially expanded target-organic-analysis toolbox (14 chemical methods covering 719 unique compounds; a two-fold increase in geospatial-chemical space to 27k cells), to more realistically characterize surface-water bioactive-contaminant space (contaminant-mixture complexity). Complementary biological-effects assays were employed to link chemical exposures with the potential for associated stream-ecosystem health effects. The current results represent one of the most comprehensive quantitative target-organic-contaminant assessments conducted to date, particularly with respect to polar organics (see 48 for regional semi-volatile organic compound analysis approach), and, to our knowledge, the most comprehensive national/regional-scale investigation involving split-sample chemical/effects-based analyses (see for comparison: 42 sites in 37 drainage basins and 33 target organic49; 18 Great Lakes Basin sites and 132 target organics11, 13, 50; 9 sites, 3 streams and 405 target organics51). The national-scale urban/agricultural-development gradient provides a unique opportunity to assess the scope and occurrence frequency of in-stream contaminants, the range and site-to-site variability of in-stream-contaminant complexity, and the associated relation to readily available, watershed-scale LULC metrics.
Hundreds of bioactive contaminants detected in US streams
Accounting for method overlap, the 893 organic-chemical analytes targeted in this study corresponded to 719 unique organic compounds (Table S3). This exceeds the number of contaminant classes (e.g., 433 pesticide and degradates12, 107 pharmaceuticals52) or total analytes (e.g., 95-405 mixed, polar-organic contaminants in1, 2, 10, 13, 50, 51, 53–55) assessed quantitatively in previous target-chemical-based, regional/national investigations. Approximately 57% of these unique organics (406/719) were detected at least once across all sites (Figures 1–3, Table S3). Bioactive-anthropogenic-organic compounds (biocides [pesticides and antimicrobials] and pharmaceuticals) comprised 55% of the targeted organic analytes and 57% of those detected at least once in this study. The following discussion of frequently detected anthropogenic-organic contaminants excludes naturally-occurring sterols (cholesterol, coprastanol, B-sitosterol, etc), which are not uniquely associated with contamination.
Figure 3.
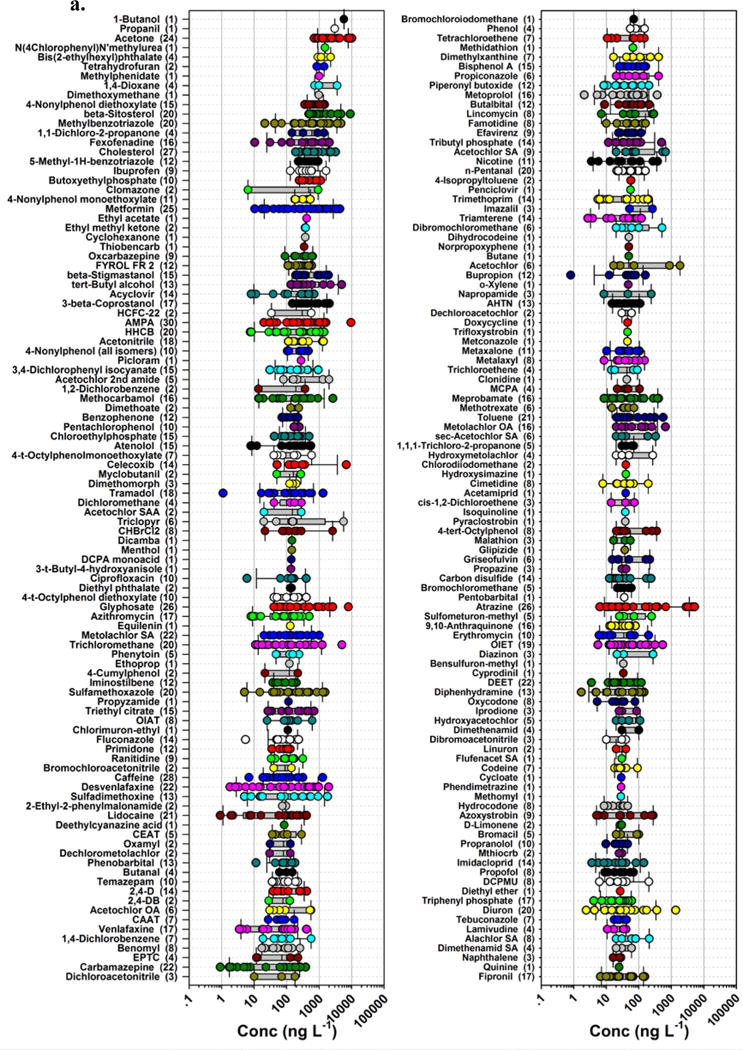
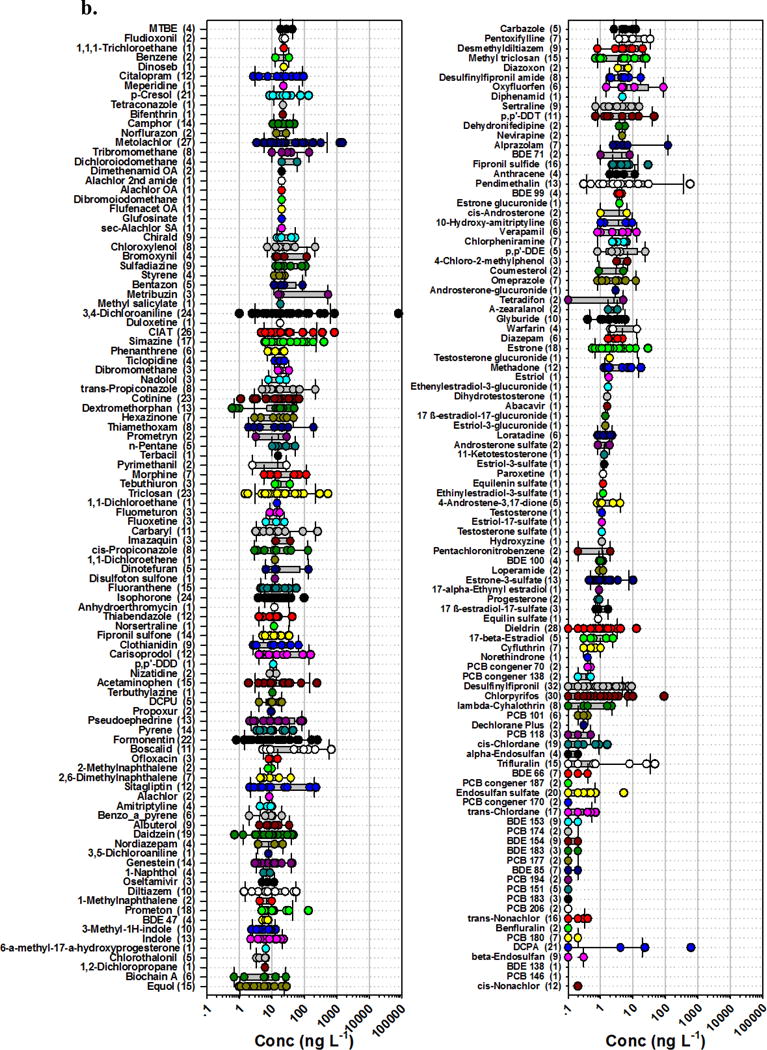
Detected concentrations (circles, ng L−1) and number of sites (in parentheses) for 389 organic analytes (in order of decreasing median detected concentration, top to bottom left to right: 3a. 1–200; 3b. 201–389) in water samples during 2012–2014 sampling of 38 streams across the nation. Circles are data for individual samples. Boxes, centerlines, and whiskers indicate interquartile range, median, and 5th and 95th percentiles, respectively.
The 10 most frequently detected anthropogenic-organic contaminants (not including cholesterol) were all designed-bioactive chemicals (Figure 3; Table 3). Eight were pesticides or pesticide degradates (desulfinylfipronil, AMPA [α-amino-3-hydroxy-5-methyl-4-isoxazolepropionic acid], chlorpyrifos, dieldrin, metolachlor, atrazine, CIAT [deethyl atrazine], glyphosate), with detection frequencies ranging from 26–32 sites. Desulfinylfipronil (fipronil-insecticide degradate) was pervasive, occurring at 32 sites (84%). The broad-spectrum herbicide, glyphosate, or its common environmental degradate, AMPA (also potential organophosphonate degradate56, 57), was detected at 30 sites (79%). Likewise, the broad-spectrum herbicide, atrazine, or its environmental degradate, CIAT, was detected at 27 sites (71%). The remaining two were caffeine (28 sites, 74%) and the anti-diabetic medication, metformin (25 sites, 66%). High detection frequencies for caffeine and metformin in this study are consistent with but notably lower than those (92% and 97% of sites, respectively) reported in a recent survey of pharmaceutical contaminants in 59 wadeable Piedmont streams of the southeastern USA52. Caffeine was the second most frequently detected compound (77.5% of samples) in a recent survey of 33 trace organic contaminants in 37 stream basins across the USA by Bernot et al.49; the most frequently detected contaminant, sucralose (87.5% of samples), in Bernot et al.49 was not assessed in the present study. Thirty compounds (not including cholesterol and β-sitosterol) were detected at more than 50% of the sites in the current study; of these, 21 (70%) had designed-bioactivities, including biocidal (13 pesticides or degradates), bacteriostatic (triclosan), and pharmacological (7 pharmaceuticals or metabolites/degradates) activities. Designed-bioactivity is emphasized here as a conservative indicator of ecosystem concern, because established predictive-ecotoxicology models (e.g., Structure Activity Relationship, Quantitative Structure Activity Relationship) assume a non-specific toxicity mode of action which can substantially underestimate molecularly-targeted toxicity and a range of ecologically relevant, sub-lethal effects58–61.
Concentrations of detected organic contaminants varied by more than 5 orders of magnitude from less than 1 ng L−1 up to greater than 10 μg L−1 (Figure 3, Table S3). The highest detected concentration by far was the greater than 80 μg L−1 of 3,4-dichloroaniline in the sample from Sycamore Slough CA. Although 3,4-dichloroaniline has number of potential agricultural62 and industrial63 sources, in this setting it is most readily attributed to environmental degradation of propanil, a contact herbicide widely employed in rice agriculture in California’s Sacramento Valley and specifically in the Sycamore Slough watershed64, 65. Acetone and the glyphosate degradate, AMPA, were detected at maximum concentrations of approximately 10 μg L−1. Across all sites, 37 organic contaminants (not including cholesterol, 3β-coprostanol, β-sitosterol, β-stigmastanol) had maximum detected concentrations greater than 1 μg L−1, among which 20 were designed-bioactive contaminants including 10 pesticides or pesticide degradates (all herbicides or herbicide degradates) and 10 pharmaceuticals and metabolites.
In this study 6 organic contaminants had greater than 1 μg L−1 median detected concentrations, while 77 and 278 (not including cholesterol, 3β-coprostanol, β-sitosterol, β-stigmastanol) had median detected concentrations greater than 100 ng L−1 and 10 ng L−1, respectively. Designed-bioactive contaminants included 14 pesticides and 12 pharmaceuticals with median detected concentrations above 100 ng L−1 and 86 pesticides/pesticide degradates and 58 pharmaceuticals with median detected concentrations above 10 ng L−1. Detection of ng L−1 to μg L−1 concentrations of individual bioactive contaminants and frequent co-occurrence of multiple bioactive contaminants represent aquatic health concerns. Several of these contaminants are expected to elicit sub-lethal effects at low ng L−1 concentrations66–68 and many others remain largely uncharacterized regarding pathway-specific toxicities for sensitive species and lifecycle stages in biodiverse stream environments.
Extensive and complex surface-water organic-contaminant mixtures
Detected anthropogenic-organic contaminants were numerous, diverse, and ubiquitous in the 38 streams sampled across the USA (Figures 1–4; Tables S1 and S3). Cumulative (sum of detected organic contaminants) concentrations ranged 8.5–102,847 ng L−1 per site (Figures 1–2; Table S3). At least one unequivocally anthropogenic contaminant was detected at all 38 streams, including the four, targeted, undeveloped locations, with cumulative detections for all sites ranging 4–162 organic compounds/site and a median of 70 organic compounds/site (Figures 1–2).
Figure 4.
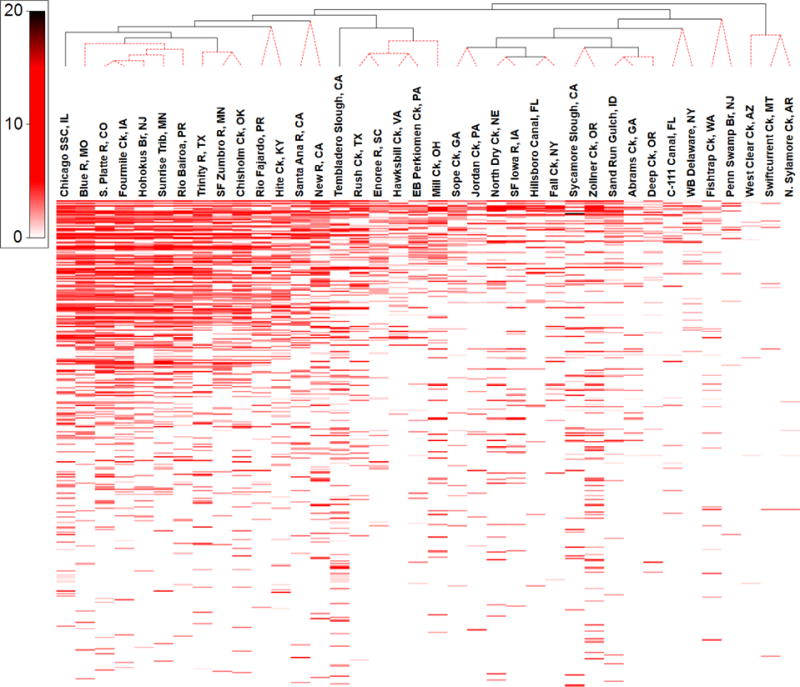
Shadeplot of concentrations (scale in μg L−1) of 406 detected organic analytes (unlabeled, top to bottom in order of decreasing median detected concentration) in water from 38 stream sites, clustered (UncTree) by mixture pattern. White indicates less than MDL (minimum detection limit). Dashed-red dendrogram lines indicate sites not statistically different (SimProf; α = 0.05).
Figure 2.
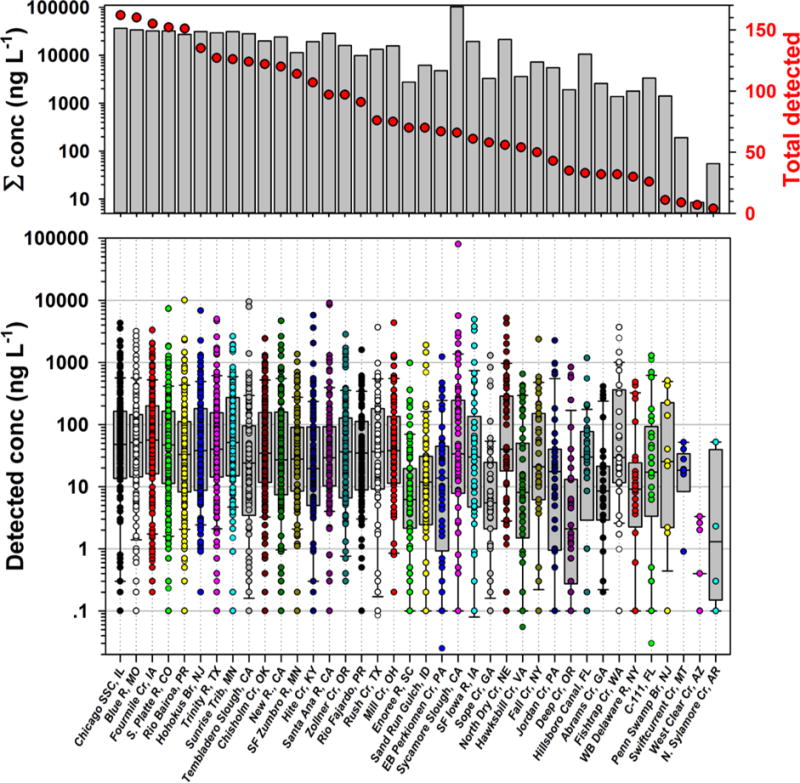
Top: Total numbers (red circles) and cumulative concentrations (ng L−1; bars) of organic analytes detected in water by site during 2012–2014 sampling of 38 streams across the nation. Bottom: Concentrations (ng L−1, circles) of individual organics detected. Boxes, centerlines, and whiskers indicate interquartile range, median, and 5th and 95th percentiles, respectively.
Samples collected from the 4 nominally-reference locations were characterized by the fewest detected analytes (Figures 1–2). Nevertheless, 27 organic compounds were detected at least once at these 4 sites, among which 19 were unequivocally anthropogenic (Table S3). Contaminant profiles for 3 sites (North Sylamore Creek, AR; Swiftcurrent Creek, MT; West Clear Creek, AZ) were statistically (α = 0.05) different from all other sites including Penn Swamp Branch, the fourth targeted undeveloped site (Figure 4). The human population in the 4 low-impact watersheds (Tables S5–6) ranged from 0 at Penn Swamp Branch, NJ and Swiftcurrent Creek, MT up to 80 at North Sylamore Creek, AR (Table S6). The cumulative detections and concentrations, respectively, of organic analytes ranged from 4 (North Sylamore Creek, AR) to 11 (Penn Swamp Branch, NJ) compounds/site and 55 (North Sylamore Creek, AR) to 1408 (Penn Swamp Branch, NJ) ng L−1. Penn Swamp Branch drains a wetland area characterized by high natural organic content with the lowest pH (4.18) and fourth highest dissolved organic carbon concentration (15.9 mg L−1) measured in this study; cholesterol and β-sitosterol comprised 66% of the cumulative concentration of detected organics at Penn Swamp Branch. Cumulative detections and concentrations, respectively, of anthropogenic-organic contaminants ranged from 4–6 compounds/site and 55–430 ng L−1. Among the 19 anthropogenic-organic contaminants detected at targeted undeveloped sites, 58% were designed-bioactives (6 pesticide/pesticide degradates and 5 pharmaceuticals), with cumulative detections and concentrations accounting for 27–50% of all compounds/site (median 38%) and 19–99% of the cumulative concentrations (median 76%), respectively. These results emphasize the environmental mobility, ubiquity, and, thus, potential concern of mixed, bioactive contaminants, in undeveloped and uninhabited watersheds.
The complexity and concentrations of organic contaminants detected in samples from the 34 urban/agricultural-impacted sites were up to 2 orders of magnitude greater than from undeveloped sites (Figures 1–4; Table S3). Cumulative detections and concentrations ranged 25–161 organic compounds/site and 1383–102847 ng L−1 per site. Median values for cumulative detections and concentrations of detected organics were 75 compounds/site and 15800 ng L−1, respectively, for the impacted sites, 1 and 2 orders of magnitude higher, respectively, than the 8 compounds/site and 123 ng L−1 median values for targeted, undeveloped locations (Figures 1–2; Table S3). Cumulative detections and concentrations of designed-bioactive contaminants ranged 5–86 compounds/site (median 40.5) and 151–90340 ng L−1 (median 6223 ng L−1), respectively, accounting for 20–69% of all compounds/site (median 50%) and 5–92% (median 35%) of the cumulative concentrations detected in samples from developed watersheds, respectively. Because anti-bacterial69, pharmaceutical70, 71, and pesticide70, 71 compounds are formulated to target modes of action, generally have high bioactivity, are biorecalcitrant, and have the potential to affect the entire foodweb (microorganisms, invertebrates, and vertebrates), multiple detections (median 41 per site) and μg L−1 cumulative concentrations in developed watersheds suggest the likelihood of complex interactive effects and the critical need to apply integrating (net) effects tools to evaluate risks posed by actual environmental mixtures.
Chemical predictors of overall contaminant-mixture complexity
The BEST BVSTEP model (termination criteria: ρ > 0.95, Δρ < 0.001; Primer 744, 45), with random start-variable selection, was used to identify combinations of the 55 most frequently detected contaminants that best explained the variability in the detected-contaminants resemblance matrix. Two potential screening subsets of 10-11 compounds each were identified: 1) azithromycin, fipronil, 2-methylnapthalene, dimethenamid SA, linuron, lambda-cyhalothrin, ethyl methyl ketone, 1,1-dichloropropane, dichloromethane, loratadine (ρ= 0.950); and 2) dimethomorph, napropamide, atrazine, estrone, AHTN, glyphosate, BDE153, PCB118, loratadine, methocarbamol, MTBE (ρ= 0.951).
Significant (operationally defined as n > 19; ρ > 0.5; p-value < 0.05) relations between site-specific summary metrics (cumulative detections, cumulative concentrations, maximum and median detected concentrations) and individual contaminant metrics also were explored using Spearman Rank Correlation (Table S4). A strong and highly significant (ρ = 0.865; p-value < 0.0001) correlation between cumulative detections and concentrations was observed; significant (p-value < 0.0001) but weaker (ρ = 0.694–0.716) correlations were observed for cumulative detects and maximum and median detected concentrations across all sites. Not including Sycamore Slough, a strong, highly significant linear relation (Pearson Correlation; adjusted-r2 = 0.821, p-value < 0.001) between cumulative detections and concentrations was observed (Figure 5), providing a useful predictive relationship and a means to identify outlying contaminant hot-spots/hot-events (e.g., 3,4-dichloroanaline in Sycamore Slough) that deviate substantially from the general trend.
Figure 5.
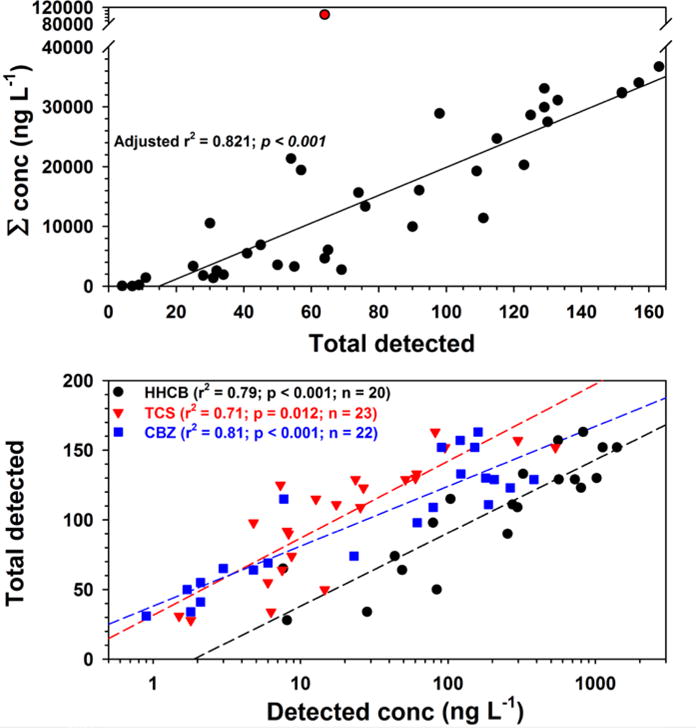
Top: Simple linear regression (line) of cumulative concentration and total number of detected organic analytes (black circles) in water from 37 streams across the nation (not including Sycamore Slough, red circle). Bottom: Simple linear regressions (lines) of total number of detected organic analytes and concentrations of HHCB (black circles), triclosan (TCS, red triangles), and carbamazepine (CBZ, blue squares).
Cumulative detections were significantly (n > 19; ρ > 0.5; p-value < 0.05) related to the concentrations of 14 individual contaminants (Table S4) including, most notably, HHCB (n = 20; ρ = 0.882), triclosan (n = 23; ρ = 0.871), carbamazepine (n = 22; ρ = 0.815), desvenlafaxine (n = 22; ρ = 0.762), and metformin (n = 25; ρ = 0.735), as well as (n = 20–32; ρ = 0.503–0.684) desulfinylfipronil, 3,4-dichloroaniline, acetone, cotinine, DEET, lidocaine, toluene, methyl-benzyltriazole, and sulfamethoxazole. Likewise, cumulative concentrations were significantly related to the concentrations of 16 individual contaminants including, most notably, HHCB (ρ = 0.780), triclosan (ρ = 0.772), carbamazepine (ρ = 0.757), methyl-benzyltriazole (ρ = 0.734), and metformin (ρ = 0.704), as well as (ρ = 0.538–0.673) AMPA, atrazine, CIAT, 3,4-dichloroaniline, acetone, isophorone, cotinine, DEET, desvenlafaxine, sulfamethoxazole, and tribromomethane. Statistically significant (p-value: <0.001–0.012) simple linear regressions indicated that individual concentrations of HHCB, triclosan, and carbamazepine in log10 space explained 71%–81% of the variability in the total number of detected compounds (Figure 5). These statistical relations provide a tool (within the defined 0.1–100000 ng L−1 and 719 compound target-chemical space) to infer the presence of unmonitored contaminants based on concentrations of 3 widely monitored and generally well-documented contaminants.
Significant LULC predictors of overall contaminant-mixture complexity
No significant relation between resemblance matrices for detected contaminants and all readily available LULC (Tables S5–S6) was detected (NMDS, ANOSIM, RELATE; Primer 743–45). However, significant (p-value = 0.001) but weak relations were identified between the detected-contaminant resemblance matrix and resemblance matrices for select subsets of LULC data including wastewater discharge (Global R = 0.334), EPA Toxic Release Inventory site (TRI; Global R = 0.334), and urban development classification (Global R = 0.334) metrics. Spearman Rank correlation (Table S7) identified significant (|ρ| > 0.5; p-value < 0.05) relations between detected-contaminant summary metrics and multiple LULC metrics related to wastewater discharge (ρ = 0.528–0.795; p-values < 0.001), population density/urban development (ρ = 0.509–0.668; p-values < 0.001), and TRI (ρ = 0.583; p-values < 0.0001). Among these metrics, the most strongly correlated to cumulative detections and concentrations were the number of major National Pollution Discharge Elimination System (NPDES) outfalls in the watershed (as defined in72; ρ = 0.795, p < 0.0001 and ρ = 0.656, p < 0.0001, respectively) and the Nationa Land Cover Database (NLCD) 200173 percent developed medium intensity in the watershed (ρ = 0.668, p < 0.0001 and ρ = 0.579, p < 0.0001, respectively), with TRI significantly correlated only to cumulative detected-organic contaminants. The results indicate LULC metrics are useful predictors of in-stream mixed-organic-contaminant complexity and, to a lesser extent, concentration.
Implications for ecosystem exposure effects
Based only on these target-organic results, the complexity and composition of contaminant mixtures are substantial environmental health concerns in streams across the USA. Although this study employed one of the most comprehensive targeted-analyte toolboxes currently available, particularly with respect to polar organics, 719 organic compounds is a fraction of the contaminant universe, estimated at more than 80000 parent compounds in current use74 and an incalculable chemical-space75 of potential metabolites and degradates76; logically, actual surface-water contaminant complexity and concentrations may substantially exceed the current observations. Nevertheless, the ng L−1 to μg L−1 concentrations of individual contaminants and multiple detections per site (median = 70) at cumulative concentrations up to more than 102 μg L−1 are substantial concerns in their own right, because adverse environmental impacts have been documented for individual designed-bioactive contaminants at low ng L−1 concentrations66 and interactive effects of contaminant mixtures are poorly understood and are global priorities76–79. Because results of direct assessments of exposure effects using multiple bioassay platforms are presented elsewhere17, only select results are discussed here to emphasize the aquatic-health implications across the aquatic foodweb.
Detection of 17 pharmaceuticals (11 antibiotics, 4 antivirals, 2 antifungals), 9 fungicides, and triclosan (bacteriostat with recognized antibiotic selection potential69) in this study with individual detection frequencies up to 53% and maximum concentrations up to 1.8 μg L−1 strongly suggests impacts at the microbial base of the aquatic foodweb in streams nationwide. Antibiotic-contaminant concentrations as low as 0.5 μg L−1 have been shown to affect the structure and composition of aquatic microbial communities80, 81. Individual detection frequencies (% of sites) and maximum and median detected concentrations for antibiotics alone ranged 3–53%, 12–1800 ng L−1, and 12–135 ng L−1, respectively, with multiple antibiotics (up to 8 per site) detected at 18 sites. Likewise, antibiotic-resistance selection is a global concern82 and sub-lethal selection of antibiotic-resistant bacteria has been documented at ciprofloxacin concentrations as low as 100 ng L−1 83. Ciprofloxacin was detected in this study at 26% of the sites, with maximum and median detected concentrations of 400 ng L−1 and 135 ng L−1, respectively. Triclosan was detected at 61% of sites, with maximum and median detected concentrations of 543 ng L−1 and 14.6 ng L−1, respectively.
Invertebrates comprise most animal biomass in aquatic ecosystems and the current results suggest substantial potential for adverse contaminant impacts. For example, the phenylpyrazole insecticide, fipronil, blocks GABA-gated chloride channels of insect central nervous systems leading to reduced reproduction and survival and at least two fipronil degradates (sulfide, sulfone) are reported to be more toxic to sensitive aquatic invertebrates than the parent compound68. In this national study, desulfinylfipronil, a fipronil degradate, was the most frequently detected contaminant (32 sites). Two or more fipronil-related compounds (fipronil, fipronyl sulfide, fipronil sulfone, desulfinylfipronil) were detected at 19 sites (50% of all sites; 56% of 34 impacted sites). The EPA Office of Pesticide Programs’ fipronil 21-day-chronic and acute benchmarks for invertebrates are 11 ng L−1 and 110 ng L−1, respectively84, but substantially lower acute endpoints (mean 96-h EC50) of 32.5 ng/L for fipronil and 7−10 ng/L for fipronil sulfide and fipronil sulfone have been reported for sensitive aquatic species68. Similarly, neonicotinoid insecticides can severely impair sensitive insect communities85 and imidacloprid and clothianidin were detected at 37% and 24% of sites, respectively, with maximum and median concentrations ranging 175–475 ng L−1 and 66–143 ng L−1, respectively. Acute and chronic ecological health thresholds below 200 ng L−1 and 35 ng L−1, respectively, have been recommended to protect aquatic invertebrate communities85. Lastly, histamines are neurotransmitters for many aquatic insects86 and exposure to approximately 2 μg L−1 fexofenadine has been shown to impair survival behavior (flight response) in damselfly (Zygoptera) species and result in bioconcentration up to 2000 times the dissolved concentration87. Multiple (fexofenadine, diphenhydramine, loratadine, hydroxyzine) antihistamines were detected in this study (16–42% of sites) at concentrations up to approximately 4 μg L−1. Fexofenadine was detected at 42% of sites, with maximum and median concentrations of 2047 ng L−1 and 576 ng L−1, respectively; two or more antihistamines were detected at 13 sites (34%).
Pharmaceutical results best illustrate the concerns raised in this study with respect to aquatic-vertebrate impacts, because fish are widely used animal models for pharmaceutical efficacy testing88, 89. Eighty-four pharmaceuticals were detected across all sites, with detection frequencies for individual compounds ranging 3–74% of sites (median 24%). Frequent detection of metformin (66% of sites) at median concentrations greater than 400 ng L−1, including 7 sites with concentrations in the μg L−1 range, is noteworthy, because metformin is a designed endocrine-active compound and effluent-equivalent metformin exposures in the μg L−1 range induce up-regulation of vitellogenin mRNA88, 89 and male intersex90 in fathead minnow (Pimephales). However, mixed pharmaceutical contamination was the norm in this study, with 0-61 pharmaceuticals detected per site (median 7.5 across all sites; median 12.5 for impacted sites) and cumulative concentrations ranging 0–9580 ng L−1 (median 327 ng L−1).
Understanding and mitigating the human and ecological health risks associated with chemical- and land-use practices require knowledge of environmental chemical mixtures. The results presented herein provide the most extensive, target-polar-organic-chemical characterization of the composition and concentrations of contaminant-mixture exposures in streams available to date and support cross-examination of split-sample effects results (presented separately) as well as subsequent methods development, prioritization of future ecotoxicological studies of chemical mixtures, and in-silico modeling of potential biological effects of multiple contaminants. Non-target screening of archived water samples, which has the potential to substantially expand the current contaminant profiles91, is ongoing.
Supplementary Material
Acknowledgments
This research was conducted and funded by the USGS Toxic Substances Hydrology Program. Any use of trade, firm, or product names is for descriptive purposes only and does not imply endorsement by the US Government.
Footnotes
Supporting Information Available
Data in this article are summarized in Supplemental Data Tables S1–S8 and at40. Complete primary data are downloadable at39, 92.
References
- 1.Schäfer RB, Kühn B, Malaj E, König A, Gergs R. Contribution of organic toxicants to multiple stress in river ecosystems. Freshwater Biol. 2016;61(12):2116–2128. [Google Scholar]
- 2.Malaj E, von der Ohe PC, Grote M, Kühne R, Mondy CP, Usseglio-Polatera P, Brack W, Schäfer RB. Organic chemicals jeopardize the health of freshwater ecosystems on the continental scale. Proc Natl Acad Sci. 2014;111(26):9549–9554. doi: 10.1073/pnas.1321082111. [DOI] [PMC free article] [PubMed] [Google Scholar]
- 3.Doyle E, Biales A, Focazio M, Griffin D, Loftin K, Wilson V. Effect-Based Screening Methods for Water Quality Characterization Will Augment Conventional Analyte-by-Analyte Chemical Methods in Research As Well As Regulatory Monitoring. Environ Sci Technol. 2014;49(24):13906–13907. doi: 10.1021/es5053254. [DOI] [PubMed] [Google Scholar]
- 4.Carlin DJ, Rider CV, Woychik R, Birnbaum LS. Unraveling the health effects of environmental mixtures: an NIEHS priority. Environ Health Perspect. 2013;121(1):a6–a8. doi: 10.1289/ehp.1206182. [DOI] [PMC free article] [PubMed] [Google Scholar]
- 5.Bright PR, Buxton HT, Balistrieri LS, Barber LB, Chapelle FH, Cross PC, Krabbenhoft DP, Plumlee GS, Sleeman JM, Tillitt DE, Toccalino P, Winton J. US Geological Survey environmental health science strategy: providing environmental health science for a changing world. US Geological Survey Circular 1383–E; 2013 [Google Scholar]
- 6.Boobis AR, Crofton KM, Heinemeyer G, Kleiner J, Lund BO, Meek MB, Olin S, Pavittranon S, Rodriguez C, Van Raaij M, Vickers C, Waight-Sharma N. Assessment of Combined Exposures to Multiple Chemicals. Report of a WHO/IPCS International Workshop on Aggregate/Cumulative Risk Assessment. 2009:83. [Google Scholar]
- 7.Buxton HT, Reilly TJ, Kuivila KM, Kolpin DW, Bradley P, Villeneuve D, Mills M. Chemical mixtures and environmental effects: a pilot study to assess ecological exposure and effects in streams. US Geological Survey Open-file Report 2015-1113. 2015:12. [Google Scholar]
- 8.Altenburger R, Ait-Aissa S, Antczak P, Backhaus T, Barceló D, Seiler T-B, Brion F, Busch W, Chipman K, de Alda ML. Future water quality monitoring—adapting tools to deal with mixtures of pollutants in water resource management. Sci Total Environ. 2015;512:540–551. doi: 10.1016/j.scitotenv.2014.12.057. [DOI] [PubMed] [Google Scholar]
- 9.Brack W, Ait-Aissa S, Burgess RM, Busch W, Creusot N, Di Paolo C, Escher BI, Hewitt LM, Hilscherova K, Hollender J. Effect-directed analysis supporting monitoring of aquatic environments—An in-depth overview. Sci Total Environ. 2016;544:1073–1118. doi: 10.1016/j.scitotenv.2015.11.102. [DOI] [PubMed] [Google Scholar]
- 10.Kolpin D, Furlong E, Meyer M, Thurman E, Zaugg S, Barber L, Buxton H. Pharmaceuticals, hormones and other organic wastewater contaminants in U.S. streams, 1999–2000: A national synthesis. Environ Sci Technol. 2002;36(6):1202–1211. doi: 10.1021/es011055j. [DOI] [PubMed] [Google Scholar]
- 11.Li S, Villeneuve DL, Berninger JP, Blackwell BR, Cavallin JE, Hughes MN, Jensen KM, Jorgenson Z, Kahl MD, Schroeder AL. An integrated approach for identifying priority contaminant in the Great Lakes Basin–Investigations in the Lower Green Bay/Fox River and Milwaukee Estuary areas of concern. Sci Total Environ. 2017;579:825–837. doi: 10.1016/j.scitotenv.2016.11.021. [DOI] [PMC free article] [PubMed] [Google Scholar]
- 12.Moschet C, Wittmer I, Simovic J, Junghans M, Piazzoli A, Singer H, Stamm C, Leu C, Hollender J. How a complete pesticide screening changes the assessment of surface water quality. Environ Sci Technol. 2014;48(10):5423–5432. doi: 10.1021/es500371t. [DOI] [PubMed] [Google Scholar]
- 13.Davis JM, Ekman DR, Teng Q, Ankley GT, Berninger JP, Cavallin JE, Jensen KM, Kahl MD, Schroeder AL, Villeneuve DL. Linking field-based metabolomics and chemical analyses to prioritize contaminants of emerging concern in the Great Lakes basin. Environ Toxicol Chem. 2016;35(10):2493–2502. doi: 10.1002/etc.3409. [DOI] [PubMed] [Google Scholar]
- 14.Ekman DR, Ankley GT, Blazer VS, Collette TW, Garcia-Reyero N, Iwanowicz LR, Jorgenson ZG, Lee KE, Mazik PM, Miller DH. Biological Effects–Based Tools for Monitoring Impacted Surface Waters in the Great Lakes: A Multiagency Program in Support of the Great Lakes Restoration Initiative. Environ Pract. 2013;15(04):409–426. [Google Scholar]
- 15.Smital T, Terzić S, Lončar J, Senta I, Žaja R, Popović M, Mikac I, Tollefsen K-E, Thomas KV, Ahel M. Prioritisation of organic contaminants in a river basin using chemical analyses and bioassays. Environ Sci Pollut Res. 2013;20(3):1384–1395. doi: 10.1007/s11356-012-1059-x. [DOI] [PubMed] [Google Scholar]
- 16.Brack W, Altenburger R, Schüürmann G, Krauss M, Herráez DL, van Gils J, Slobodnik J, Munthe J, Gawlik BM, van Wezel A. The SOLUTIONS project: challenges and responses for present and future emerging pollutants in land and water resources management. Sci Total Environ. 2015;503:22–31. doi: 10.1016/j.scitotenv.2014.05.143. [DOI] [PubMed] [Google Scholar]
- 17.Conley J, Evans N, Cardon M, Rosenblum L, Iwanowicz L, Hartig P, Schenck K, Bradley P, Wilson V. Occurrence and in vitro bioactivity of estrogen, androgen, and glucocorticoid compounds in a nationwide screen of United States stream waters. Environ Sci Technol. doi: 10.1021/acs.est.6b06515. In Press. [DOI] [PMC free article] [PubMed] [Google Scholar]
- 18.Romanok K, Reilly T, Barber L, Boone JS, Buxton HT, Foreman WT, Furlong ET, Hladik ML, Iwanowicz LR, Journey CA, Kolpin DW, Kuivila KM, Loftin K, Mills MA, Meyer MT, Orlando JL, Smalling KL, Villeneuve DL, Bradley PM. US Geological Survey Open-File Report 2017–1011. Reston, VA: 2017. Methods used for the Characterization of the Chemical Composition and Biological Activity of Environmental Waters throughout the United States, 2012–2014; p. 115. [Google Scholar]
- 19.Shelton LR, Capel PD. Guidelines for collecting and processing samples of stream bed sediment for analysis of trace elements and organic contaminants for the National Water-Quality Assessment Program. US Geological Survey Open-File Report 94-458. 1994:20. [Google Scholar]
- 20.Wilde F. National Field Manual for the Collection of Water-Quality Data Chapter A3 Cleaning of equipment for water sampling (ver 20) US Geological Survey Techniques of Water Resources Investigations Book 9 Handbooks for Water-Resources Investigations. 2004:83. [Google Scholar]
- 21.Wilde FD, Radtke DB. National field manual for the collection of water-quality data Chapter A6 Field measurements. US Geological Survey Techniques of Water-Resources Investigations, Book 9. Handbooks for Water-Resources Investigations. variously dated; p variously paged. [Google Scholar]
- 22.Hladik ML, Kuivila KM. Assessing the occurrence and distribution of pyrethroids in water and suspended sediments. J Agric Food Chem. 2009;57(19):9079–9085. doi: 10.1021/jf9020448. [DOI] [PubMed] [Google Scholar]
- 23.Radtke D. National Field Manual for the Collection of Water-Quality Data Chapter A8 Bottom-material samples. US Geological Survey Techniques of Water-Resources Investigations Book 9. Handbooks for Water-Resources Investigations. 2005:60. [Google Scholar]
- 24.Rose D, Sandstrom M, Murtagh L. Methods of the National Water Quality Laboratory Chapter B12 Determination of heat purgeable and ambient purgeable volatile organic compounds in water by gas chromatography/mass spectrometry. US Geological Survey Techniques and Methods. Book 5. Laboratory Analysis. 2016:61. [Google Scholar]
- 25.Foreman WT, Gray JL, ReVello RC, Lindley CE, Losche SA, Barber LB. Methods of the National Water Quality Laboratory Chapter B9 Determination of steroid hormones and related compounds in filtered and unfiltered water by solid-phase extraction, derivatization, and gas chromatography with tandem mass spectrometry. US Geological Survey Techniques and Methods. Book 5. Laboratory Analysis. 2012:118. [Google Scholar]
- 26.Zaugg SD, Smith SG, Schroeder MP. Methods of the National Water Quality Laboratory Chapter B4. Determination of Wastewater Compounds in Whole Water by Continuous Liquid-Liquid Extraction and Capillary-Column Gas Chromatography/Mass Spectrometry. US Geological Survey Techniques and Methods. Book 5. Laboratory Analysis. 2006:30. [Google Scholar]
- 27.Zaugg SD, Phillips P, Smith SG. Analysis of pharmaceutical and other organic wastewater compounds in filtered and unfiltered water samples by gas chromatography/mass spectrometry. US Geological Survey Open-File Report 2013-1297. 2014:24. [Google Scholar]
- 28.Furlong E, Noriega M, Kanagy C, Kanagy L, Coffey L, Burkhardt M. Methods of the National Water Quality Laboratory Chapter B10. Determination of human-use pharmaceuticals in filtered water by direct aqueous injection–high-performance liquid chromatography/tandem mass spectrometry. US Geological Survey Techniques and Methods. Book 5. Laboratory Analysis. 2014:49. [Google Scholar]
- 29.Zaugg S, Sandstrom M, Smith S, Fehlberg K. Determination of pesticides in water by C-18 solid phase extraction and capillary column gas chromatography/mass spectrometry with selected-ion monitoring. US Geological Survey Open File Report 95-181. 1995:59. [Google Scholar]
- 30.Furlong ET, Anderson BD, Werner SL, Soliven PP, Coffey LJ, Burkhardt MR. Methods of analysis by the US Geological Survey National Water Quality Laboratory; determination of pesticides in water by graphitized carbon-based solid-phase extraction and high-performance liquid chromatography/mass spectrometry. US Geological Survey Water-Resources Investigation Report 2001-4134. 2001:81. [Google Scholar]
- 31.Sandstrom MW, Kanagy LK, Anderson CA, Kanagy CJ. Methods of the National Water Quality Laboratory Chapter B11 Determination of pesticides and pesticide degradates in filtered water by direct aqueous-injection liquid chromatography-tandem mass spectrometry. US Geological Survey Techniques and Methods Book 5 Laboratory Analysis. 2016:73. [Google Scholar]
- 32.Lee E, Strahan A. Methods of analysis by the U.S. Geological Survey Organic Geochemistry Research Group-Determination of acetamide herbicides and their degradation products in water using online solid-phase extraction and high-performance liquid chromatography/mass spectrometry. U S Geological Survey Open-File Report 2003-173. 2003:17. [Google Scholar]
- 33.Meyer M, Loftin K, Hinshaw H, Dietz J, Scribner E. Chapter A10 Determination of glyphosate, its degradation product aminomethylphosphonic acid, and glufosinate, in water by isotope dilution and online solid-phase extraction and liquid chromatography/tandem mass spectrometry. US Geological Survey Techniques and Methods Book 5 Laboratory Analysis. 2009:32. [Google Scholar]
- 34.Yost EE, Meyer MT, Dietze JE, Williams CM, Worley-Davis L, Lee B, Kullman SW. Transport of steroid hormones, phytoestrogens, and estrogenic activity across a swine lagoon/sprayfield system. Environ Sci Technol. 2014;48(19):11600–11609. doi: 10.1021/es5025806. [DOI] [PMC free article] [PubMed] [Google Scholar]
- 35.Lee E, Strahan A, Thurman E. Methods of analysis by the U.S. Geological Survey Organic Geochemistry Research Group-Determination of triazine and phenylurea herbicides and their degradation products in water using solid-phase extraction and liquid chromatography/mass spectrometry. US Geological Survey Open-File Report 2002-436. 2002:19. [Google Scholar]
- 36.Hladik ML, Smalling KL, Kuivila KM. A Multi-residue Method for the Analysis of Pesticides and Pesticide Degradates in Water Using HLB Solid-phase Extraction and Gas Chromatography–Ion Trap Mass Spectrometry. Bull Environ Contam Toxicol. 2008;80(2):139–144. doi: 10.1007/s00128-007-9332-2. [DOI] [PubMed] [Google Scholar]
- 37.Hladik ML, Calhoun DL. Analysis of the herbicide diuron, three diuron degradates, and six neonicotinoid insecticides in water–method details and application to two Georgia streams. US Geological Survey Scientific Investigations Report 2012-5206. 2012:9. [Google Scholar]
- 38.Hladik ML, Focazio MJ, Engle M. Discharges of produced waters from oil and gas extraction via wastewater treatment plants are sources of disinfection by-products to receiving streams. Sci Total Environ. 2014;466:1085–1093. doi: 10.1016/j.scitotenv.2013.08.008. [DOI] [PubMed] [Google Scholar]
- 39.Romanok K, Bradley PM, Journey CA. Inorganic and organic concentration data collected from 38 streams in the United States, 2012-2014, with supporting data, as part of the Chemical Mixtures and Environmental Effects Pilot Study. US Geological Survey Data Release. 2017 https://doi.org/10.5066/F7GF0RPH.
- 40.Bradley PM, Journey CA, Romanok K, Reilly T. Targeted-Organic-Chemical Analysis Concentration Data for Surface-Water Samples Collected from 38 Stream Sites across the USA during 2012-2014. US Geological Survey Data Release. 2017 https://doi.org/10.5066/F70863G5.
- 41.Childress C, Foreman W, Conner B, Maloney T. New reporting procedures based on long-term method detection levels and some considerations for interpretations of water-quality data provided by the U.S. Geological Survey National Water Quality Laboratory. US Geological Survey Open-File Report 99-193. 1999:19. [Google Scholar]
- 42.U.S. Environmental Protection Agency. Guidelines establishing test procedures for the analysis of pollutants. U.S. Environmental Protection Agency; 2005. pp. 319–322. [Google Scholar]
- 43.Clarke K. Non-parametric multivariate analyses of changes in community structure. Aust J Ecol. 1993;18(1):117–143. [Google Scholar]
- 44.Clarke K, Gorley R. PRIMER v7, PRIMER-E: Plymouth Marine Laboratory. 2015 [Google Scholar]
- 45.Clarke K, Gorley R, Somerfield P, Warwick R. Change in marine communities: an approach to statistical analysis and interpretation, V7. 3rd. Primer-E, Ltd.; Plymouth, UK: 2014. p. 260. [Google Scholar]
- 46.Daughton C, Ternes T. Pharmaceuticals and personal care products in the environment: Agents of subtle change? Environ Health Perspect. 1999;107(6):907–938. doi: 10.1289/ehp.99107s6907. [DOI] [PMC free article] [PubMed] [Google Scholar]
- 47.Daughton CG. Pharmaceuticals and the Environment (PiE): Evolution and impact of the published literature revealed by bibliometric analysis. Sci Total Environ. 2016;562:391–426. doi: 10.1016/j.scitotenv.2016.03.109. [DOI] [PubMed] [Google Scholar]
- 48.Pitarch E, Cervera MI, Portolés T, Ibáñez M, Barreda M, Renau-Pruñonosa A, Morell I, López F, Albarrán F, Hernández F. Comprehensive monitoring of organic micro-pollutants in surface and groundwater in the surrounding of a solid-waste treatment plant of Castellón, Spain. Sci Total Environ. 2016;548:211–220. doi: 10.1016/j.scitotenv.2015.12.166. [DOI] [PubMed] [Google Scholar]
- 49.Bernot MJ, Becker JC, Doll J, Lauer TE. A national reconnaissance of trace organic compounds (TOCs) in United States lotic ecosystems. Sci Total Environ. 2016;572:422–433. doi: 10.1016/j.scitotenv.2016.08.060. [DOI] [PubMed] [Google Scholar]
- 50.Lee KE, Langer SK, Menheer MA, Foreman WT, Furlong ET, Smith SG. Chemicals of Emerging Concern in Water and Bottom Sediment in Great Lakes Areas of Concern, 2010 to 2011–Collection Methods, Analyses Methods, Quality Assurance, and Data. US Geological Survey Data Series 2012-723. 2012:26. [Google Scholar]
- 51.Loos R, Carvalho R, António DC, Comero S, Locoro G, Tavazzi S, Paracchini B, Ghiani M, Lettieri T, Blaha L, Jarosova B, Voorspoels S, Servaes K, Haglund P, Fick J, Lindberg RH, Schwesig D, Gawlik BM. EU-wide monitoring survey on emerging polar organic contaminants in wastewater treatment plant effluents. Water Res. 2013;47(17):6475–6487. doi: 10.1016/j.watres.2013.08.024. [DOI] [PubMed] [Google Scholar]
- 52.Bradley PM, Journey CA, Button DT, Carlisle DM, Clark JM, Mahler BJ, Nakagaki N, Qi SL, Waite IR, VanMetre PC. Metformin and Other Pharmaceuticals Widespread in Wadeable Streams of the Southeastern United States. Environ Sci Technol Lett. 2016;3(6):243–249. [Google Scholar]
- 53.Kong L, Kadokami K, Wang S, Duong HT, Chau HTC. Monitoring of 1300 organic micro-pollutants in surface waters from Tianjin, North China. Chemosphere. 2015;122:125–130. doi: 10.1016/j.chemosphere.2014.11.025. [DOI] [PubMed] [Google Scholar]
- 54.Neale PA, Munz NA, Aїt-Aїssa S, Altenburger R, Brion F, Busch W, Escher BI, Hilscherová K, Kienle C, Novák J. Integrating chemical analysis and bioanalysis to evaluate the contribution of wastewater effluent on the micropollutant burden in small streams. Sci Total Environ. 2017;576:785–795. doi: 10.1016/j.scitotenv.2016.10.141. [DOI] [PubMed] [Google Scholar]
- 55.Munz NA, Burdon FJ, de Zwart D, Junghans M, Melo L, Reyes M, Schönenberger U, Singer HP, Spycher B, Hollender J. Pesticides drive risk of micropollutants in wastewater-impacted streams during low flow conditions. Water Res. 2016;110:366–377. doi: 10.1016/j.watres.2016.11.001. [DOI] [PubMed] [Google Scholar]
- 56.Studnik H, Liebsch S, Forlani G, Wieczorek D, Kafarski P, Lipok J. Amino polyphosphonates–chemical features and practical uses, environmental durability and biodegradation. New Biotechnol. 2015;32(1):1–6. doi: 10.1016/j.nbt.2014.06.007. [DOI] [PubMed] [Google Scholar]
- 57.Botta F, Lavison G, Couturier G, Alliot F, Moreau-Guigon E, Fauchon N, Guery B, Chevreuil M, Blanchoud H. Transfer of glyphosate and its degradate AMPA to surface waters through urban sewerage systems. Chemosphere. 2009;77(1):133–139. doi: 10.1016/j.chemosphere.2009.05.008. [DOI] [PubMed] [Google Scholar]
- 58.Russom CL, Bradbury SP, Broderius SJ, Hammermeister DE, Drummond RA. Predicting modes of toxic action from chemical structure: acute toxicity in the fathead minnow (Pimephales promelas) Environ Toxicol Chem. 1997;16(5):948–967. doi: 10.1002/etc.2249. [DOI] [PubMed] [Google Scholar]
- 59.Veith GD, Call DJ, Brooke L. Structure-toxicity relationships for the fathead minnow, Pimephales promelas: Narcotic industrial chemicals. Can J Fish Aquat Sci. 1983;40(6):743–748. [Google Scholar]
- 60.Bradbury SP. Predicting modes of toxic action from chemical structure: an overview. SAR QSAR Environ Res. 1994;2(1–2):89–104. doi: 10.1080/10629369408028842. [DOI] [PubMed] [Google Scholar]
- 61.Könemann H. Quantitative structure-activity relationships in fish toxicity studies Part 1: Relationship for 50 industrial pollutants. Toxicology. 1981;19(3):209–221. doi: 10.1016/0300-483x(81)90130-x. [DOI] [PubMed] [Google Scholar]
- 62.Yuan Y, Zhang P, Schäffer A, Schmidt B. 3, 4-Dichloroaniline revisited: A study on the fate of the priority pollutant in a sediment-water system derived from a rice growing region in Italy. Sci Total Environ. 2017;574:1012–1020. doi: 10.1016/j.scitotenv.2016.09.099. [DOI] [PubMed] [Google Scholar]
- 63.Yao XF, Khan F, Pandey R, Pandey J, Mourant RG, Jain RK, Guo JH, Russell RJ, Oakeshott JG, Pandey G. Degradation of dichloroaniline isomers by a newly isolated strain, Bacillus megaterium IMT21. Microbiology. 2011;157(3):721–726. doi: 10.1099/mic.0.045393-0. [DOI] [PubMed] [Google Scholar]
- 64.Kanawi E, Van Scoy AR, Budd R, Tjeerdema RS. Environmental fate and ecotoxicology of propanil: a review. Toxicol Environ Chem. 2016;98(7):689–704. doi: 10.1007/978-1-4614-6470-9_3. [DOI] [PubMed] [Google Scholar]
- 65.DaSilva A. Review of the Environmental Fate and Use Patterns of Propanil in California. California Department of Pesticide Regulation; 2016. p. 18. [Google Scholar]
- 66.Kidd KA, Paterson MJ, Rennie MD, Podemski CL, Findlay DL, Blanchfield PJ, Liber K. Direct and indirect responses of a freshwater food web to a potent synthetic oestrogen. Philos Trans R Soc, B. 2014;369(1656):20130578. doi: 10.1098/rstb.2013.0578. [DOI] [PMC free article] [PubMed] [Google Scholar]
- 67.Kidd K, Blanchfield P, Mills K, Palance V, Evans R, Lazorchak J, Flick R. Collapse of a fish population after exposure to a synthetic estrogen. Proc Natl Acad Sci. 2007;104(21):8897–8901. doi: 10.1073/pnas.0609568104. [DOI] [PMC free article] [PubMed] [Google Scholar]
- 68.Weston DP, Lydy MJ. Toxicity of the insecticide fipronil and its degradates to benthic macroinvertebrates of urban streams. Environ Sci Technol. 2014;48(2):1290–1297. doi: 10.1021/es4045874. [DOI] [PubMed] [Google Scholar]
- 69.Halden RU. On the need and speed of regulating triclosan and triclocarban in the United States. Environ Sci Technol. 2014;48(7):3603–3611. doi: 10.1021/es500495p. [DOI] [PMC free article] [PubMed] [Google Scholar]
- 70.Pal A, Gin KY-H, Lin AY-C, Reinhard M. Impacts of emerging organic contaminants on freshwater resources: review of recent occurrences, sources, fate and effects. Sci Total Environ. 2010;408(24):6062–6069. doi: 10.1016/j.scitotenv.2010.09.026. [DOI] [PubMed] [Google Scholar]
- 71.Goulson D. Review: An overview of the environmental risks posed by neonicotinoid insecticides. J Appl Ecol. 2013;50(4):977–987. [Google Scholar]
- 72.Maupin MA, Ivahnenko T. Nutrient Loadings to Streams of the Continental United States from Municipal and Industrial Effluent1. J Am Water Resour Assoc. 2011;47(5):950–964. doi: 10.1111/j.1752-1688.2011.00576.x. [DOI] [PMC free article] [PubMed] [Google Scholar]
- 73.NLCD, National Land Coverage Data-2001. Multi-Resolution Land Characteristics Consortium (MRLC) 2001 [Google Scholar]
- 74.Monteiro SC, Boxall AB. Reviews of environmental contamination and toxicology. Springer; 2010. Occurrence and fate of human pharmaceuticals in the environment; pp. 53–154. [DOI] [PubMed] [Google Scholar]
- 75.Dobson CM. Chemical space and biology. Nature. 2004;432(7019):824–828. doi: 10.1038/nature03192. [DOI] [PubMed] [Google Scholar]
- 76.Vasquez M, Lambrianides A, Schneider M, Kümmerer K, Fatta-Kassinos D. Environmental side effects of pharmaceutical cocktails: What we know and what we should know. J Hazard Mater. 2014;279:169–189. doi: 10.1016/j.jhazmat.2014.06.069. [DOI] [PubMed] [Google Scholar]
- 77.Backhaus T, Faust M. Predictive environmental risk assessment of chemical mixtures: a conceptual framework. Environ Sci Technol. 2012;46(5):2564–2573. doi: 10.1021/es2034125. [DOI] [PubMed] [Google Scholar]
- 78.Orton F, Ermler S, Kugathas S, Rosivatz E, Scholze M, Kortenkamp A. Mixture effects at very low doses with combinations of anti-androgenic pesticides, antioxidants, industrial pollutant and chemicals used in personal care products. Toxicol Appl Pharmacol. 2014;278(3):201–208. doi: 10.1016/j.taap.2013.09.008. [DOI] [PubMed] [Google Scholar]
- 79.Løkke H, Ragas AM, Holmstrup M. Tools and perspectives for assessing chemical mixtures and multiple stressors. Toxicology. 2013;313(2):73–82. doi: 10.1016/j.tox.2012.11.009. [DOI] [PubMed] [Google Scholar]
- 80.Rosi-Marshall EJ, Kincaid DW, Bechtold HA, Royer TV, Rojas M, Kelly JJ. Pharmaceuticals suppress algal growth and microbial respiration and alter bacterial communities in stream biofilms. Ecol Appl. 2013;23(3):583–593. doi: 10.1890/12-0491.1. [DOI] [PubMed] [Google Scholar]
- 81.Quinlan EL, Nietch CT, Blocksom K, Lazorchak JM, Batt AL, Griffiths R, Klemm DJ. Temporal dynamics of periphyton exposed to tetracycline in stream mesocosms. Environ Sci Technol. 2011;45(24):10684–10690. doi: 10.1021/es202004k. [DOI] [PubMed] [Google Scholar]
- 82.Laxminarayan R, Duse A, Wattal C, Zaidi AK, Wertheim HF, Sumpradit N, Vlieghe E, Hara GL, Gould IM, Goossens H. Antibiotic resistance—the need for global solutions. Lancet Infect Dis. 2013;13(12):1057–1098. doi: 10.1016/S1473-3099(13)70318-9. [DOI] [PubMed] [Google Scholar]
- 83.Gullberg E, Cao S, Berg OG, Ilbäck C, Sandegren L, Hughes D, Andersson DI. Selection of Resistant Bacteria at Very Low Antibiotic Concentrations. PLoS Pathog. 2011;7(7):e1002158. doi: 10.1371/journal.ppat.1002158. [DOI] [PMC free article] [PubMed] [Google Scholar]
- 84.EPA Office of Pesticide Programs Aquatic Life Benchmarks for Pesticide Registration. https://www.epa.gov/pesticide-science-and-assessing-pesticide-risks/aquatic-life-benchmarks-pesticide-registration-benchmarks (Nov 5, 2016)
- 85.Morrissey CA, Mineau P, Devries JH, Sanchez-Bayo F, Liess M, Cavallaro MC, Liber K. Neonicotinoid contamination of global surface waters and associated risk to aquatic invertebrates: A review. Environ Int. 2015;74:291–303. doi: 10.1016/j.envint.2014.10.024. [DOI] [PubMed] [Google Scholar]
- 86.Rosi-Marshall EJ, Royer TV. Pharmaceutical compounds and ecosystem function: an emerging research challenge for aquatic ecologists. Ecosystems. 2012;15(6):867–880. [Google Scholar]
- 87.Jonsson M, Fick J, Klaminder J, Brodin T. Antihistamines and aquatic insects: bioconcentration and impacts on behavior in damselfly larvae (Zygoptera) Sci Total Environ. 2014;472:108–111. doi: 10.1016/j.scitotenv.2013.10.104. [DOI] [PubMed] [Google Scholar]
- 88.Elo B, Villano C, Govorko D, White L. Larval zebrafish as a model for glucose metabolism: expression of phosphoenolpyruvate carboxykinase as a marker for exposure to anti-diabetic compounds. J Mol Endocrinol. 2007;38(4):433–440. doi: 10.1677/JME-06-0037. [DOI] [PubMed] [Google Scholar]
- 89.Capiotti KM, Antonioli R, Junior, Kist LW, Bogo MR, Bonan CD, Da Silva RS. Persistent impaired glucose metabolism in a zebrafish hyperglycemia model. Comp Biochem Physiol B: Biochem Mol Biol. 2014;171:58–65. doi: 10.1016/j.cbpb.2014.03.005. [DOI] [PubMed] [Google Scholar]
- 90.Niemuth NJ, Jordan R, Crago J, Blanksma C, Johnson R, Klaper RD. Metformin exposure at environmentally relevant concentrations causes potential endocrine disruption in adult male fish. Environ Toxicol Chem. 2015;34(2):291–296. doi: 10.1002/etc.2793. [DOI] [PMC free article] [PubMed] [Google Scholar]
- 91.Schymanski EL, Singer HP, Slobodnik J, Ipolyi IM, Oswald P, Krauss M, Schulze T, Haglund P, Letzel T, Grosse S. Non-target screening with high-resolution mass spectrometry: critical review using a collaborative trial on water analysis. Anal Bioanal Chem. 2015;407(21):6237–6255. doi: 10.1007/s00216-015-8681-7. [DOI] [PubMed] [Google Scholar]
- 92.U.S. Geological Survey. National Water Information System: USGS Water Data for the Nation (NWIS) 2017 http://doi.org/10.5066/F7P55KJN. In.
Associated Data
This section collects any data citations, data availability statements, or supplementary materials included in this article.