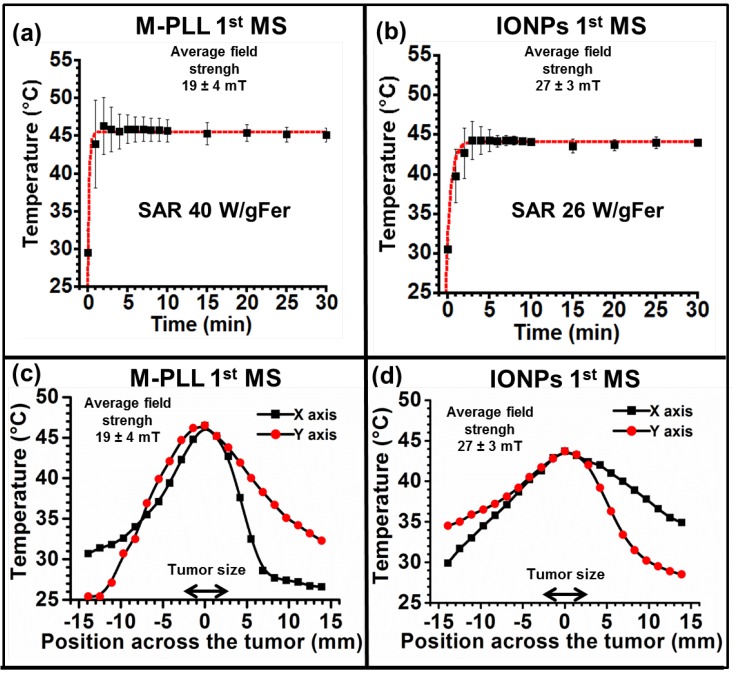
Figure 2.
Temperature increases, measured at tumor center with an optical fibre during the first MS for mice belonging to group 1, (a), or to group 3, (b). The error bar reflects temperature differences measured between the various mice. Spatial infrared temperature distribution, measured at the skin surface along the coil axis, X, or perpendicular to this axis, Y, with an infrared camera 10 minutes after the beginning of the first MS for mice belonging to group 1, (c), or for those belonging to group 3, (d).

