

Abstract
Aims
This study aimed to investigate the relationship between skeletal muscle mass and cardiac functional parameters in older adults during cardiopulmonary exercise testing (CPET).
Methods and results
Sixty‐three Japanese community‐dwelling older adults were enrolled (20 men and 43 women; mean age 80 years, range 65–97 years). Cardiac functional parameters during exercise were assessed using CPET. Skeletal muscle mass index (SMI) was calculated by dividing the appendicular lean mass (measured using dual‐energy X‐ray absorptiometry) by height in metres squared. Subjects were divided into two groups: men with SMI ≥ 7.0 kg/m2 and women with SMI ≥ 5.4 kg/m2 (non‐sarcopenic group); or men with SMI < 7.0 kg/m2 and women with SMI < 5.4 kg/m2 (sarcopenic group). There were significant positive correlations between SMI and peak oxygen uptake (VO2) (r = 0.631, P < 0.001), and between SMI and peak VO2/heart rate (HR) (r = 0.683, P < 0.001). However, only peak VO2/HR significantly differed between groups in both sexes. Multiple linear regression analyses with peak VO2/HR as a dependent variable showed that SMI was the only independent determinant after adjusting for potential confounders. After 4 month follow‐up of 47 participants, there was still a significant positive correlation between SMI and peak VO2/HR (r = 0.567, P < 0.001), and between percent change of SMI and percent change of peak VO2/HR (r = 0.305, P < 0.05).
Conclusions
Peak VO2/HR, an index of stroke volume at peak exercise, was associated with SMI. This indicates that skeletal muscle mass might affect cardiac function during exercise.
Keywords: Community‐dwelling older adults, Skeletal muscle mass index, Cardiopulmonary exercise testing, Peak oxygen pulse, Sarcopenia
Introduction
Sarcopenia, that is, age‐associated loss of muscle mass and strength, is highly prevalent in many ageing societies.1 It has received much clinical and research attention in recent years because of its association with significant morbidity and mortality. Indeed, sarcopenia has recently been shown to be strongly associated with increased mortality because of cardiovascular disease in community‐dwelling older adults,2 and with an unfavourable prognosis in patients with chronic heart failure (HF).3 Just like sarcopenia, chronic HF is highly prevalent and a major cause of death in ageing populations.4 Previous reports have suggested a relationship between skeletal muscle mass and HF, particularly among patients with HF with preserved ejection fraction (HFpEF).5 However, the clinical interrelationship between skeletal muscle mass and cardiac function remains to be insufficiently defined. This is particularly true in association with exercise. Therefore, it is of an importance in super‐ageing societies to better define the relationship between reduction in muscle mass and strength associated with sarcopenia and changes in cardiac function that are prevalent in patients with chronic HF. The aim of this study was to investigate the relationship between skeletal muscle mass and parameters of cardiac function in community‐dwelling older subjects.
Methods
Participants
Sixty‐three consecutive community‐dwelling older adults (20 men and 43 women) living in the Tokyo metropolitan area participated in this study. The mean age of subjects was 80 years (range 65–97 years). None of the subjects were currently hospitalized, but all were being treated on an outpatient basis at the Tokyo Metropolitan Geriatric Hospital and Institute of Gerontology.
Exclusion criteria were as follows: unable to walk independently and required nursing care, impaired vision, impaired hearing, musculoskeletal impairments that might interfere with the ability to perform the symptom‐limited exercise test, a clinically unstable condition, significant cognitive disorders and less than 64 years old. Potential participants that performed habitual exercise training were also excluded from the study. The clinical characteristics of the subjects are summarized in Table 1A. A follow‐up assessment was conducted with 47 participants 4 months after the baseline evaluation by using the methods and procedures similar to those used at the baseline.
Table 1A.
Clinical characteristics of the 63 chronically ill participants
| Participant characteristics | ||
|---|---|---|
| Male [n(%)] | 20(32%) | |
| Age [years; mean(range)] | 79(65–97) | |
| Male: 82(68–97) | ||
| Female: 79(65–93) | ||
| Physiological Assessment | Body mass index, kg/m2 | 22.2±3.5 |
| Male: 21.8±3.5 | ||
| Female: 22.4±3.5 | ||
| Brachial‐ankle pulse wave velocity, cm/min | 1881±445 | |
| Skeletal muscle mass index, kg/m2 | 5.98±0.9 | |
| Male: 6.3±1.1 | ||
| Female: 5.8±0.7 | ||
| Cardiopulmonary exercise test | Peak VO2, mL/min | 811±301 |
| Peak VO2/weight, mL/min/weight | 15.5±4.6 | |
| Peak VO2/heart rate, mL/beat | 6.9±2.3 | |
| Peak heart rate, bpm | 117±22 | |
| Peak watt | 63±25 | |
| Anaerobic threshold VO2, mL/min | 581±173 | |
| Anaerobic threshold VO2/weight, mL/min/weight | 11.1±2.8 | |
| Anaerobic threshold VO2 /heart rate, mL/beat | 5.9±1.7 | |
| Anaerobic threshold heart rate, bpm | 99±13 | |
| Anaerobic threshold watt | 38.1±14 | |
| ⊿VO2/⊿LOAD, mL/watt | 8.0±2.0 | |
| VE vs. VCO2 slope | 35.7±11.1 | |
| Type of illness [n(%)] | Hypertension | 36(57%) |
| Dyslipidemia | 28(44%) | |
| Diabetes mellitus | 19(30%) | |
| Coronary artery disease | 17(27%) | |
| Chronic heart failure | 9(14%) | |
| Atrial fibrillation | 8(13%) | |
| Drug [n(%)] | Calcium channel blocker | 25(39%) |
| Beta‐blocker | 20(30%) | |
| Angiotensin‐converting enzyme inhibitor | 14(22%) | |
VE vs. VCO2 slope, minute ventilation vs. carbon dioxide output slope; VO2, oxygen uptake.
Skeletal muscle mass index and body mass index
Appendicular skeletal muscle mass (ASM) was measured using total body dual‐energy X‐ray absorptiometry (DEXA, Lunar iDXA, GE Healthcare, Tokyo, Japan). Participants were positioned for whole‐body scans in accordance with the manufacturer's protocol. Participants lay in a supine position on the DEXA table with limbs close to the body. The whole‐body lean soft tissue mass was divided into several regions, that is, arms, legs, and the trunk. The sum of the muscle mass (lean soft tissue) of the four limbs was considered as ASM, and the skeletal muscle mass index (SMI) was calculated as ASM divided by the height in metres squared (kg/m2). Subjects were then divided into two groups based on their SMI: men with an SMI ≥ 7.0 kg/m2 and women with an SMI ≥ 5.4 kg/m2 (non‐sarcopenic group), or men with an SMI < 7.0 kg/m2 and women with an SMI < 5.4 kg/m2 (sarcopenic group). The threshold levels for group assignment were based on the criteria of the Asian Working Group for sarcopenia.6 Body mass index (BMI) was calculated as bodyweight/height2 (kg/m2).
Brachial‐ankle pulse wave velocity measurement
Participants were observed under quiet resting conditions in the supine position. The brachial‐ankle pulse wave velocity (baPWV) and blood pressure were measured with a vascular testing device (form PWV/ABI device; BP‐203PREIII, Omron Colin, Kyoto, Japan), according to the method previously described.7 Bilateral brachial and ankle arterial pressure waveforms were stored for 10 s by the extremity cuffs connected to a plethysmographic sensor and an oscillometric pressure sensor wrapped around the participant's arms and ankles. The baPWV was calculated from the distance between the two arterial recording sites divided by the transit time.8 The reproducibility of baPWV was shown in a previous study.9 The mean of the right and left baPWV values were used for analysis.
Cardiopulmonary exercise testing
All patients underwent symptom‐limited bicycle ergometer cardiopulmonary exercise testing (CPET) using an upright, electromagnetically braked, cycle ergometer (Aerobike Strength Ergo‐8, Mitsubishi Electronic, Tokyo, Japan), a metabolic analyser (Aeromonitor AE‐310S, Minato Medical Science, Osaka, Japan), and an electrocardiogram and heart rate (HR) (Stress test system ML‐9000, Fukuda denshi, Tokyo, Japan). The exercise test began with a 3 min rest on the ergometer followed by a 4 min warm‐up at 0 W at 60 rpm. The load was then increased incrementally by 15 W/min during the exercise test. All CPET parameters were measured from the beginning of the initial resting period on the cycle ergometer until the end of the exercise session.
The CPET was terminated upon the patient's request or if abnormal physiologic responses occurred.10 The CPET was also ceased if a patient was unable to continue to perform the pedalling exercise correctly. Oxygen uptake (VO2), carbon dioxide output (VCO2), minute ventilation (VE), tidal volume, and frequency of respiration were smoothed with an 8‐breath moving average. Peak VO2 was defined as the highest value of VO2 obtained during the last minute of the CPET. Peak watt was defined as the power at measured peak VO2 with CPET. VO2/HR, known as oxygen pulse, was calculated by dividing the moving averaged VO2 by the HR. When respiratory exchange ratio (VCO2/VO2, RER) was less than 1.0 at peak exercise, the test was considered insufficient because of the participant's poor effort and the data at peak exercise were not used in the statistics. The anaerobic threshold was determined synthetically by gas exchange criteria at the point of non‐linear increase in the ventilatory equivalent for oxygen and the V‐slope analysis (VCO2–VO2 plot). The slope of the VE–VCO2 relationship was calculated by linear regression analysis using the values from the beginning of ramp exercise to the respiratory compensation point during the CPET and was used as an index of the ventilatory efficiency.
Statistical analysis
Pearson's correlation analyses were performed to evaluate the relationship between SMI and age, BMI, and cardiac function parameters during exercise, including peak VO2, peak VO2/HR, peak watts, ΔVO2/Δwork load, and the VE vs. VCO2 slope. Comparisons of the clinical characteristics of patients in the non‐sarcopenic and sarcopenic groups, including BMI, and cardiac functional parameters during exercise, were performed using unpaired Student's t‐test. In addition, to examine the independent associations between peak VO2/HR and SMI, we applied serial multiple linear regression models with peak VO2/HR as dependent variable. All statistical analyses were performed using the Statistical Package for the Social Sciences (SPSS version 22.0, IBM Japan, Tokyo, Japan) and a two‐tailed significance level was set at P < 0.05 for all tests.
Ethical considerations
This study was approved by the Ethics Committee of the Tokyo Metropolitan Geriatric Hospital and Institute of Gerontology (Authorization Number: 240301) and conforms with the principles outlined in the Declaration of Helsinki. All participants gave their written informed consent prior to data collection.
Results
We enrolled 63 patients, 68% were women, and their mean age was 80 years. Patients' baseline demographics and medication are shown in Table 1A. A total of 24 (38%) subjects fulfilled the criteria of the sarcopenic group and 39 (62%) those of the non‐sarcopenic group. The sarcopenic group had a significantly lower mean peak VO2 (mL/min) (692 ± 241 vs. 884 ± 313, P < 0.05) and peak VO2/HR (mL/beat) (6.1 ± 1.8 vs. 7.4 ± 2.4, P < 0.05) than the non‐sarcopenic group (Table 1B). Of the 20 male subjects, 13 (65%) were in the sarcopenic group and 7 (35%) were in the non‐sarcopenic group. Male patients in the sarcopenic group had significantly lower mean values for peak VO2 (mL/min) (683 ± 254 vs. 1140 ± 350, P < 0.01), peak VO2/HR (mL/beat) (6.5 ± 2.0 vs. 10.2 ± 3.4, P < 0.01), peak watts (W) (51 ± 21 vs. 87 ± 26, P < 0.01), and ⊿VO2/⊿work load (mL/W) (7.5 ± 1.7 vs. 9.7 ± 1.3, P < 0.01) than male patients in the non‐sarcopenic group (Table 1B). In contrast, 11 (26%) of the 43 female subjects were in the sarcopenic group and 32 (74%) were in the non‐sarcopenic group. Female patients in the sarcopenic group had lower peak VO2/HR (mL/beat) values (5.6 ± 1.6 vs. 6.8 ± 1.6, P < 0.05) than female patients in the non‐sarcopenic group (Table 1B). Only peak VO2/HR and BMI significantly differed between the two groups in both sexes. There were significant positive correlations between SMI and peak VO2 (r = 0.631, P < 0.001), as well as between SMI and peak VO2/HR (r = 0.683, P < 0.001) (Figure 1 A). Moreover, there were significant positive correlations between SMI and peak watts (r = 0.540, P < 0.001), SMI and ⊿VO2/⊿work load (r = 0.297, P < 0.05), and SMI and BMI (r = 0.770, P < 0.001). Results of univariate correlation analyses are shown in Table 1B.
Table 1B.
Univariate correlations between a skeletal muscle mass index and age, body mass index, and the results of cardiopulmonary exercise testing
| Related factors | Correlation coefficient | P value |
|---|---|---|
| Age | −0.127 | n.s. |
| Body mass index | 0.770 | P < 0.001 |
| Brachial‐ankle pulse wave velocity | −0.278 | P < 0.05 |
| Peak VO2 | 0.631 | P < 0.001 |
| Peak VO2/weight | 0.274 | P < 0.05 |
| Peak VO2/heart rate | 0.683 | P < 0.001 |
| Peak heart rate | −0.079 | n.s. |
| Peak watts | 0.540 | P < 0.001 |
| Anaerobic threshold VO2 | 0.584 | P < 0.001 |
| Anaerobic threshold VO2/weight | 0.150 | n.s. |
| Anaerobic threshold VO2/heart rate | 0.626 | P < 0.001 |
| Anaerobic threshold heart rate | −0.017 | n.s. |
| Anaerobic threshold watts | 0.386 | P < 0.01 |
| ΔVO2/Δwork load | 0.297 | P < 0.05 |
| VE vs. VCO2 slope | −0.166 | n.s. |
n.s., not significant; peak VO2/HR, peak oxygen uptake/heart rate; VE vs. VCO2 slope, minute ventilation vs. carbon dioxide output slope; VO2, oxygen uptake.
P values were calculated using Student's t‐test.
Figure 1.
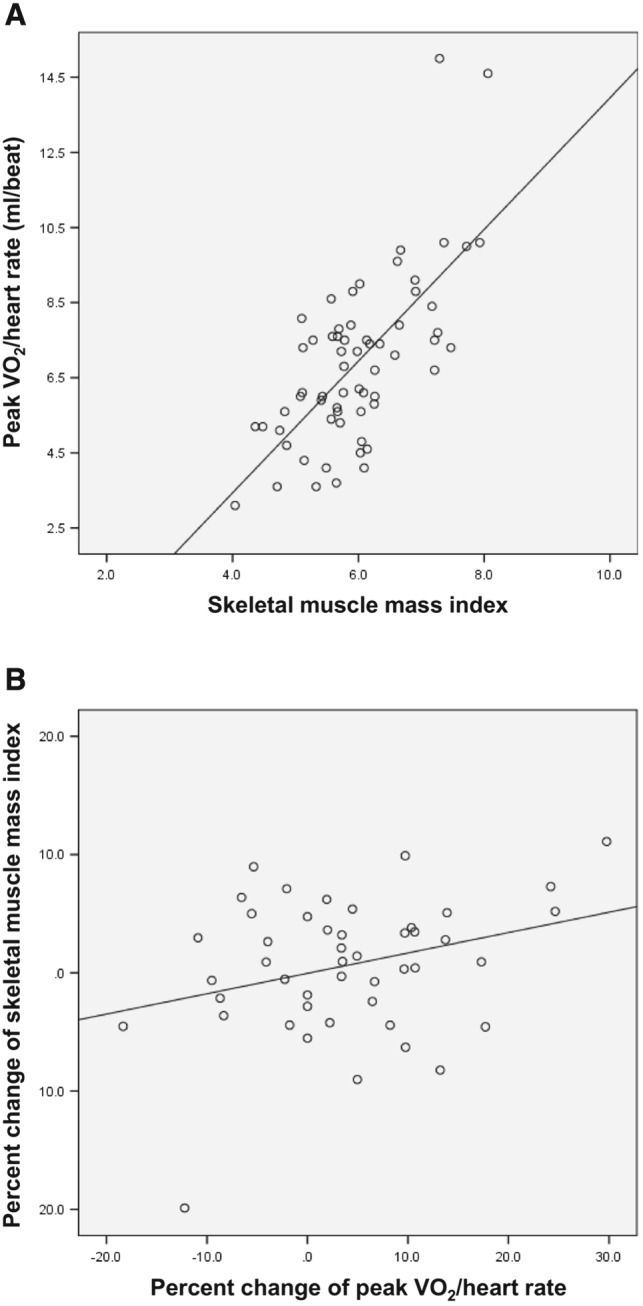
(A) Statistically significant positive correlation between skeletal muscle mass index and peak oxygen pulse (r = 0.683, P < 0.001) in a population of 63 chronically ill older adults. (B) Statistically significant positive correlation between per cent change of skeletal muscle mass index and per cent change of peak oxygen pulse (r = 0.305, P < 0.05) in a population of 47 chronically ill older adults after 4 months of exercise training.
Table 3 shows the results of multiple linear regression analyses with peak VO2/HR as dependent variable. The linear regression models show that SMI is an independent determinant of peak VO2/HR after adjustment for potential confounders (age, sex, baPWV, hypertension, dyslipidemia, diabetes mellitus, coronary artery disease, chronic HF, atrial fibrillation, and treatment with beta‐blockers; B = 1.561; P < 0.001).
Table 2.
Comparison of clinical characteristics between the non‐sarcopenic and sarcopenic groups
| All | Male | Female | |||||||
|---|---|---|---|---|---|---|---|---|---|
| Non‐sarcopenic group (n = 39) | Sarcopenic group (n = 24) | P value | Non‐sarcopenic group (n = 7) | Sarcopenic group (n = 13) | P value | Non‐sarcopenic group (n = 32) | Sarcopenic group (n = 11) | P value | |
| Age, years | 80±7 | 80±7 | n.s. | 82±7 | 81±8 | n.s. | 79±7 | 78±7 | n.s. |
| Body mass index, kg/m2 | 23.8±3.0 | 19.7±2.5 | <0.001 | 25.0±2.7 | 20.2±2.6 | <0.01 | 23.6±3.1 | 19.0±2.4 | <0.001 |
| Brachial‐ankle pulse wave velocity, cm/min | 1846±437 | 1938±461 | n.s. | 1673±669 | 1939±331 | n.s. | 1884±372 | 1937±597 | n.s. |
| Peak VO2, mL/min | 884±313 | 692±241 | <0.05 | 1140±350 | 683±254 | <0.01 | 828±280 | 704±236 | n.s. |
| Peak VO2/weight, mL/min/weight | 16.1±4.6 | 14.4±4.5 | n.s. | 17.8±5.3 | 12.8±4.3 | <0.05 | 15.8±4.4 | 16.2±4.2 | n.s. |
| Peak VO2/heart rate, mL/beat | 7.4±2.4 | 6.1±1.8 | <0.05 | 10.2±3.4 | 6.5±2.0 | <0.01 | 6.8±1.6 | 5.6±1.6 | <0.05 |
| Peak heart rate, bpm | 119±21 | 114±23 | n.s. | 114±23 | 104±22 | n.s. | 120±21 | 124±19 | n.s. |
| Peak watts | 68±26 | 53±21 | <0.05 | 87±26 | 51±21 | <0.01 | 64±25 | 56±20 | n.s. |
| Anaerobic threshold VO2, mL/min | 619±179 | 514±141 | <0.05 | 700±114 | 513±125 | <0.01 | 599±187 | 514±163 | n.s. |
| Anaerobic threshold VO2/weight, mL/min/weight | 11.3±2.8 | 10.6±2.9 | n.s. | 11.5±2.7 | 9.4±2.7 | n.s. | 11.3±2.9 | 11.8±2.6 | n.s. |
| Anaerobic threshold VO2/heart rate, mL/beat | 6.2±1.7 | 5.2±1.5 | <0.05 | 7.8±1.8 | 5.4±1.5 | <0.01 | 5.9±1.5 | 5.1±1.7 | n.s. |
| Anaerobic threshold heart rate, bpm | 100±13 | 100±14 | n.s. | 92±16 | 98±16 | n.s. | 102±12 | 102±11 | n.s. |
| Anaerobic threshold watt | 39.7±14 | 35±12 | n.s. | 46.4±15 | 33.1±14 | n.s. | 38.1±14 | 37.2±10 | n.s. |
| ΔVO2/Δwork load, mL/watt | 8.1±2.2 | 8.0±1.7 | n.s. | 9.7±1.3 | 7.5±1.7 | <0.01 | 7.7±2.2 | 8.5±1.7 | n.s. |
| VE vs. VCO2 slope | 35.7±10.4 | 35.8±12.6 | n.s. | 34.8±6.4 | 37.6±11.2 | n.s. | 35.9±11.1 | 34.0±14.1 | n.s. |
| Hypertension (+) | 26 | 10 | n.s. | 5 | 6 | n.s. | 21 | 4 | n.s. |
| (−) | 13 | 14 | 2 | 7 | 11 | 7 | |||
| Dyslipidemia (+) | 21 | 7 | n.s. | 3 | 4 | n.s. | 18 | 3 | n.s. |
| (−) | 18 | 17 | 4 | 9 | 14 | 8 | |||
| Diabetes mellitus (+) | 11 | 8 | n.s. | 1 | 5 | n.s. | 10 | 3 | n.s. |
| (−) | 28 | 16 | 6 | 8 | 22 | 8 | |||
| Coronary artery disease (+) | 9 | 8 | n.s. | 3 | 6 | n.s. | 6 | 2 | n.s. |
| (−) | 30 | 16 | 4 | 7 | 26 | 9 | |||
| Chronic heart failure (+) | 4 | 5 | n.s. | 1 | 4 | n.s. | 3 | 1 | n.s. |
| (−) | 35 | 19 | 6 | 9 | 29 | 10 | |||
| Atrial fibrillation (+) | 6 | 2 | n.s. | 0 | 2 | n.s. | 6 | 0 | n.s. |
| (−) | 33 | 22 | 7 | 11 | 26 | 11 | |||
| Beta‐blocker treatment (+) | 11 | 9 | n.s. | 2 | 7 | n.s. | 9 | 2 | n.s. |
| (−) | 28 | 15 | 5 | 6 | 23 | 9 | |||
n.s., not significant; peak VO2/HR, peak oxygen uptake/heart rate; VE vs. VCO2 slope, minute ventilation vs. carbon dioxide output slope; VO2, oxygen uptake.
Numerical data are expressed as mean ± SD.
P values were calculated using Student's t‐test.
Participants were classified as being in the non‐sarcopenic group and sarcopenic group based on the Asian sarcopenia cut‐off values for muscle mass measurements (7.0 kg/m2 for men and 5.4 kg/m2 for women as measured by dual X‐ray absorptiometry).6
Table 3.
Multiple linear regression analysis with peak VO2/HR as the dependent variable
| B | β | P value | LCI | UCI | |
|---|---|---|---|---|---|
| Skeletal muscle mass index | 1.561 | 0.625 | <0.001 | 1.031 | 2.091 |
| Age | −0.103 | −0.304 | <0.05 | −0.174 | −0.033 |
| Sex | −1.054 | −0.207 | n.s. | −2.158 | 0.051 |
| R 2 = 0.615 | |||||
B, regression coefficient; LCI, lower 95% confidence interval; peak VO2/HR, peak oxygen uptake/heart rate; UCI, upper 95% confidence interval.
Adjusted for conventional risk factors (age, sex, brachial‐ankle pulse wave velocity, hypertension, dyslipidemia, diabetes mellitus, coronary artery disease, chronic heart failure, atrial fibrillation, and treatment with beta‐blockers) in addition to peak VO2/HR.
P values were calculated using Student's t‐test.
Exercise capacity after exclusion of potential confounders
Moreover, after excluding participants who had atrial fibrillation and those being treated with beta‐blockers from the analyses, we performed parallel statistical analyses of the data from the remaining 42 participants (mean age 78 years, 26% men). Of these 42 participants, 15 (36%) were in the sarcopenic group, and 27 (64%) were in the non‐sarcopenic group. The results of this subpopulation were similar to those obtained from all 63 subjects; there were significant positive correlations between SMI and peak VO2/HR (r = 0.697, P < 0.001), and patients in the sarcopenic group had significantly lower peak VO2/HR (mL/beat) values compared with patients in the non‐sarcopenic group (6.2 ± 1.7 vs. 7.7 ± 2.2, P < 0.05).
Follow‐up assessment
The assessment after 4 months of follow‐up using data from 47 participants, we found that there was still a significant positive correlations between SMI and peak VO2/HR (r = 0.567, P < 0.001). Twenty‐seven subjects were in the SMI‐increasing group, and 20 subjects were in the SMI‐decreasing group. There was significant positive correlations between percent change of SMI and percent change of peak VO2/HR (r = 0.305, P < 0.05) (Figure 1 B).
Discussion
Our study using data from unselected outpatients a geriatric outpatient clinic in Japan shows that 37% of subjects presented with reduced skeletal muscle mass that fulfills the criteria of sarcopenia. Similarly, previous study reported that the prevalence rate of sarcopenia for community‐dwelling Japanese women was less than 7% for ages 60–69 years, and 24% for ages 70–80 years, and the prevalence rate of sarcopenia for community‐dwelling Japanese men was less than 33% for ages 60–69 years, and 47% for ages 70–85 years.11
We also showed that skeletal muscle mass assessed using DEXA scanning was a major determinant of exercise capacity in elderly subjects, and this fact remained true after restricting the analysis to those without beta‐blocker use and those without atrial fibrillation.
Skeletal muscle mass remained a major predictor of exercise capacity in both groups and determines the level of exercise that can be achieved in either group, even though sarcopenic subjects had overall lower peak VO2 values than non‐sarcopenic subjects.
The loss of muscle mass that occurs with ageing is clinically important because it leads to diminished muscle strength, reduced exercise tolerance, and a decreased quality of life.12 In the present study, SMI was positively correlated with VO2. This suggests that there is a relationship between muscle wasting and exercise intolerance. However, ageing‐related muscle wasting is thought to be sex‐dependent. In the present study, the only CPET parameter that was significantly correlated with SMI in both sexes was peak VO2/HR.
In general, peak VO2/HR is calculated using the Fick principle:
Peak VO2/HR strongly correlates with peak stroke volume,13 and therefore, it is considered an index of SV. Moreover, it was previously reported that peak AVO2diff did not change after exercise training in either the young or in older adults.14 Based on the Fick principle and this previous report, our results suggest that a reduction in SMI is one of the most important factors affecting the deterioration of peak SV.
Recently, the relationship between sarcopenia and cardiovascular disease has been recognized to be of a great importance in super‐ageing societies. Both sarcopenia and chronic HF are highly prevalent in advanced ageing societies.1, 4 In particular, HFpEF has received much attention in recent years because of its high prevalence among older adults.15 It has been reported that HFpEF is associated with reduced lean body mass,5 and exercise intolerance is a hallmark of both sarcopenia and HFpEF.16, 17 The association between exercise intolerance and a lower peak VO2 is explained by the Fick principle. However, our finding that peak VO2/HR, an index of peak SV correlated with SMI, suggests, for the first time, a relationship between cardiac functional reserve and muscle wasting. This may be the case with the exercise intolerance in patients with HFpEF, which Phan et al. attributed to deterioration in peak SV.18 On the other hand, Dhakal et al. reported that a reduction in peak AVO2diff was the cause of the exercise intolerance in HFpEF,19 although previous studies showed no changes in peak AVO2diff with ageing.13
Both muscle wasting and HFpEF are associated with exercise intolerance. Muscle wasting is associated with a reduction in peak SV, whereas HFpEF is associated with a reduction in peak SV and/or peak AVO2diff. Thus, muscle wasting in community‐dwelling older adults might be one of several possible phenotypes of ageing, which may subsequently develop to HFpEF.
There are several potential mechanisms that may underlie the relationship between muscle wasting and deterioration of cardiac function. It was known that the most evident metabolic explanation for muscle wasting is an imbalance between protein catabolism (e.g. members of the ubiquitin–proteasome system, myostatin, and apoptosis inducing factors) and anabolism (e.g. members of the ubiquitin–proteasome system, myostatin, and apoptosis inducing factors).20, 21 Even more, it was known that the muscle wasting in HF is also an imbalance between protein catabolism and anabolism.22 Recently, Mangner and colleagues show an animal model in that the antioxidative and metabolic capacities are heterogeneous in their response to chronic HF between the diaphragm and quadriceps, but similar activation of protein degradation pathways (e.g. the ubiquitin–proteasome system) was evident in both muscles.23 Ubiquitin–proteasome system is known as the system that induces degradation of sarcomeric proteins including cTnI,24 myosin heavy chain,25 and myosin‐binding protein.26 These changes occur in both skeletal muscle and cardiomyocytes. In addition, MuRF‐1 affects fatty acid and glucose oxidation, as well as mitochondrial function in cardiomyocytes.27 These mechanisms might underlie the relationship between muscle wasting and cardiac function, in both of deconditioning and reconditioning.
It was known that peripheral circulation significantly contribute to exercise intolerance in patients with chronic HF.28 Therefore, we evaluated baPWV as a parameter of peripheral circulation in this study. We found that there is a low negative correlation between SMI and baPWV, and there is no difference of baPWV between sarcopenic group and non‐sarcopenic group (Table 2). Furthermore, in multiple linear regression analyses, no relation was found between baPWV and each of peak VO2/HR and SMI (Table 2). This might be due to the difference of participant's characteristics between chronic HF patients in previous report28 and community‐dwelling older adults in this study.
This study had several limitations. Firstly, we did not measure the biomarker which related with ubiquitine–proteasome system. Secondly, we did not measure SV directly.
In conclusion, peak VO2/HR (an index of stroke volume at peak exercise) was strongly associated with skeletal muscle mass. SMI was an independent determinant of peak VO2/HR after adjustment for potential confounders. These results suggest that there is a bidirectional relationship between muscle wasting and cardiac function in community‐dwelling older adults. A large number of longitudinal studies are needed to evaluate cardiac function over time and to prove a causal relationship between SMI and peak VO2/HR.
Conflict of interest
None declared.
Sugie, M. , Harada, K. , Takahashi, T. , Nara, M. , Ishikawa, J. , Koyama, T. , Kim, H. , Tanaka, J. , Fujimoto, H. , Obuchi, S. , von Haehling, S. , Kyo, S. , and Ito, H. (2017) Relationship between skeletal muscle mass and cardiac function during exercise in community‐dwelling older adults. ESC Heart Failure, 4: 409–416. doi: 10.1002/ehf2.12158.
This work was performed at the Tokyo Metropolitan Geriatric Hospital and Institute of Gerontology.
References
- 1. Morley JE, Anker SD, von Haehling S. Prevalence, incidence, and clinical impact of sarcopenia: facts, numbers, and epidemiology‐update 2014. J Cachexia Sarcopenia Muscle 2014; 5: 253–259. [DOI] [PMC free article] [PubMed] [Google Scholar]
- 2. Atkins JL, Whincup PH, Morris RW, Lennon LT, Papacosta O, Wannamethee SG. Sarcopenic obesity and risk of cardiovascular disease and mortality: a population‐based cohort study of older men. J Am Geriatr Soc 2014; 62: 253–260. [DOI] [PMC free article] [PubMed] [Google Scholar]
- 3. Narumi T, Watanabe T, Kadowaki S, Takahashi T, Yokoyama M, Kinoshita D, Honda Y, Funayama A, Nishiyama S, Takahashi H, Arimoto T, Shishido T, Miyamoto T, Kubota I. Sarcopenia evaluated by fat‐free mass index is an important prognostic factor in patients with chronic heart failure. Eur J Intern Med 2015; 26: 118–122. [DOI] [PubMed] [Google Scholar]
- 4. Hunt SA, Baker DW, Chin MH, Cinquegrani MP, Feldman AM, Francis GS, Ganiats TG, Goldstein S, Gregoratos G, Jessup ML, Noble RJ. ACC/AHA guidelines for the evaluation and management of chronic heart failure in the adult: executive summary. J Am Coll Cardiol 2001; 38: 2101–2113. [DOI] [PubMed] [Google Scholar]
- 5. Haykowsky MJ, Brubaker PH, Morgan TM, Kritchevsky S, Eggebeen J, Kitzman DW. Impaired aerobic capacity and physical functional performance in older heart failure patients with preserved ejection fraction: role of lean body mass. J Gerontol A Biol Sci Med Sci 2013; 68: 968–975. [DOI] [PMC free article] [PubMed] [Google Scholar]
- 6. Chen LK, Liu LK, Woo J, Assantachai P, Auyeung TW, Bahyah KS, Chou MY, Chen LY, Hsu PS, Krairit O, Lee JS. Sarcopenia in Asia: consensus report of the Asian Working Group for Sarcopenia. J Am Med Dir Assoc 2014; 15: 95–101. [DOI] [PubMed] [Google Scholar]
- 7. Yamashina A, Tomiyama H, Takeda K, Tsuda H, Arai T, Hirose K, Koji Y, Hori S, Yamamoto Y. Validity, reproducibility, and clinical significance of noninvasive brachial‐ankle pulse wave velocity measurement. Hypertens Res 2002; 25: 359–364. [DOI] [PubMed] [Google Scholar]
- 8. Sugawara J, Hayashi K, Yokoi T, Cortez‐Cooper MY, DeVan AE, Anton MA, Tanaka H. Brachial‐ankle pulse wave velocity: an index of central arterial stiffness? J Hum Hypertens 2005; 19: 401–406. [DOI] [PubMed] [Google Scholar]
- 9. Matsui Y, Kario K, Ishikawa J, Eguchi K, Hoshide S, Shimada K. Reproducibility of arterial stiffness indices (pulse wave velocity and augmentation index) simultaneously assessed by automated pulse wave analysis and their associated risk factors in essential hypertensive patients. Hypertens Res 2004; 27: 851–857. [DOI] [PubMed] [Google Scholar]
- 10. Fletcher GF, Ades PA, Kligfield P, Arena R, Balady GJ, Bittner VA, Coke LA, Fleg JL, Forman DE, Gerber TC, Gulati M, Madan K, Rhodes J, Thompson PD, Williams MA. American Heart Association Exercise, Cardiac Rehabilitation, and Prevention Committee of the Council on Clinical Cardiology, Council on Nutrition, Physical Activity and Metabolism, Council on Cardiovascular and Stroke Nursing, and Council on Epidemiology and Prevention. Exercise standards for testing and training: a scientific statement from the American Heart Association. Circulation 2013; 128: 873–934. [DOI] [PubMed] [Google Scholar]
- 11. Abe T, Thiebaud RS, Loenneke JP, Loftin M, Fukunaga T. Prevalence of site‐specific thigh sarcopenia in Japanese men and women. Age (Dordr) 2014; 36: 417–426. [DOI] [PMC free article] [PubMed] [Google Scholar]
- 12. Thomas DR. Loss of skeletal muscle mass in aging: examining the relationship of starvation, sarcopenia and cachexia. Clin Nutr 2007; 26: 389–399. [DOI] [PubMed] [Google Scholar]
- 13. Ehsani AA, Spina RJ, Peterson LR, Rinder MR, Glover KL, Villareal DT, Binder EF, Holloszy JO. Attenuation of cardiovascular adaptations to exercise in frail octogenarians. J Appl Physiol 2003; 95: 1781–1788. [DOI] [PubMed] [Google Scholar]
- 14. Wang E, Næss MS, Hoff J, Albert TL, Pham Q, Richardson RS, Helgerud J. Exercise‐training‐induced changes in metabolic capacity with age: the role of central cardiovascular plasticity. Age (Dordr) 2014; 36: 665–676. [DOI] [PMC free article] [PubMed] [Google Scholar]
- 15. Senni M, Tribouilloy CM, Rodeheffer RJ, Jacobsen SJ, Evans JM, Bailey KR, Redfield MM. Congestive heart failure in the community: a study of all incident cases in Olmsted County, Minnesota, in 1991. Circulation 1998; 98: 2282–2289. [DOI] [PubMed] [Google Scholar]
- 16. Evans WJ, Campbell WW. Sarcopenia and age‐related changes in body composition and functional capacity. J Nutr 1993; 123: 465–468. [DOI] [PubMed] [Google Scholar]
- 17. Abudiab MM, Redfield MM, Melenovsky V, Olson TP, Kass DA, Johnson BD, Borlaug BA. Cardiac output response to exercise in relation to metabolic demand in heart failure with preserved ejection fraction. Eur J Heart Fail 2013; 15: 776–785. [DOI] [PMC free article] [PubMed] [Google Scholar]
- 18. Phan TT, Abozguia K, Shivu GN, Mahadevan G, Ahmed I, Williams L, Dwivedi G, Patel K, Steendijk P, Ashrafian H, Henning A. Heart failure with preserved ejection fraction is characterized by dynamic impairment of active relaxation and contraction of the left ventricle on exercise and associated with myocardial energy deficiency. J Am Coll Cardiol 2009; 54: 402–409. [DOI] [PubMed] [Google Scholar]
- 19. Dhakal BP, Malhotra R, Murphy RM, Pappagianopoulos PP, Baggish AL, Weiner RB, Houstis NE, Eisman AS, Hough SS, Lewis GD. Mechanisms of exercise intolerance in heart failure with preserved ejection fraction: the role of abnormal peripheral oxygen extraction. Circ Heart Fail 2014; DOI: 10.1161CIRCHEARTFAILURE.114.001825. [DOI] [PMC free article] [PubMed] [Google Scholar]
- 20. Lenk K, Schuler G, Adams V. Skeletal muscle wasting in cachexia and sarcopenia: molecular pathophysiology and impact of exercise training. J Cachexia Sarcopenia Muscle 2010; 1: 9–21. [DOI] [PMC free article] [PubMed] [Google Scholar]
- 21. Palus S, von Haehling S, Springer S. Muscle wasting: an overview of recent developments in basic research. J Cachexia Sarcopenia Muscle 2014; 5: 193–198. [DOI] [PMC free article] [PubMed] [Google Scholar]
- 22. von Haehling S, Steinbeck L, Doehner W, Springer J, Anker SD. Muscle wasting in heart failure: an overview. Int J Biochem Cell Biol 2013; 45: 2257–2265. [DOI] [PubMed] [Google Scholar]
- 23. Mangner N, Weikert B, Bowen TS, Sandri M, Höllriegel R, Erbs S, Hambrecht R, Schuler G, Linke A, Gielen S, Adams V. Skeletal muscle alterations in chronic heart failure: differential effects on quadriceps and diaphragm. J Cachexia Sarcopenia Muscle 2015; 6: 381–390. [DOI] [PMC free article] [PubMed] [Google Scholar]
- 24. Kedar V, McDonough H, Arya R, Li HH, Rockman HA, Patterson C. Muscle‐specific RING finger 1 is a bona fide ubiquitin ligase that degrades cardiac troponin I. Proc Natl Acad Sci USA 2004; 101: 18135–18140. [DOI] [PMC free article] [PubMed] [Google Scholar]
- 25. Fielitz J, van Rooij E, Spencer JA, Shelton JM, Latif S, van der Nagel R, Bezprozvannaya S, de Windt L, Richardson JA, Bassel‐Duby R, Olson EN. Loss of muscle‐specific RING‐finger 3 predisposes the heart to cardiac rupture after myocardial infarction. Proc Natl Acad Sci 2007; 104: 4377–4382. [DOI] [PMC free article] [PubMed] [Google Scholar]
- 26. Mearini G, Gedicke C, Schlossarek S, Witt CC, Krämer E, Cao P, Gomes MD, Lecker SH, Labeit S, Willis MS, Eschenhagen T. Atrogin‐1 and MuRF1 regulate cardiac MyBP‐C levels via different mechanisms. Cardiovasc Res 2010; 85: 357–366. [DOI] [PMC free article] [PubMed] [Google Scholar]
- 27. Patterson C, Willis MS, Portbury A. Rise above: muscle ring‐finger‐1 (MURF1) regulation of cardiomyocyte size and energy metabolism. Trans Am Clin Climatol Assoc 2011; 122: 70–81. [PMC free article] [PubMed] [Google Scholar]
- 28. Manetos C, Dimopoulos S, Tzanis G, Vakrou S, Tasoulis A, Kapelios C, Agapitou V, Ntalianis A, Terrovitis J, Nanas S. Skeletal muscle microcirculatory abnormalities are associated with exercise intolerance, ventilatory inefficiency, and impaired autonomic control in heart failure. J Heart Lung Transplant. 2011; 30: 1403–1408. [DOI] [PubMed] [Google Scholar]