

Abstract
Gerodermia osteodysplastica (GO) is a segmental progeroid disorder caused by loss-of-function mutations in the GORAB gene, associated with early onset osteoporosis and bone fragility. A conditional mouse model of GO (GorabPrx1) was generated in which the Gorab gene was deleted in long bones. We examined the biomechanical/functional relevance of the GorabPrx1 mutants as a premature aging model by characterizing bone composition, tissue-level strains, and whole-bone morphology and mechanical properties of the tibia. MicroCT imaging showed that GorabPrx1 tibiae had an increased anterior convex curvature and decreased cortical cross-sectional area, cortical thickness and moments of inertia, compared to littermate control (LC) tibiae. Fourier transform infrared imaging (FTIRI) indicated a 34% decrease in mineral/matrix ratio and a 27% increase in acid phosphate content in the posterior metaphyseal cortex of the GorabPrx1 tibiae (p<0.05), suggesting delayed mineralization. In vivo strain gauge measurement and finite element analysis showed ~two times higher tissue-level strains within the GorabPrx1 tibiae relative to LC tibiae when subjected to axial compressive loads of the same magnitude. Three-point bending tests suggested that GorabPrx1 tibiae were weaker and more brittle, as indicated by decreasing whole-bone strength (46%), stiffness (55%), work-to-fracture (61%) and post-yield displacement (47%). Many of these morphological and biomechanical characteristics of the GorabPrx1 tibia recapitulated changes in other animal models of skeletal aging. Future studies are necessary to confirm how our observations might guide the way to a better understanding and treatment of GO.
Keywords: premature aging, osteoporosis, finite element analysis, bone composition, bone strength
1. Introduction
Gerodermia osteodysplastica (GO, MIM#231070) is a hereditary segmental progeroid disorder (Al-Gazali et al., 2001; Hennies et al., 2008; Nanda et al., 2008; Rajab et al., 2008), one of the few monogenic disorders other than osteogenesis imperfecta that has pronounced osteoporosis and fractures already in childhood (Hunter, 1988; Lisker et al., 1979; Nanda et al., 2008). Individuals with GO also have a prematurely aged appearance with wrinkled skin and generalized connective tissue weakness (Al-Bughaili et al., 2017). GO is caused by loss-of-function mutations in GORAB (also named SCYL1-binding protein 1 or NTKL-binding protein 1), which is highly expressed in skin and bone (Hennies et al., 2008). The protein is probably involved in intra-Golgi trafficking processes (Egerer et al., 2015).
Recently, a mouse model of GO (GorabPrx1) has been developed by our group (Steiner et al., 2015), wherein Gorab is conditionally inactivated in the limb bud mesenchyme by crossing Gorabflox with Prx1-cre mice (Logan et al., 2002). The GorabPrx1 mice showed mild growth retardation, a reduction of trabecular and cortical bone volume, and mineralization defects (Steiner et al., 2015). Furthermore, it has been demonstrated that loss of Gorab impairs proteoglycan synthesis leading to bone fragility through collagen disorganization, TGF-beta upregulation, and impaired osteoblast lineage differentiation, which may explain the pathomechanism of GO (Steiner et al., 2015). TGF-beta upregulation has also been implicated in two other disorders that are associated with osteoporosis or osteopenia, osteogenesis imperfecta (Glorieux and Moffatt, 2013) and Marfan syndrome (Nistala et al., 2010), respectively. Despite these insights into the molecular mechanisms of GO, bone fragility-related factors, including tissue material properties, whole-bone morphology and mechanical behavior of GorabPrx1 bones have not been examined. Studying the early onset skeletal deterioration observed in GorabPrx1 mice may provide insights into bone fragility associated with GO and help elucidate mechanisms underlying chronological skeletal aging (Jilka, 2013). Therefore, we examined the biomechanical/functional relevance of the GorabPrx1 mouse model. Our objective was to characterize tissue composition, whole-bone morphology and mechanical behavior of the tibiae from GorabPrx1 mice compared with littermate controls (LCs).
2. Materials and Methods
2.1 Animals
The study included 10–12 week-old female GorabPrx1 mice and homozygous conditional Gorabflox mice without the cre allele from the same generation as LCs. The GorabPrx1 mice were generated by crossing Gorabflox with Prx1-cre mice (Logan et al., 2002) to conditionally inactivate Gorab expression in limb bud mesenchyme (Steiner et al., 2015). Animals were backcrossed > 6 times with C57BL/6 mice. All procedures were approved by the local animal welfare legal authority (LaGeSo; Berlin, Germany; G0213/12).
2.2 In vivo tibial strain measurements
In vivo strain measurements were performed on the medial surface of the tibial midshaft in living 10 week-old LC and GorabPrx1 mice to determine the relationship between applied tibial compressive loads and bone tissue deformation (n=5/genotype). While the mouse was anesthetized, an incision was made over the medial surface of the tibia and a uniaxial strain gauge (EA-06-015LA-120, Micromeasurements, NC) mounted on the anterio-medial surface of the tibial midshaft aligned with the bone’s long axis. A range of dynamic compressive loads (peak loads ranging from −2 to −12 N) was applied through the knee and ankle joints, using an in vivo loading device (Testbench ElectroForce LM1, TA Instruments, DE) mounted with custom-designed fixtures (Fig. 1), recording load and strain measurements simultaneously. Measurements were performed for both left and right tibiae. Mice were euthanized following loading, while still under anesthesia. Axial rigidity, previously referred to by others as “in vivo stiffness” (Main et al., 2010), was calculated as the change in load over the change in strain and averaged for all load levels (−2, −4, −6, −8, −10, −12 N) to obtain a mean axial rigidity value for each tibia, from which the mean gauge-measured strain of the tibia can be calculated at a given load magnitude. The axial rigidity or the relationship between the axial compressive load and the strain generated at the gauge site is important since tissue level strain regulates bone growth and remodeling (Main et al., 2010).
Fig. 1.

(A) Schematic showing the experimental configuration for in vivo strain gauging and compressive loading of the mouse tibia. (B) A strain gauged tibia showing the position of the gauge in vivo.
2.3 Diaphyseal and metaphyseal geometric measurements
In an additional group of 10 week-old mice (n=8 GorabPrx1, n=10 LC) geometric measures were performed at two representative tibial regions (midshaft and proximal metaphysis) following microcomputed tomography (microCT; isotropic voxel size of 10.5 μm; vivaCT 40, Scanco Medical, Switzerland; 55 kVp, 145 μA, 600 ms integration time, no frame averaging). There were originally 10 GorabPrx1 mice, but two mice died while under anesthesia during in vivo microCT scanning and therefore were excluded from the study. The proximal metaphyseal volume of interest (VOI) started 100 μm below the distal-most point of the growth plate and extended distally 10% of the tibial length (Willie et al., 2013; Yang et al., 2017). The cancellous and cortical bone in the metaphyseal VOI were segmented manually in the scans and analyzed separately. The cortical midshaft VOI was centered at the midpoint of the tibia and extended 5% of the tibial length (Willie et al., 2013; Yang et al., 2017). A threshold of 671 mg HA/ccm was used to segment both diaphyseal and metaphyseal cortical bone. A threshold of 450 mg HA/ccm was used to segment metaphyseal cancellous bone.
2.4 Characterization of tissue-level strains within the entire tibia
MicroCT-based finite element (FE) simulation was performed mimicking the in vivo tibial strain gauging experiment to determine tissue-level strains within the entire tibia. The FE approach used in this study had been developed and validated in C57BL/6 mice across a broad range of ages (10, 26, and 78 week old; (Razi et al., 2015; Yang et al., 2014)). To acquire whole bone geometry, ex vivo microCT (10 μm resolution) was performed on the entire tibiae that were strain-gauged in vivo (n=3 representative tibiae/genotype). Tibial FE models with tetrahedral elements were created following segmentation and bone surface extraction using Amira software (Zuse Institute, Berlin, Germany) (Razi et al., 2015). Homogeneous elastic material properties (Young’s modulus of 13.8 GPa; (Razi et al., 2015)) were used for both LC and GorabPrx1 FE models. Additionally, to estimate the influence of tissue heterogeneity on strain distributions, heterogeneous FE models of one representative bone per genotype were created and their strain predictions were compared with homogeneous models of the same bones. The heterogeneous modeling approach has been described in detail elsewhere (Razi et al., 2015; Albiol et al., 2017). Briefly, element-specific Young’s modulus values were assigned to the FE models based on spatial distribution of the attenuation coefficient (μ) in the microCT scans. The Young’s modulus (E) was calculated with a power-law equation E = (μ/μmax)1.5×17 GPa, where μmax is the maximum attenuation coefficient in the whole-bone microCT scans.
Loading was applied in a direction representing the trajectory in which the actuator moves (Fig. 1; (Razi et al., 2015; Willie et al., 2013)). The compressive load was applied through a contact surface on the knee side, replicating the tibio-femoral contact areas. On the ankle side, the talus-tibialis contact surface nodes were constrained allowing displacement in antero-posterior direction and rotation around the medio-lateral axis. The same load level of −5 N was used for both LC and GorabPrx1 models to compare their tissue-level strains; this load level was chosen because it induced ~1200 με at the tibial midshaft in GorabPrx1 mice based on our in vivo strain gauge measures. This strain level has been shown to be osteogenic and is approximately 2–3 times the strain level engendered in C57Bl/6 mice during walking (De Souza et al., 2005; Sugiyama et al., 2012). Linear elastic FE analyses were performed (Abaqus, Dassault Systemés Simulia, MA). The strain at the gauge site in the model was calculated and compared with experimental measures above. The tibia was equally divided into 20 regions along its longitudinal direction. Compressive (minimum principal) and tensile (maximum principal) strains in each region were compared between LC and GorabPrx1 mice.
2.5 Characterization of whole-bone morphology of the tibia
Radii of longitudinal curvature of the whole tibia were measured in anterior-posterior and medial-lateral directions based on reconstructed 3D tibial models above. Tibial axis was determined by a straight line connecting the centroids of the proximal and distal ends (regions) of the tibia (Galea et al., 2015; Main et al., 2010). In each of the 20 regions along the tibial length, the centroid of the bone section was identified, and then the anterior-posterior and medial-lateral radii of curvature (CAP and CML) were measured as the perpendicular distances between the centroid and tibial axis in the anterior-posterior and medial-lateral directions, respectively. Positive values for CAP and CML represented anterior and medial convexities, respectively (Main et al., 2010).
2.6 Characterization of bone tissue composition by Fourier transform infrared (FTIR) imaging
Tibiae from 12 week-old LC and GorabPrx1 mice (n=5/genotype) were dissected, dehydrated in ascending grades of ethanol, embedded in methyl methacrylate, and cut at the mid-sagittal plane with a microtome (Leica SM2500S, Germany) into 2 μm thick sections. The prepared undecalcified tibial sections were mounted on barium fluoride infrared windows for FTIR imaging (Perkin Elmer Spotlight Imaging System, MA). FTIR imaging was performed at the proximal metaphysis and mid-diaphysis of the tibia to remain consistent with the microCT regions of interest. Due to restrictions related to field of view, only the posterior side of these two regions was analyzed. The regions were scanned using a spectral resolution of 4 cm−1 and a spatial resolution of 6.25 μm. FTIR bone parameters calculated were (Boskey and Pleshko Camacho, 2007): mineral/matrix ratio (area of 916–1180 cm−1/1590–1712 cm−1); carbonate/mineral ratio (area of 852–890 cm−1/916–1180 cm−1); collagen maturity (peak intensity ratio of 1660 cm−1/1690 cm−1); crystallinity (peak intensity ratio of 1020 cm−1/1030 cm−1); acid phosphate content (peak height 1096 cm−1/1128 cm−1).
2.7 Whole-bone mechanical properties determined by three-point bending tests
Tibiae from 12 week-old LC and GorabPrx1 mice (n=7–11/genotype) were tested to failure in three-point bending using a servohydraulic testing system (Testbench ElectroForce LM1, TA Instruments, MA) with a 25 lbs load cell (MLP 25, Transducer Techniques, CA) at a deflection rate of 0.1 mm/second. An 8.5 mm span was used for all tests. The load was applied to the anterior surface of the tibia midshaft. Load and displacement data were simultaneously collected at 20 Hz. The following parameters were reported as recommended by Jepsen et al. (Jepsen et al., 2015): maximum load (N), stiffness (N/mm), work-to-fracture (Nmm) and post-yield displacement (mm).
2.8 Data analysis
Differences in tibial morphology, bone composition, tissue-level strain and whole-bone mechanical properties between LC and GorabPrx1 mice were tested by unpaired t-tests (SAS 9.4, SAS Institute, Inc, NC) to determine the effect of genotype on these outcome parameters. All data are presented as mean ± SD. Statistical significance was set as p < 0.05. We also performed additional adjustments on microCT-measured bone size parameters as well as three-point bending parameters to account for body weight. The adjustments were performed using the linear regression as recommended by Jepsen et al. (Jepsen et al., 2015). The bones used for microCT, three-point bending, FTIR and strain gauge measure were all from different groups of mice. The bones used for strain gauge measures were also used for FE modeling and whole-bone morphology characterization.
3. Results
3.1 Gorab deficiency alters cross-sectional geometry of the tibia
At 10 week of age, GorabPrx1 and LC mice weighed 17.9±1.2 g and 23.3±1.7 g, respectively. GorabPrx1 mice had smaller total area, cortical area and cortical thickness, as examined at the midshaft and metaphyseal regions of the tibia, compared to LC (Fig. 2; Table 1). Compared to LC tibiae, maximum and minimum moments of inertia were decreased in GorabPrx1 tibiae at both the midshaft and metaphyseal regions (Fig. 2; Table 1). Interestingly, the cortical tissue mineral density (TMD) was not different between the GorabPrx1 and LC tibiae in the midshaft but 2% lower in GorabPrx1 bone for the metaphyseal region (Fig. 2; Table 1). For metaphyseal cancellous bone, GorabPrx1 tibiae had decreased trabecular bone volume fraction and trabecular number compared with LC tibiae (Table 1). There was a 10% increase in TMD of the metaphyseal cancellous bone of the GorabPrx1 tibia (Table 1). After body weight adjustment, only minimum moment of inertia of the midshaft cortical bone was affected, suggesting that the body weight difference may not explain the difference in bone size between LC and GorabPrx1 mice, but rather is likely attributed to the genetic perturbation.
Fig. 2.

Differences in cross-sectional geometry and tissue mineral density (TMD) of the midshaft of the tibia (5% of total tibial length) between LC and GorabPrx1 mice, measured by microCT. * p<0.05 by unpaired t-test.
Table 1.
MicroCT-measured geometric or structural parameters for the proximal metaphyseal cortical and cancellous bone of the LC and GorabPrx1 tibiae, located just below the growth plate extending 10% of the tibial length distally.
| Parameters | LC | GorabPrx1 | Difference (%) |
|---|---|---|---|
| Metaphyseal cortical bone | |||
| Ct.Ar (mm2) | 0.890 ± 0.090 | 0.358 ± 0.078 b | −60 |
| Tt.Ar (mm2) | 1.413 ± 0.120 | 1.020 ± 0.180 b | −28 |
| Ma.Ar (mm2) | 0.523 ± 0.090 | 0.659 ± 0.150 | 26 |
| Ct.Th (mm) | 0.111 ± 0.015 | 0.053 ± 0.008 b | −52 |
| Imax (mm4) | 0.375 ± 0.072 | 0.209 ± 0.035 b | −44 |
| Imin (mm4) | 0.256 ± 0.046 | 0.076 ± 0.028 b | −70 |
| Ct.TMD (mgHA/ccm) | 1075 ± 20 | 1052 ± 17 a | −2 |
| Metaphyseal cancellous bone | |||
| BV/TV (%) | 9.6 ± 3.0 | 4.7 ± 1.7 b | −50 |
| Tb.Th (μm) | 46 ± 4 | 45 ± 5 | −3 |
| Tb.N (1/mm) | 4.2 ± 0.5 | 3.6 ± 0.5 a | −14 |
| Tb.Sp (μm) | 244 ± 29 | 281 ± 44 | 15 |
| Tb.TMD (mgHA/ccm) | 791 ± 31 | 870 ± 32 b | 10 |
Data are presented as mean ± SD.
Differences are calculated as (GorabPrx1-LC)/LC×100.
p<0.05 relative to LC.
p<0.001 relative to LC.
3.2 Gorab deficiency alters cortical bone composition
In the posterior metaphyseal cortical region, the mineral/matrix ratio in GorabPrx1 tibiae was 36% less than LC tibiae (Fig. 3). Deficiency of Gorab did not affect carbonate/mineral ratio and collagen maturity (Fig. 3). There was a slight, but statistically significant decrease in crystallinity (2%) in the GorabPrx1 tibiae compared to the LC tibiae. Tibial acid phosphate substitution was 27% greater in GorabPrx1 than in LC. In the mid-diaphyseal cortical region, only acid phosphate substitution was significantly affected by Gorab deficiency, with the GorabPrx1 tibiae having 12% greater acid phosphate relative to LC (Table 2).
Fig. 3.

Representative FTIR images of the cortical bone from the proximal posterior metaphyseal region of the LC and GorabPrx1 tibiae. The color scale for all images for an indicated variable (mineral/matrix ratio, carbonate/mineral ratio, collagen maturity, crystallinity and acid phosphate) is shown besides the images for that group. Quantitative data show that GorabPrx1 tibiae have decreased mineral/matrix ratio (−36%) and increased acid phosphate (+27%). * p<0.05 by unpaired t-test.
Table 2.
FTIR-measured compositional parameters for cortical bone at the posterior midshaft of the tibiae from 12 week-old LC and GorabPrx1 mice.
| Parameters | LC | GorabPrx1 | Difference (%) |
|---|---|---|---|
| Mineral/matrix | 6.58 ± 0.31 | 5.97 ± 0.59 | −9 |
| Carbonate/mineral ×103 | 5.4 ± 0.4 | 5.4± 0.5 | 0 |
| Collagen maturity | 3.54 ± 0.21 | 3.85± 0.42 | 9 |
| Crystallinity | 1.16± 0.02 | 1.15± 0.01 | −1 |
| Acid phosphate | 0.46± 0.02 | 0.51± 0.02 a | 12 |
Data are presented as mean ± SD.
Differences are calculated as (GorabPrx1-LC)/LC×100.
p<0.05 relative to LC.
3.3 Gorab deficiency leads to increased anterior convex curvature
GorabPrx1 tibiae were 21% shorter than LC at the age of 10 weeks (GorabPrx1: 13.5±0.9 mm; LC: 17.1±0.6 mm; p<0.001). GorabPrx1 tibiae had a greater anterior convex curvature compared to LC tibiae while the medial-lateral curvatures were generally similar (Fig. 4). For LC tibiae, the largest anterior-posterior convexity (CAP=1.10±0.03 mm) appeared at the proximal/middle diaphysis (~35% of the tibial length from the proximal end) while this location was shifted to the mid-diaphysis of the tibia (~50% of the tibial length) for GorabPrx1 tibiae (Fig. 4).
Fig. 4.

Comparison of whole-bone curvatures between LC and GorabPrx1 tibiae. The anterior-posterior and medial-lateral longitudinal bone curvatures (CAP and CML) were measured as the perpendicular distances from the centroid of a tibial cross-section to the tibial axis in the anterior-posterior and medial-lateral directions, respectively. Tibial axis was determined by the centroids of the proximal and distal sections.
3.4 Tissue-level strains are increased in tibiae from Gorab deficient compared to LC mice
The mean longitudinal strains measured at the gauge site, located on the medial surface of the tibial midshaft under −5 N loads were 543±196 με and 1147±594 με for LC and GorabPrx1 mice, respectively. The axial rigidity for LC and GorabPrx1 tibiae were 0.0092±0.0033 N/με and 0.0044±0.0023 N/με, respectively. The FE predicted mean longitudinal strain values at the gauge site were similar to experimentally measured strains for both homogeneous (LC: 505±49 με; GorabPrx1: 1191±42 με) and heterogeneous models (LC: 564 με; GorabPrx1: 1068 με).
Under the applied load of −5 N, the tissue-level strains throughout the entire tibia were generally higher for GorabPrx1 than LC mice (Figs. 5 and 6A). At 25% tibial length, the maximum and minimum principal strains for GorabPrx1 were 88% and 83% higher than LC. At 50% tibial length, the maximum and minimum principal strains for GorabPrx1 were 127% and 73% higher than LC. At 75% tibial length, the differences in maximum or minimum principal strains between GorabPrx1 and LC (301% or 117%) were more pronounced relative to the proximal or middle cross-sections (Figs. 5 and 6A). Tissue heterogeneity did not affect the general strain distribution along the tibia for either LC or GorabPrx1 mice, with the exception of the proximal tibia (Fig. 6B). In the proximal metaphysis (~5–20% of bone length) of the homogeneous models, the mean maximum and minimum principal strains in GorabPrx1 tibiae (377±32 με and −558±47 με) were 54% and 42% higher than those of LC tibiae (244±26 με and −395±50 με) (Figs. 6B and 7). In the proximal metaphysis of the heterogeneous models, the mean maximum and minimum principal strains in GorabPrx1 tibiae (757 με and −913 με) were 110% and 61% higher than those of LC tibiae (361 με and −569 με) (Figs. 6B and 7).
Fig. 5.

Computationally predicted principal strain distributions throughout the entire tibia and at multiple representative cross-sections (25%, 37%, 50% and 75% relative to the proximal end) for the LC and GorabPrx1 limbs loaded with 5 N in uniaxial compression in vivo. Red and blue indicate tensile and compressive strains, respectively. Strain gauge was attached on the medial surface of the tibial midshaft to measure the longitudinal strain there experimentally.
Fig. 6.

(A) Variations of the maximum and minimum principal strains along the tibial length for LC and GorabPrx1 tibiae loaded with 5 N in compression. The lines and areas represent mean ± standard deviation of the average (maximum or minimum principal) strain value in each cross-section of the tibia (n=3/genotype); (B) Comparison of strain distributions along the tibial length (proximal end: 0%; distal end: 100%) between homogeneous and heterogeneous FE models for LC and GorabPrx1 tibiae subjected to compression loading of 5 N (n=1/genotype). The lines and areas represent mean ± standard deviation of the maximum or minimum principal strain values in each cross-section of the tibia.
Fig. 7.
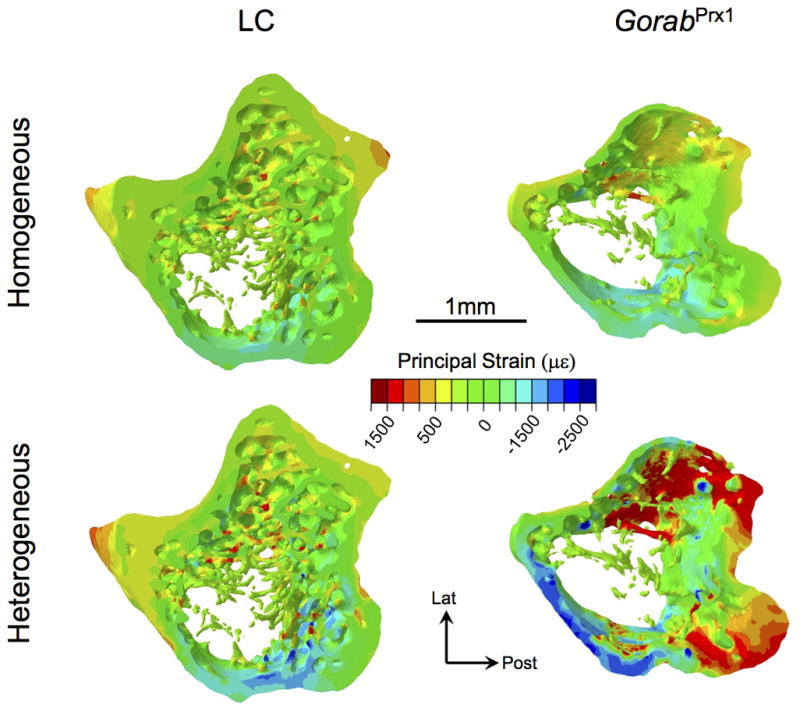
Strain distributions in the proximal metaphysis (starting 100 μm below the distal-most point of the growth plate and extending distally 10% of the tibial length) of both homogeneous and heterogeneous FE models of the LC and GorabPrx1 tibiae. Both tensile (+) and compressive (-) strains are shown.
3.5 Gorab deficiency compromises whole-bone mechanical properties
Tibiae from GorabPrx1 were weaker and more brittle than tibiae from LC (Table 3). The maximum load and stiffness of GorabPrx1 tibiae were 46% and 55% less than LC tibiae, respectively. Work-to-fracture was reduced by 61% in GorabPrx1 compared with LC tibiae. Tibiae from GorabPrx1 had post-yield displacement that was 47% less than tibiae from LC. None of the outcomes were affected by body-weight adjustments (Table 3).
Table 3.
Whole-bone mechanical properties of 12 week-old LC and GorabPrx1 tibiae, measured by three-point bending testing.
| Parameters | Unadjusted | Body weight-adjusted | ||||
|---|---|---|---|---|---|---|
|
| ||||||
| LC | GorabPrx1 | Diff (%) | LC | GorabPrx1 | Diff (%) | |
| Max load (N) | 13.00 ± 1.77 | 6.97 ± 2.71a | −46 | 14.44 ±1.57 | 8.73 ±1.97a | −40 |
| Stiffness (N/mm) | 148.1 ± 21.5 | 67.2 ± 32.1a | −55 | 153.1 ± 21.3 | 85.0 ± 26.0a | −45 |
| Work-to-fracture (Nmm) | 12.50 ± 3.82 | 4.93 ± 4.41a | −61 | 18.22 ± 2.02 | 7.24 ± 3.68a | −60 |
| Post-yield displacement (mm) | 0.48 ± 0.22 | 0.25 ± 0.23a | −47 | 0.71 ± 0.18 | 0.33 ± 0.21a | −54 |
Data are presented as mean ± SD.
Differences are calculated as (GorabPrx1-LC)/LC×100.
p<0.05 relative to LC.
4. Discussion
The current study focused on characterizing morphological, material and mechanical behavior of tibiae from GorabPrx1 mice. This conditional knockout mouse had an increased anterior convexity and decreased cortical cross-sectional area, cortical thickness and moments of inertia, compared to LC tibiae. Three-point bending demonstrated whole-bone strength, stiffness and work-to-fracture of GorabPrx1 tibiae were less than those of LC. Tibiae from GorabPrx1 mice also appeared to be more brittle compared with LC. Tissue compositional measurements showed a decrease in mineral/matrix ratio and an increase in acid phosphate substitution in the mineral particles in the posterior metaphyseal cortex of the GorabPrx1 tibiae, suggesting a delay in tissue mineralization. FE analysis predicted increased tissue-level strains within the GorabPrx1 tibiae relative to LC tibiae when subjected to axial compressive loads of the same magnitude. Overall, the strain distribution along the entire tibia was similar when using homogeneous or heterogeneous material properties in the FE models although a larger difference was found in the proximal metaphysis (Figs. 6B and 7). Furthermore, we saw that the differences between the homogenous and the heterogeneous FE models in the proximal metaphyseal region were more pronounced for the GorabPrx1 model than for the LC. These results are in line with our previous findings in C57BL/6 mice showing that assignment of homogeneous or heterogeneous material properties to the FE model does not affect the general strain distribution along the tibia, with the exception of the proximal metaphysis (Razi et al., 2015; Yang et al., 2014).
The skeletal phenotypic features observed in GorabPrx1 tibiae are generally consistent with clinical reports on GO patients (Al-Gazali et al., 2001; Hennies et al., 2008; Hunter, 1988; Hunter et al., 1978; Lisker et al., 1979; Nanda et al., 2008; Rajab et al., 2008), who have short stature and bowed long bones (tibia and femur) and often experience bone fractures (Rajab et al., 2008). Our current results from tibial morphological measures are in agreement with previous observations of Steiner et al. 2015 (Steiner et al., 2015) showing that Gorab deficiency leads to a retardation of long bone growth and a dramatic reduction in trabecular and cortical bone volumes. Our three-point bending tests showed that GorabPrx1 bones were much weaker and more brittle, suggesting that GorabPrx1 bones are more fragile and therefore may be more susceptible to fractures than LC. This is consistent with a previous report (Steiner et al., 2015) showing that nearly all GorabPrx1 mice in their study experienced spontaneous fractures. We observed that collagen maturity was not affected by Gorab deficiency, but we did observe a delay in mineralization for Gorab deficient bones. The delayed mineralization is supported by preliminary data by Steiner et al. showing that Gorab deficiency may lead to an abnormal modification of extracellular matrix proteins.
Some of the striking alterations in morphology we observed with Gorab deficiency are consistent with chronologically or accelerated aging mice. Studies in C57BL/6 mice show tibial cortical area and thickness increase between 6 weeks and 6 months of age and then decline up to 22 months of age (Galea et al., 2015; Halloran et al., 2002; Patel et al., 2014). The anterior-posterior curvature of the tibiae of female C57BL/6 mice increases with aging, similar to what we have observed in the female premature aged GorabPrx1 mice (Galea et al., 2015; Patel et al., 2014; Razi et al., 2015). Some morphological characteristics of senescence-accelerated mouse strain P6 (SAMP6) long bones overlap with our mouse model (Matsushita et al., 1986; Silva et al., 2002; Silva et al., 2004; Takeda et al., 1981). Relative to LC, we measured largely decreased maximum load, stiffness and work-to-fracture and increased brittleness in GorabPrx1 tibiae. The reduction of whole-bone mechanical properties in GorabPrx1 tibiae is related with decreased cross-sectional area and moment of inertia. The alterations in these measured whole-tibia strength and work-to-fracture are consistent with reports of age-related changes in human bones (Courtney et al., 1995; Martin and Atkinson, 1977), C57BL/6 mice (Almeida et al., 2007; Ferguson et al., 2003; Hamrick et al., 2006) and SAMP6 mice (Silva et al., 2002; Silva et al., 2004).
The curvatures in the long bones augment rather than diminish stress/strain generated in bone (Biewener, 1983, 1991). Although a curved bone is not the most efficient structure to obtain a tradeoff between the opposing objectives of stiffness and lightness (Currey, 2014), it has the benefit of providing loading predictability, i.e. control of the direction of load-induced bending (Bertram and Biewener, 1988). We found that GorabPrx1 mice had increased tibial curvature, as is the case in chronologically aged mice (Galea et al., 2015; Patel et al., 2014; Razi et al., 2015). Although local strain history is a major determinant of the tissue response, it is not known to what extent the bone’s curvature of GorabPrx1 mice is genetically driven or a result of alteration of external mechanical environments and bone tissue material properties.
The microCT-measured TMD was similar between GorabPrx1 and LC tibiae in the midshaft but 2% lower in the metaphyseal cortex and 10% higher in the metaphyseal cancellous bone for GorabPrx1 tibiae. The regional differences in changes of TMD associated with Gorab deficiency could partly be attributed to the different mechanical environments that the bones experience (Yang et al., 2014) or it is also possible that cancellous tissues are more sensitive to genetic perturbation of Gorab than cortical bone. Similar to TMD, we measured greater differences in FTIR parameters (e.g. mineral/matrix) in the proximal relative to mid-diaphyseal regions. Since a greater difference in cross-sectional area between GorabPrx1 and LC tibiae was found in the metaphysis than the mid-diaphysis, it remains unclear if there exists any relationship between the bone geometry and tissue composition and further investigation may be warranted. The acid phosphate substitution increased in both metaphyseal and diaphyseal cortical bone for the GorabPrx1 tibiae. These tissue compositional changes are not in line with age-related changes in human bone composition, where the mineral/matrix ratio increases and acid phosphate content decreases with chronological aging (Boskey, 2013; Gamsjaeger et al., 2014). Bone composition in GorabPrx1 tibiae is also not consistent with what has been reported in osteogenesis imperfecta (Type VII and VIII), whereby mineral/matrix increases (Lindahl et al., 2011; Vanleene et al., 2011). Further investigations are necessary to understand the mechanism(s) responsible for the altered bone composition in GorabPrx1 mice.
Our study has limitations. Mice cortical bone, unlike humans lacks Haversian remodeling (Jilka, 2013). However, mice models, particularly the C57BL/6 mouse strain share many characteristics of human skeletal aging such as cortical thinning, increased cortical porosity, and cancellous bone loss (Jilka, 2013). The accuracy of the three-point bending tests may have been affected by our choice of such a large load cell and choice of using the same span length for both genotypes. Also, tibiae were tested in the anterior-posterior direction with three-point bending, which may cause local buckling and violate beam theory assumption when estimating tissue mechanical properties. However, we remain confident in our general findings given the large differences we observed between LC and GorabPrx1 bones. Lastly, outcome measures were performed on two ages, 10 and 12 week-old mice, which encompasses a time of rapid growth. Future two-week in vivo tibial loading studies are planned and thus these ages were chosen since they represent the onset and end point of those experiments.
In summary, we measured striking alterations in morphological, material, and mechanical properties associated with Gorab deficiency. GorabPrx1 tibiae have increased anterior curvature, decreased cortical cross-sectional area and moments of inertia, compromised whole-bone strength, increased tissue-level strains and delayed mineralization, compared to LC tibiae. Many of these characteristics recapitulate aging-related changes in the human skeleton or in other animal models of chronological aging. These data in this conditional mouse model provide valuable insights into how changes in bone strength and composition may be affecting human patients with GO, thereby contributing to their osteoporotic phenotype.
Acknowledgments
This study was supported by the German Federal Ministry of Education and Research (TP5/DIMEOs), German Research Foundation (WI3761/4-1, CH1123/4-1, KO2891/4-1, FOR2165), National Institutes of Health (AR041325, AR046121), European Community’s Seventh Framework Programme (SYBIL:602300), National Natural Science Foundation of China (11702008), Beijing University of Technology Seed Fund for International Collaboration (015000514117514), Shriners Hospitals for Children, and Réseau de recherche en santé buccodentaire et osseuse recruitment aid program.
Footnotes
Conflict of Interest
The authors have no conflict of interest.
Publisher's Disclaimer: This is a PDF file of an unedited manuscript that has been accepted for publication. As a service to our customers we are providing this early version of the manuscript. The manuscript will undergo copyediting, typesetting, and review of the resulting proof before it is published in its final citable form. Please note that during the production process errors may be discovered which could affect the content, and all legal disclaimers that apply to the journal pertain.
References
- Albiol L, Pflanz D, Cilla M, Kramer I, Kneissel M, Duda G, Zaslansky P, Willie BM, Checa S. Sost deficiency leads to a reduction in the mechanical strains induced within the mouse tibia. Proceedings of the Orthopaedic Research Society Annual Meeting; San Diego, California. 2017. [Google Scholar]
- Al-Bughaili M, Neuhann TM, Flottmann R, Mundlos S, Spielmann M, Kornak U, Fischer-Zirnsak B. A de novo 1q23.3–q24.2 deletion combined with a GORAB missense mutation causes a distinctive phenotype with cutis laxa. J Hum Genet. 2017;62:325–328. doi: 10.1038/jhg.2016.111. [DOI] [PubMed] [Google Scholar]
- Al-Gazali LI, Sztriha L, Skaff F, Haas D. Gerodermia osteodysplastica and wrinkly skin syndrome: are they the same? Am J Med Genet. 2001;101:213–220. doi: 10.1002/ajmg.1352. [DOI] [PubMed] [Google Scholar]
- Almeida M, Han L, Martin-Millan M, Plotkin LI, Stewart SA, Roberson PK, Kousteni S, O’Brien CA, Bellido T, Parfitt AM, Weinstein RS, Jilka RL, Manolagas SC. Skeletal involution by age-associated oxidative stress and its acceleration by loss of sex steroids. The Journal of biological chemistry. 2007;282:27285–27297. doi: 10.1074/jbc.M702810200. [DOI] [PMC free article] [PubMed] [Google Scholar]
- Bertram JE, Biewener AA. Bone curvature: sacrificing strength for load predictability? Journal of theoretical biology. 1988;131:75–92. doi: 10.1016/s0022-5193(88)80122-x. [DOI] [PubMed] [Google Scholar]
- Biewener AA. Allometry of quadrupedal locomotion: the scaling of duty factor, bone curvature and limb orientation to body size. The Journal of experimental biology. 1983;105:147–171. doi: 10.1242/jeb.105.1.147. [DOI] [PubMed] [Google Scholar]
- Biewener AA. Musculoskeletal design in relation to body size. Journal of biomechanics. 1991;24(Suppl 1):19–29. doi: 10.1016/0021-9290(91)90374-v. [DOI] [PubMed] [Google Scholar]
- Boskey A, Pleshko Camacho N. FT-IR imaging of native and tissue-engineered bone and cartilage. Biomaterials. 2007;28:2465–2478. doi: 10.1016/j.biomaterials.2006.11.043. [DOI] [PMC free article] [PubMed] [Google Scholar]
- Boskey AL. Bone composition: relationship to bone fragility and antiosteoporotic drug effects. Bonekey Rep. 2013;2:447. doi: 10.1038/bonekey.2013.181. [DOI] [PMC free article] [PubMed] [Google Scholar]
- Courtney AC, Wachtel EF, Myers ER, Hayes WC. Age-related reductions in the strength of the femur tested in a fall-loading configuration. J Bone Joint Surg Am. 1995;77:387–395. doi: 10.2106/00004623-199503000-00008. [DOI] [PubMed] [Google Scholar]
- Currey JD. The mechanical adaptations of bones. Princeton University Press; 2014. [Google Scholar]
- De Souza RL, Matsuura M, Eckstein F, Rawlinson SC, Lanyon LE, Pitsillides AA. Non-invasive axial loading of mouse tibiae increases cortical bone formation and modifies trabecular organization: a new model to study cortical and cancellous compartments in a single loaded element. Bone. 2005;37:810–818. doi: 10.1016/j.bone.2005.07.022. [DOI] [PubMed] [Google Scholar]
- Egerer J, Emmerich D, Fischer-Zirnsak B, Chan WL, Meierhofer D, Tuysuz B, Marschner K, Sauer S, Barr FA, Mundlos S, Kornak U. GORAB Missense Mutations Disrupt RAB6 and ARF5 Binding and Golgi Targeting. J Invest Dermatol. 2015;135:2368–2376. doi: 10.1038/jid.2015.192. [DOI] [PubMed] [Google Scholar]
- Ferguson VL, Ayers RA, Bateman TA, Simske SJ. Bone development and age-related bone loss in male C57BL/6J mice. Bone. 2003;33:387–398. doi: 10.1016/s8756-3282(03)00199-6. [DOI] [PubMed] [Google Scholar]
- Galea GL, Hannuna S, Meakin LB, Delisser PJ, Lanyon LE, Price JS. Quantification of Alterations in Cortical Bone Geometry Using Site Specificity Software in Mouse models of Aging and the Responses to Ovariectomy and Altered Loading. Front Endocrinol (Lausanne) 2015;6:52. doi: 10.3389/fendo.2015.00052. [DOI] [PMC free article] [PubMed] [Google Scholar]
- Gamsjaeger S, Brozek W, Recker R, Klaushofer K, Paschalis EP. Transmenopausal changes in trabecular bone quality. Journal of bone and mineral research. 2014;29:608–617. doi: 10.1002/jbmr.2073. [DOI] [PubMed] [Google Scholar]
- Glorieux FH, Moffatt P. Osteogenesis imperfecta, an ever-expanding conundrum. Journal of bone and mineral research. 2013;28:1519–1522. doi: 10.1002/jbmr.1982. [DOI] [PubMed] [Google Scholar]
- Halloran BP, Ferguson VL, Simske SJ, Burghardt A, Venton LL, Majumdar S. Changes in bone structure and mass with advancing age in the male C57BL/6J mouse. Journal of bone and mineral research. 2002;17:1044–1050. doi: 10.1359/jbmr.2002.17.6.1044. [DOI] [PubMed] [Google Scholar]
- Hamrick MW, Ding KH, Pennington C, Chao YJ, Wu YD, Howard B, Immel D, Borlongan C, McNeil PL, Bollag WB, Curl WW, Yu J, Isales CM. Age-related loss of muscle mass and bone strength in mice is associated with a decline in physical activity and serum leptin. Bone. 2006;39:845–853. doi: 10.1016/j.bone.2006.04.011. [DOI] [PubMed] [Google Scholar]
- Hennies HC, Kornak U, Zhang H, Egerer J, Zhang X, Seifert W, Kuhnisch J, Budde B, Natebus M, Brancati F, Wilcox WR, Muller D, Kaplan PB, Rajab A, Zampino G, Fodale V, Dallapiccola B, Newman W, Metcalfe K, Clayton-Smith J, Tassabehji M, Steinmann B, Barr FA, Nurnberg P, Wieacker P, Mundlos S. Gerodermia osteodysplastica is caused by mutations in SCYL1BP1, a Rab-6 interacting golgin. Nature genetics. 2008;40:1410–1412. doi: 10.1038/ng.252. [DOI] [PMC free article] [PubMed] [Google Scholar]
- Hunter AG. Is geroderma osteodysplastica underdiagnosed? J Med Genet. 1988;25:854–857. doi: 10.1136/jmg.25.12.854. [DOI] [PMC free article] [PubMed] [Google Scholar]
- Hunter AG, Martsolf JT, Baker CG, Reed MH. Geroderma osteodysplastica. A report of two affected families. Hum Genet. 1978;40:311–324. doi: 10.1007/BF00272192. [DOI] [PubMed] [Google Scholar]
- Jepsen KJ, Silva MJ, Vashishth D, Guo XE, van der Meulen MC. Establishing biomechanical mechanisms in mouse models: practical guidelines for systematically evaluating phenotypic changes in the diaphyses of long bones. Journal of bone and mineral research. 2015;30:951–966. doi: 10.1002/jbmr.2539. [DOI] [PMC free article] [PubMed] [Google Scholar]
- Jilka RL. The relevance of mouse models for investigating age-related bone loss in humans. The journals of gerontology. Series A, Biological sciences and medical sciences. 2013;68:1209–1217. doi: 10.1093/gerona/glt046. [DOI] [PMC free article] [PubMed] [Google Scholar]
- Lindahl K, Barnes AM, Fratzl-Zelman N, Whyte MP, Hefferan TE, Makareeva E, Brusel M, Yaszemski MJ, Rubin CJ, Kindmark A, Roschger P, Klaushofer K, McAlister WH, Mumm S, Leikin S, Kessler E, Boskey AL, Ljunggren O, Marini JC. COL1 C-propeptide cleavage site mutations cause high bone mass osteogenesis imperfecta. Hum Mutat. 2011;32:598–609. doi: 10.1002/humu.21475. [DOI] [PMC free article] [PubMed] [Google Scholar]
- Lisker R, Hernandez A, Martinez-Lavin M, Mutchinick O, Armas C, Reyes P, Robles-Gil J. Gerodermia osteodysplastica hereditaria: report of three affected brothers and literature review. Am J Med Genet. 1979;3:389–395. doi: 10.1002/ajmg.1320030410. [DOI] [PubMed] [Google Scholar]
- Logan M, Martin JF, Nagy A, Lobe C, Olson EN, Tabin CJ. Expression of Cre Recombinase in the developing mouse limb bud driven by a Prxl enhancer. Genesis. 2002;33:77–80. doi: 10.1002/gene.10092. [DOI] [PubMed] [Google Scholar]
- Main RP, Lynch ME, van der Meulen MC. In vivo tibial stiffness is maintained by whole bone morphology and cross-sectional geometry in growing female mice. Journal of biomechanics. 2010;43:2689–2694. doi: 10.1016/j.jbiomech.2010.06.019. [DOI] [PMC free article] [PubMed] [Google Scholar]
- Martin RB, Atkinson PJ. Age and sex-related changes in the structure and strength of the human femoral shaft. Journal of biomechanics. 1977;10:223–231. doi: 10.1016/0021-9290(77)90045-8. [DOI] [PubMed] [Google Scholar]
- Matsushita M, Tsuboyama T, Kasai R, Okumura H, Yamamuro T, Higuchi K, Higuchi K, Kohno A, Yonezu T, Utani A, et al. Age-related changes in bone mass in the senescence-accelerated mouse (SAM). SAM-R/3 and SAM-P/6 as new murine models for senile osteoporosis. Am J Pathol. 1986;125:276–283. [PMC free article] [PubMed] [Google Scholar]
- Nanda A, Alsaleh QA, Al-Sabah H, Marzouk EE, Salam AM, Nanda M, Anim JT. Gerodermia osteodysplastica/wrinkly skin syndrome: report of three patients and brief review of the literature. Pediatr Dermatol. 2008;25:66–71. doi: 10.1111/j.1525-1470.2007.00586.x. [DOI] [PubMed] [Google Scholar]
- Nistala H, Lee-Arteaga S, Carta L, Cook JR, Smaldone S, Siciliano G, Rifkin AN, Dietz HC, Rifkin DB, Ramirez F. Differential effects of alendronate and losartan therapy on osteopenia and aortic aneurysm in mice with severe Marfan syndrome. Hum Mol Genet. 2010;19:4790–4798. doi: 10.1093/hmg/ddq409. [DOI] [PMC free article] [PubMed] [Google Scholar]
- Patel TK, Brodt MD, Silva MJ. Experimental and finite element analysis of strains induced by axial tibial compression in young-adult and old female C57Bl/6 mice. Journal of biomechanics. 2014;47:451–457. doi: 10.1016/j.jbiomech.2013.10.052. [DOI] [PMC free article] [PubMed] [Google Scholar]
- Rajab A, Kornak U, Budde BS, Hoffmann K, Jaeken J, Nurnberg P, Mundlos S. Geroderma osteodysplasticum hereditaria and wrinkly skin syndrome in 22 patients from Oman. Am J Med Genet A. 2008;146A:965–976. doi: 10.1002/ajmg.a.32143. [DOI] [PubMed] [Google Scholar]
- Razi H, Birkhold AI, Zaslansky P, Weinkamer R, Duda GN, Willie BM, Checa S. Skeletal maturity leads to a reduction in the strain magnitudes induced within the bone: a murine tibia study. Acta biomaterialia. 2015;13:301–310. doi: 10.1016/j.actbio.2014.11.021. [DOI] [PubMed] [Google Scholar]
- Silva MJ, Brodt MD, Ettner SL. Long bones from the senescence accelerated mouse SAMP6 have increased size but reduced whole-bone strength and resistance to fracture. Journal of bone and mineral research. 2002;17:1597–1603. doi: 10.1359/jbmr.2002.17.9.1597. [DOI] [PubMed] [Google Scholar]
- Silva MJ, Brodt MD, Fan Z, Rho JY. Nanoindentation and whole-bone bending estimates of material properties in bones from the senescence accelerated mouse SAMP6. Journal of biomechanics. 2004;37:1639–1646. doi: 10.1016/j.jbiomech.2004.02.018. [DOI] [PubMed] [Google Scholar]
- Steiner MCH, Schinke T, Eppendorf H, Amling M, Chan D, Mundlos S, Kornak U. Dysregulated TGF-β signaling and oxidative DNA damage as the cause for osteoporosis in the progeroid disorder gerodermia osteodysplastica. Journal of bone and mineral research. 2015;30(Suppl 1) [Google Scholar]
- Sugiyama T, Meakin LB, Browne WJ, Galea GL, Price JS, Lanyon LE. Bones’ adaptive response to mechanical loading is essentially linear between the low strains associated with disuse and the high strains associated with the lamellar/woven bone transition. Journal of bone and mineral research. 2012;27:1784–1793. doi: 10.1002/jbmr.1599. [DOI] [PMC free article] [PubMed] [Google Scholar]
- Takeda T, Hosokawa M, Takeshita S, Irino M, Higuchi K, Matsushita T, Tomita Y, Yasuhira K, Hamamoto H, Shimizu K, Ishii M, Yamamuro T. A new murine model of accelerated senescence. Mech Ageing Dev. 1981;17:183–194. doi: 10.1016/0047-6374(81)90084-1. [DOI] [PubMed] [Google Scholar]
- Vanleene M, Saldanha Z, Cloyd KL, Jell G, Bou-Gharios G, Bassett JH, Williams GR, Fisk NM, Oyen ML, Stevens MM, Guillot PV, Shefelbine SJ. Transplantation of human fetal blood stem cells in the osteogenesis imperfecta mouse leads to improvement in multiscale tissue properties. Blood. 2011;117:1053–1060. doi: 10.1182/blood-2010-05-287565. [DOI] [PubMed] [Google Scholar]
- Willie BM, Birkhold AI, Razi H, Thiele T, Aido M, Kruck B, Schill A, Checa S, Main RP, Duda GN. Diminished response to in vivo mechanical loading in trabecular and not cortical bone in adulthood of female C57Bl/6 mice coincides with a reduction in deformation to load. Bone. 2013;55:335–346. doi: 10.1016/j.bone.2013.04.023. [DOI] [PubMed] [Google Scholar]
- Yang H, Butz KD, Duffy D, Niebur GL, Nauman EA, Main RP. Characterization of cancellous and cortical bone strain in the in vivo mouse tibial loading model using microCT-based finite element analysis. Bone. 2014;66:131–139. doi: 10.1016/j.bone.2014.05.019. [DOI] [PubMed] [Google Scholar]
- Yang H, Embry RE, Main RP. Effects of loading duration and short rest insertion on cancellous and cortical bone adaptation in the mouse tibia. PloS one. 2017;12:e0169519. doi: 10.1371/journal.pone.0169519. [DOI] [PMC free article] [PubMed] [Google Scholar]