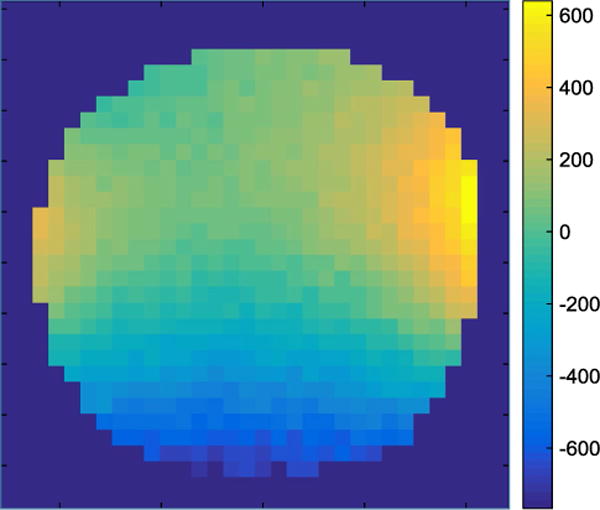
Fig. 5.

B0 field map of the constructted magnet; isocenter cross-section as in Fig. 2. The color map shows inhomogeneity in ppm. Imaging parameters: field of view (FoV) 100 mm × 100 mm, bandwidth 500 Hz, TE = 20 ms, TR = 100 ms, slice thickness 20 mm, and no averages
