Abstract
Multiplexed optical encoding is emerging as a powerful technique for high-throughput cellular analysis and molecular assays. Most of the developed optical barcodes, however, either suffer from large particle size or are incompatible with most commercial optical instruments. Here, a new type of nanoscale fluorescent barcode (Pdot barcodes) was prepared from semiconducting polymers. The Pdot barcodes possess the merits of small size (~20 nm in diameter), narrow emission bands (full-width-at-half-maximum (fwhm) of 30–40 nm), three-color emissions (blue, green, and red) under single-wavelength excitation, a high brightness, good pH and thermal stability, and efficient cellular uptake. The Pdot barcodes were prepared using a three-color and six-intensity encoding strategy; for ratiometric readout of the barcodes, one of the colors might be used as an internal reference. We used the Pdot barcodes to label 20 sets of cancer cells and then distinguished and identified each set based on the Pdot barcodes using flow cytometry. We also monitored and tracked single cells labeled with different Pdot barcodes, even through rounds of cell division. These results suggest Pdot barcodes are strong candidates for discriminating different labeled cell and for long-term cell tracking.
Graphical abstract
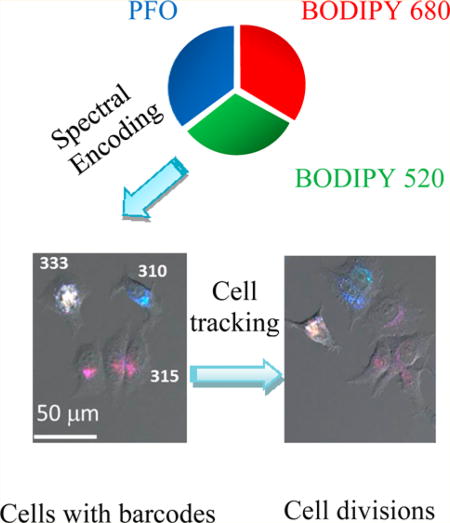
Small-sized fluorescent Pdot barcodes (~20 nm in diameter) with narrow emission bands (full-width-at-half-maximum (fwhm) of 30–40 nm) were constructed on the basis of spectral-intensity encoding of three types of semiconducting polymers for multiplexed imaging and tracking of single cancer cells. Simultaneous identification of a large number of biological species is of great importance in cell research,1 medical diagnostics,2 and therapeutic treatments. For instance, tracking of multiple tumor cells in vivo can help to understand the development, tropism, invasion, and metastasis of cancer cells,3 as well as to find ways to effectively inhibit their growth and metastasis to distal sites.4 Considerable effort has been devoted to the development of multiplexed detection technologies. One strategy is to use different probes that work separately for multiplexed labeling.5 Other strategies include integrating the probes onto different regions of planar substrates to function as a whole, such as graphene films decorated with nanoparticles (NPs),6 solution-based electronic circuits on chips,7 DNA nanostructure-based microarray,8 and microfluidic systems.9 However, the capacity of multiplexed detection is substantially limited by the number of available probes. As an alternative to using probes separately, an encoding strategy that uses probes in a combinatorial fashion can produce plentiful labels to enable high-throughput analysis with minimal assay time. The encoded signals could be magnetic10 and transmitted electronic signals,11 optical,12 DNA sequence based,13 or some combination of signals.14 Fluorescence-based spectral encoding probably is one of the most widely adopted strategies because of its compatibility with standard fluorescence instruments, such as flow cytometry.15 For spectral encoding based on conventional organic fluorophores (e.g., dyes and fluorescent proteins), the multiplexing ability is usually undermined first by their broad and overlapping emission bands and second by their brightness. The drawback of spectral overlap and brightness could be circumvented in part with spectral-intensity encoding by confining different fluorophores to microspheres16 or NPs.17 Here, organic fluorophores or fluorescent NPs such as semiconductor quantum dots (QDs) have been embedded into polystyrene18 or silica microbeads19 to create optical barcodes or even have been directly applied to cells to stain them by random uptake to generate optically encoded cells.20 As thousands of QDs with different emission colors can be incorporated into one micrometer sized bead, the bead emits very strong fluorescence and also the potential code set created with spectral-intensity encoding is very large.
Biological applications of QDs-based encoding, however, are hampered by cytotoxicity of heavy metal ions. However, more importantly, the large size of the optically encoded beads excludes themselves from many applications, such as intracellular labeling.21 Lanthanide-doped upconverting NPs are another candidate for fluorescent barcodes because they have line-like emissions, long excitation wavelength in near-infrared range, and tunable multicolor emissions by the material composition or surface layer.22 Multiplexed imaging by using encoded upconverting NPs has been successfully accomplished in living cells,23 but the low quantum efficiency and incompatibility with most commercial instruments impede the wide application of optical encoding strategy based on upconverting NPs.
Semiconducting polymer dots (Pdots), formed from highly fluorescent conjugated polymers, have become highly attractive for biological and biomedical imaging.24 Pdots possess large absorption cross sections, exceptional brightness, high photostability, and efficient cellular uptake and internalization by cells. These attributes inspired us to develop fluorescent nanoscale spectral-intensity barcodes from Pdots. However, energy transfer in Pdots is very efficient, not only through intrachain and interchain FRET based on spectral overlap between the donor and the acceptor but also through exciton-diffusion assisted and through-bond energy transfer that even do not need spectral overlap.24c The number of Pdot-based barcodes is thus limited as short-wavelength fluorescence is quenched by emitters with long-wavelength absorption. Recently, we reported a type of boron dipyrrin (BODIPY)-based Pdots that exhibit narrow emission bands (full width at half-maximum of ~40 nm) comparable to QDs.25 Such BODIPY polymers should be ideal candidates for the construction of Pdot barcode because (i) the chance of spectral overlap between different BODIPY emitters is small as their absorption and emission band is very sharp and (ii) the intrachain energy transfer of exciton-diffusion assisted and through-bond would be greatly diminished since the BODIPY dyes are conjugated to different polymer chains separately.
In this study, encoded fluorescent Pdots (~20 nm in diameter) were successfully prepared from blending poly(9,9-dioctylfluorenyl-2,7-diyl) (PFO) with the other two kinds of BODIPY polymers for multiplexed tracking of live tumor cells. The Pdot optical barcodes provided three-color fluorescence (blue, green, red) under single-wavelength excitation. Fluorescence intensity of each color could be tuned by changing the blending ratio of the three polymers. As a proof of concept, up to 20 barcodes were generated. MCF-7 human breast cancer cells labeled with these spectral-intensity barcodes could be clearly discriminated by flow cytometry and fluorescence microscopy. Moreover, MCF-7 cells labeled with different Pdot barcodes could be simultaneously monitored by fluorescence microscopy through rounds of cell division.
EXPERIMENTAL SECTION
Materials
All of the chemicals and solvents were purchased from Sigma-Aldrich (St. Louis, MO, USA) and TCI America company (Portland, OR, USA) unless indicated otherwise. Poly(9,9-dioctylfluorene) (PFO) (average MW 147 000, polydispersity 3.0) was purchased from ADS Dyes, Inc. (Quebec, Canada). BODIPY 520 dye, BODIPY 680 dye, and BODIPY 520-fluorene copolymer were synthesized according to our previously published protocols.1 Polystyrene grafted ethylene oxide functionalized with carboxyl groups (PS-PEGCOOH, main chain MW 8500, graft chain MW 1200, total chain MW 21 700, polydispersity 1.25) was purchased from Polymer Source Inc. (Quebec, Canada). Streptavidin was purchased from Invitrogen (Eugene, OR, USA). Quantum Dot 525 was purchased from Life Technologies Corporation of Thermo Fisher Scientific (Carlsbad, CA, USA). All chemicals were used as received without further purification. High purity Milli-Q water (18.2 MΩ·cm) was used throughout the experiments.
Synthesis of BODIPY 680-Fluorene Copolymer
In a glovebox under nitrogen atmosphere, a dry, 25 mL round-bottom flask with stir bar was charged with 248 mg (0.9 mmol) of bis(1,5-cyclooctadiene) nickel (0), 97 mg (0.9 mmol) of cyclooctadiene, and 140 mg (0.9 mmol) of by pyridine in 4.0 mL of a 1:1 mixture of toluene and DMF. A dark purple color developed. The solution was heated to 60 °C for 30 min. A dry, 20 mL glass vial was charged with 16.5 mg (0.02 mmol) of BODIPY monomer and 199.6 mg (0.38 mmol) of 9,9-dioctyl-2,7-dibromofluorene in 4.0 mL of a 1:1 mixture of toluene and DMF as reaction solution. The reaction solution was added dropwise into the flask containing the catalyst mixture mentioned above.
The flask containing this solution was covered with foil to protect it from light. The reaction mixture was refluxed for 3 days. Then, 10 drops of bromobenzene was added to end-cap the polymer chain, and the reaction was stirred for an additional 12 h at 60 °C. The product was diluted with 50 mL of toluene and washed with 15 wt % of aqueous sodium thiosulfate solution (3 × 50 mL) followed by washing with DI water and drying over MgSO4 to remove the residual bromine from polymer. The polymer solution was rotary evaporated and dissolved in chloroform. After the polymer solution was filtered, the concentrated polymer solution in chloroform was poured into 100 mL of MeOH. The formed precipitate was filtered and dried in a vacuum oven overnight.
The polymer was obtained as dark green solid with a yield of 76.2% (122 mg). 1H NMR (500 MHz, CDCl3): δ 7.87–7.86 (m, 6 H), 7.72–7.70 (m, 5H), 7.46–7.35 (m, 2H), 7.20 (m, 2H), 7.07 (m, 2H), 2.32 (s, 4H), 2.15 (m, 4H), 1.60 (s, 4H), 1.23–1.16 (m, 40 H), 0.84 (m, 6H). Molecular weight information obtained by GPC: Mn, 31 279; Mw, 95 594; PDI, 3.06.
Preparation of Pdot Barcodes
The Pdot barcodes were prepared with a modified nanoprecipitation method. Typically, 1 mL of polymer solution (100 ppm, in THF) consisting of PFO, BODIPY 520, BODIPY 680, and PS-PEG-COOH was injected into 10 mL of water under ultrasonication. The feeding ratio of PFO/BODIPY 520/BODIPY 680 was varied according to the output barcode, while the concentration of PS-PEG-COOH was kept at 20 wt % constantly. The resultant solution was bubbled by N2 flow at 90 °C to remove THF and concentrated to a 4–5 mL volume. The residue solution was passed through a 0.2 µm filter (Radnor, PA, USA) to get rid of aggregates. The prepared Pdot barcodes were well dispersed in water and stable for months without aggregation.
Characterization of Pdots
The Pdot solution’s optical properties including the UV–vis absorption spectra, fluorescence spectra, and fluorescence quantum yields were recorded by a DU 720 scanning spectrophotometer from Beckman Coulter, Inc. (Brea, CA, USA), Fluorolog-3 fluorometer from HORIBA Jobin Yvon Inc. (Edison, NJ, USA), and Hamamatsu photonic multichannel analyzer C10027 equipped with a CCD integrating sphere, respectively. The hydrodynamic size and particle images were provided by a dynamic light scattering instrument (NanoS Zetasizer) from Malvern (Westborough, MA, USA) and transmission electron microscope (Tecnai F20) from FEI (Hillsboro, OR, USA), respectively.
Cell Culture
We bought the breast cancer cell line MCF-7 cell and cell culture medium from American Type Culture Collection (Manassas, VA, USA). The MCF-7 cells were cultured in culture flasks at 37 °C with 5% CO2 in Eagle’s minimum essential medium (EMEM, pH 7.0–7.4) (with l-glutamine) supplemented with 10% fetal bovine serum and 1% penicillin (50 U/mL)–streptomycin (5 µg/mL) solution to ~80% confluency before use.
Loading Pdots into Cells via Endocytosis
For endocytosis experiments, ~105 cells were cultured on a 35 × 10 mm Petri dish for 2 days to reach ~80% confluency. 2 ppm Pdot barcodes were introduced in the Petri dish. The cells and Pdots were incubated for 2 days in a cell incubator (37 °C with 5% CO2) for further uptake of Pdots. After 2 days, the excess Pdots were removed by washing with cell culture medium at least three times.
Flow Cytometry Measurements
To harvest the Pdot-labeled cells, the cells were incubated in 0.5 mL of trypsin–EDTA solution (0.25 w/v % trypsin, 2.5 g/L EDTA) at 37 °C for 5–10 min. The suspended cells were then collected by centrifugation (2500 rpm for 10 min) and washed twice with labeling buffer. Finally, the labeled cells were resuspended in fixing buffer (1× PBS, pH 7.4, 2 mM EDTA, 1% BSA, 1% paraformaldehyde) for at least 15 min before flow-cytometry experiments.
The flow cytometry setup used was a LSRII (BD Bioscience, San Jose, CA, USA), which included an excitation wavelength of 405 nm (100 mW laser) and the band-pass filters of 450/50, 525/50, and 670/30 nm to collect blue, green, and red fluorescence, respectively. Representative populations of cells were selected by an appropriate gate. Detection and collection of cell fluorescence signal continued until 104 cell events were acquired in the active gate. Data analysis was carried out by a FlowJo Software (Tree Star, Inc., Ashland, OR, USA).
Celluar Imaging via Confocal Microscopy
The Pdot-labeled cells cultured in a Petri dish with a glass bottom were directly imaged under a commercial confocal microscope (in EMEM, pH 7.0–7.4). A Zeiss LSM 510 (Jena, Germany) was used to observe the endocytosis of Pdots and to demonstrate the cell tracking. A 405 nm laser (30 mW) with 20% transmission was used as the excitation source. The blue, green, and red channels were used to collect corresponding fluorescence through the band-pass filters of 420–480 and 505–550 nm and the long-pass filter of 650 nm, respectively.
RESULTS AND DISCUSSION
Construction and Characterization of Pdot Barcodes
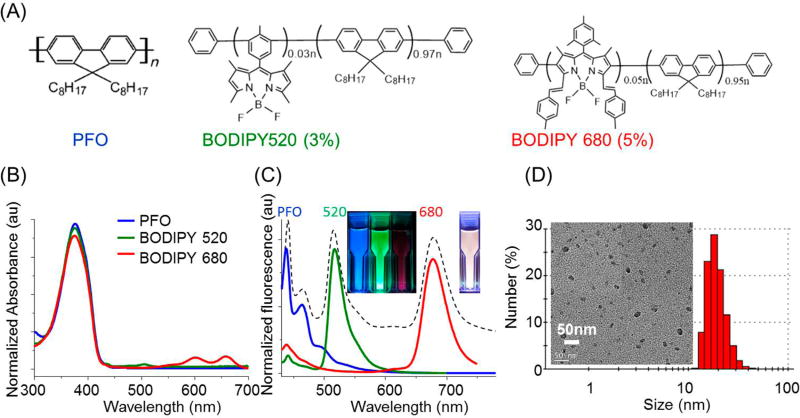
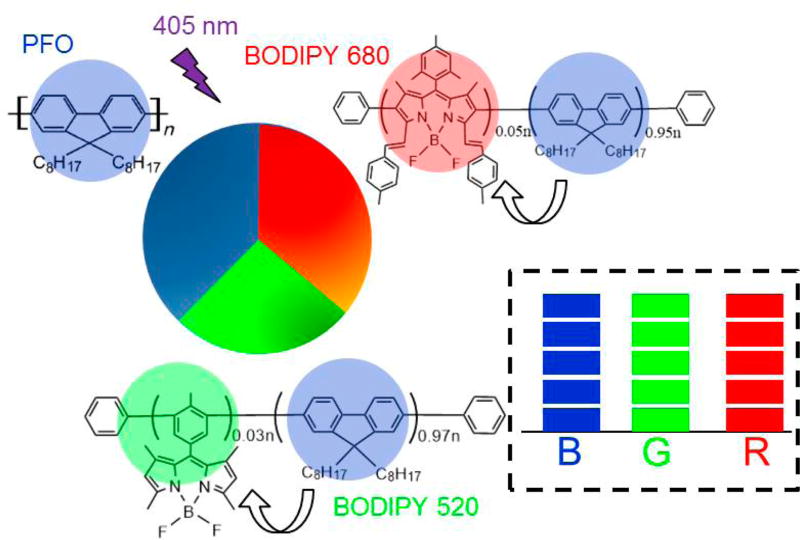
The fluorescent semiconducting polymers used were PFO, boron dipyrrin 520 (BODIPY 520), and boron dipyrrin 680 (BODIPY 680). As shown by the chemical structures in Figure 1A, the two BODIPY polymers were based on PFO but incorporated 3% or 5% BODIPY units on the polymer backbone (see Supporting Information for NMR data). The BODIPY polymers were designed according to a donor–acceptor strategy. Once Pdots were formed, energy transfer from dioctylfluorenyl units to emissive BODIPY units occurred to generate either green or red emission.
Figure 1.
Characteristics of Pdot spectral-intensity barcodes. (A) Chemical structures, (B) absorption spectra, and (C) fluorescence spectra of the three Pdots formed from PFO, BODIPY 520, and BODIPY 680 polymers, respectively. In (C), the dashed line corresponds to a typical Pdot made with the three polymers; the insets show the three single-color Pdots (left inset) and optically encoded Pdots (right inset) suspended in aqueous solution under UV irradiation. (D) Dynamic light scattering and transmission electron micrograph (inset) of the Pdot barcode shown in (C).
Single-color Pdots were first prepared by a modified nanoprecipitation method. Polymers were dissolved in the solvent THF at a certain concentration and then injected into water under sonication. Pdots formed because there was a sudden decrease in solubility and hydrophobic interactions occurred between the semiconducting polymer chains. Figure 1B shows absorption spectra of Pdots derived from the three different semiconducting polymers. BOPIDY 520 and 680 possessed the same strong absorption as PFO, peaking at ~375 nm. Upon 405 nm excitation, the three kinds of Pdots gave blue (440 nm), green (520 nm), and deep red (680 nm) fluorescence with narrow full-width-at-half-maximum (fwhm) of ~40 nm (effective fwhm, Figure S-1), ~30 nm, and ~40 nm, respectively (Figure 1C). The fluorescence quantum yields of BODIPY 520 and BODIPY 680 Pdots were measured to be 34% and 16%, respectively.
The intense multicolor narrow emission of the three Pdots paved the way for spectral-intensity encoding. Pdot barcodes were constructed on the basis of the relative weight percentage of polymers in particles, as illustrated in Scheme 1. Numerous Pdot optical barcodes could be generated by tuning the blending ratio of the different polymers. Figure 1C shows the emission spectrum of a representative Pdot barcode (dashed line). As expected, the optically encoded Pdots simultaneously emitted blue, green, and red fluorescence under single wavelength excitation that could be visualized by the white fluorescence (right inset in Figure 1C). The size of the Pdot barcodes was determined to be around 20 nm in diameter (Figure 1D). The Pdots also showed great photostability, comparable to Qdots (Figure S-2), implying the feasibility of long-term intracellular monitoring.
Scheme 1.
Formation of Triple-Color Pdot Spectral-Intensity Barcodes
To our knowledge, these multicolor spectral-intensity encoded Pdots are the smallest fluorescent barcodes reported so far. They are promising for multiplexed biomedical imaging in that (i) nanoscale Pdots interfere less with cellular behaviors and are compatible with intracellular labeling, (ii) the narrow bandwidth and high brightness helps to acquire high-resolution images, (iii) single-wavelength excitation (405 nm) significantly lowers the requirement of light sources, and (iv) the three-color emission is compatible with most imaging instruments based on RGB visualization.
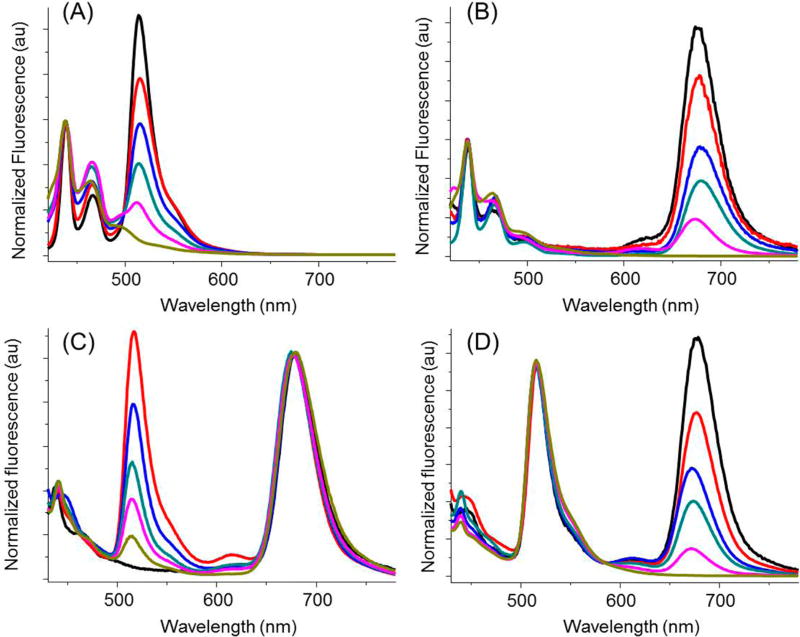
Theoretically, n intensity levels with m colors give (nm − 1) codes. In terms of the BODIPY Pdots that are brighter than commercial QDs,25 10 intensity levels and 3 colors would result in 999 codes. However, the encoding capacity of Pdots was substantially lowered because of fluorescence intensity variation, because the number of embedded polymers varied slightly from particle to particle. This variability in fluorescent intensity, however, does not affect our ability to decode the barcodes accurately because of the ratiometric nature of the readout. On the basis of the calibration plot of feeding ratio and fluorescence intensity ratio of Pdots (Figure S-3), the optimal number of intensity levels was empirically determined to be 6. Large intervals between intensity levels helped to reduce the influence of intensity variations between Pdots. Figure 2 shows the emission spectra of Pdot barcodes featured with 6 intensity levels. The intensity of single color (green or red) could be tuned from level 0 to level 5 while the other two colors remained roughly constant, demonstrating the encoding ability of Pdots. As for the blue emission originating from the dioctylfluorenyl units in all of the three encoding polymers, it gave rise to the background fluorescence of the blue channel, which we used as an internal calibration but which also further reduced the number of available barcodes. The resultant barcodes were named after the fluorescence intensity ratios of blue/green/red, thus 3:0–5:0, 3:0:0–5, 2:0–5:5, and 2:5:0–5 (see Figure 2A–D).
Figure 2.
Spectral-intensity optical encoding using Pdots. The intensity of green fluorescence (A and C) or red fluorescence (B and D) could be independently tuned from level 0 to level 5 while the other two colors remained roughly constant. All Pdots were excited at 405 nm.
We should point out that the number of Pdot barcodes can be increased by extending the wavelength of polymers to the near-infrared range or by integrating other imaging modalities. Our group has synthesized highly fluorescent conjugated polymers containing squaraine or other BODIPY to shift the emission peak of Pdots to 700–750 nm.26 With the addition of one or more encoding elements, no matter the color or imaging modality, the number of Pdot barcodes can be increased by a geometric ratio.
Because the Pdot barcodes were designed for cell tracking, their cytotoxicity should be considered. We have previously characterized the cytotoxicity of Pdots as well as their more subtle effects on cell stress and found Pdots to be generally very biocompatible.27 In addition, the stability of Pdot barcodes in physiological environments was also studied. First, the pH-dependent fluorescence of Pdots was measured in buffer solutions (Figure S-4). The result shows that the emission spectra of Pdots were constant from pH 5 to 9, indicating that they were insensitive to pH. Next, a suspension of Pdots was kept at 37 °C for time-dependent fluorescence measurements (Figure S-5) over 3 days. We found that only the blue emission had a very small increase during the first day of incubation while the green and red emissions remained constant. The reason for the very slight change in blue emission during the first day may be due to the slight adjustment of distance between polymer chains caused by temperature, considering that the Pdots are based on FRET from PFO to BODIPY units. This small change in the first day can be accounted for, if needed, by aging the Pdots for 1 day prior to the experiment. Overall, our Pdot barcodes exhibit high pH stability and good thermostability, which qualify them to work in biological environments.
Cell Labeling with Pdot Barcodes
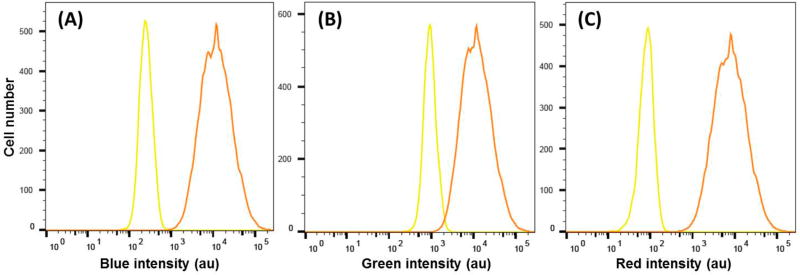
For tumor cell labeling, two strategies were available for our Pdot barcodes: specific targeting and nonspecific labeling.24c,d In the former case, Pdots were first conjugated to streptavidin and used to selectively label cells based on the biotin/streptavidin binding (Section S-7). The targeting capability of Pdot barcodes was tested on MCF-7 human breast cancer cells by labeling a specific cellular target, EpCAM (epithelial cell adhesion molecule), a cell-surface marker present on most circulating tumor cells (Figure S-6). The microscopy results show that fluorescent barcodes effectively label MCF-7 cells. However, we note that a surface labeling approach may block surface antigens or detach them from the cell surface, which may influence the quality of cell tracking in the long run. Pdots could be readily taken up by cells via endocytosis, a nonspecific labeling strategy, but without altering cell viability.28 For tracking of single cells that would be prelabeled and then either mixed with other cells or injected into living animals, we believe Pdot labeling via endocytosis is a better approach.29 To quantify the efficiency of endocytosis, MCF-7 human breast cancer cells were incubated with Pdot barcodes (barcode 3:3:3, abbreviated as 333, at a concentration of ~2 ppm) for 2 days and then detached from the cell culture plates with trypsin digestion for flow cytometry analysis. As shown in Figure 3A–C, the fluorescence intensity of labeled cells was 2 orders of magnitude brighter than control cells, demonstrating that the cellular uptake of Pdots by endocytosis was effective.
Figure 3.
Flow cytometry measurements of the fluorescence intensity distributions of MCF-7 breast cancer cells labeled via endocytosis using the Pdot barcode (333): (A) blue, (B) green, and (C) red channel. Cells without Pdots were used as a control (yellow curve). The excitation wavelength was at 405 nm; blue, green, and red fluorescence were collected through the band-pass of 450/50, 525/50, and 670/30 nm, respectively.
Discrimination of Cells with Ratiometric-Based Flow Cytometry
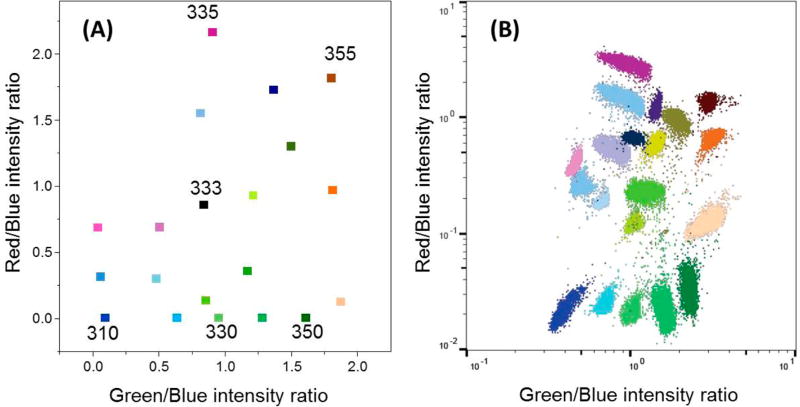
To demonstrate the resolving power of the Pdot barcodes, we created, as a proof of concept, 20 barcodes to label and identify cells. The uptake efficiency of Pdots varies from cell to cell because the nanoparticles are stochastically distributed around the cells and because of cell-to-cell variability. As a result, the fluorescence intensities measured from each cell may vary. To address this problem, we adopted a ratiometric approach by setting the blue emission of Pdots as the internal reference, which was only applied to flow cytometry. This was reasonable because all barcodes contained blue emissive PFO units. The intensity ratios of green-to-blue and red-to-blue were independent of the concentration of loaded Pdots. Figure 4A displays the two-dimensional (2D) distribution of intensity ratios of the 20 Pdot barcodes based on the ratiometric scheme. They are well separated according to their barcodes or spectral-intensity ratios.
Figure 4.
(A) 2D distribution of 20 Pdot spectral-intensity barcodes plotted against the fluorescence intensity ratios of green-to-blue (x-axis) and red-to-blue (y-axis). The numbers adjacent to the data points indicate the barcode name. (B) Discrimination of 20 sets of MCF-7 breast cancer cells individually labeled with the Pdot barcodes described in (A) via flow cytometry. The excitation wavelength was at 405 nm, and blue, green, and red fluorescence were collected through the band-pass of 450/50, 525/50, and 670/30 nm, respectively.
Twenty sets of cells were then labeled with the Pdot barcodes via endocytosis and checked by flow cytometry. Figure 4B shows the flow results plotted using the fluorescence intensity ratios. The cells were distinctly separated into 20 individual population sets. In contrast, for cells labeled with neighboring barcodes and without using the ratiometric scheme, overlaid population sets were observed in fluorescence-intensity-based plots (Figure S-7). Moreover, a mixture of cells labeled with different Pdot barcodes was analyzed by flow cytometry; the cells were clearly resolved on the basis of the Pdot barcodes (Figure S-8). These experiments demonstrate that the optically encoded Pdots were competent enough to distinguish cells by their barcodes based on the ratiometric scheme.
Fluorescence Tracking of Single Cells with Pdot Barcodes
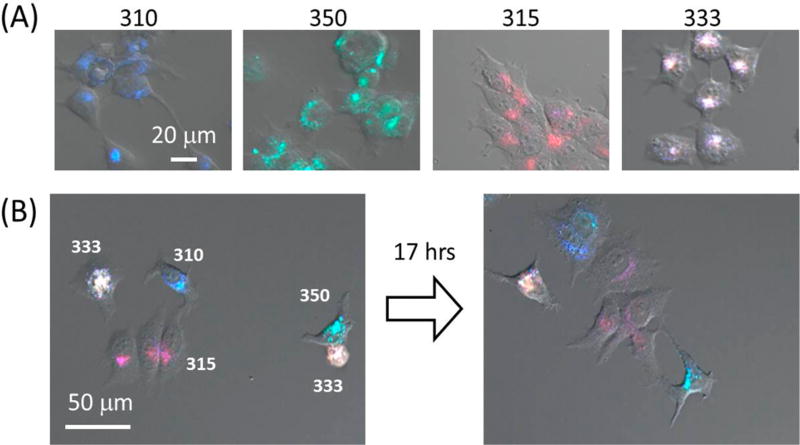
Although cells labeled with Pdot barcodes could be discriminated via flow cytometry, for cell tracking applications, cells also should be discriminated at the single-cell level with fluorescence imaging. Figure 5A shows the confocal fluorescence images of four sets of MCF-7 cells individually labeled with four Pdot barcodes. The images are an overlay of Nomarski, blue, green, and red fluorescence channels, corresponding to the respective emitted fluorescence. It is evident from Figure 5A that the four sets of cells were distinctively different from each other. The result demonstrates that Pdot barcodes are capable of identifying single cells with imaging.
Figure 5.
(A) Combined Nomarski and confocal fluorescence microscopy images of MCF-7 cells labeled with four different Pdot barcodes: Pdot 310, Pdot 350, Pdot 315, and Pdot 333 (from left to right). The fluorescence image is the color overlay of blue, green, and red fluorescence channels. (B) Time-lapse fluorescence imaging of a mixture of MCF-7 cells labeled with four Pdot barcodes as shown in (A). The numbers next to the cells indicate the name of the labeled Pdot barcodes. The time course of the monitoring lasted for 17 h. The blue, green, and red fluorescence were recorded through band-pass filters of 440/40 and 525/40 nm and a 650 nm long-pass filter, respectively, with excitation from a 405 nm laser (30 mW, 20% transmission).
Next, MCF-7 cells labeled with different Pdot barcodes were mixed and monitored over the course of 17 h by fluorescence microscopy. Figure 5B shows the division process of four sets of cells that had different barcodes from internalized Pdots. With the time elapsed imaging, we see the daughter cells encoded with Pdot 310 and Pdot 315 inherited the same color from parent cells. This experiment shows we were able to carry out multiplexed cell tracking with the Pdot barcodes. Although Pdots are not replenishable during cell division, given the large number of internalized Pdots and their high brightness, long-term cell tracking over several cell divisions should be feasible. We note, however, that for many applications in cell tracking (e.g., the epithelial-to-mesenchymal transition in cancer metastasis), it is the tracking of the movement or migration of the cell that is important but not necessarily the tracking of cells over many cell divisions. In this respect, the fact that Pdots are nonreplenishable during cell division is less of an issue.
CONCLUSIONS
In summary, a new type of nanoscale fluorescent barcode was prepared from PFO and BODIPY semiconducting polymers to form Pdots by nanoprecipitation. The Pdot barcodes were constructed to give off 3 colors at 6 intensity levels. The merits of the Pdot barcodes are small size (~20 nm in diameter), narrow emission bands (fwhm of 30–40 nm), three-color emissions (blue, green, and red) under single-wavelength excitation, high brightness, good pH and thermal stability, and efficient cellular uptake. Resolving power of the Pdot barcodes was demonstrated by clearly discriminating 20 sets of labeled cancer cells with flow cytometry. Furthermore, multiple cancer cells labeled with different Pdot barcodes were simultaneously monitored by fluorescence microscopy, even through rounds of cell division. The results suggest that the Pdot barcodes are strong candidates for long-term tracking of a number of cells. Considering that the number of barcodes can be dramatically increased if near-infrared polymers or other imaging modalities are introduced into Pdots, this study offers new opportunities for cancer research, real-time monitoring of stem cell transplantation, and a range of phenomena in cell growth and developmental biology.
Supplementary Material
Acknowledgments
We gratefully acknowledge support of this work by the NIH (R21CA186798, R01MH113333) and the University of Washington.
Footnotes
ASSOCIATED CONTENT
- Effective fwhm of blue emission; photostability, tuning, pH insensitivity, and thermal stability of Pdot barcodes; cell labeling; flow cytometry measurements; NMR spectra (PDF)
The authors declare the following competing financial interest(s): C.-T.K., Y.R., J.Y., B.F., and D.T.C. have financial interest in Lamprogen, which has licensed the described technology from the University of Washington.
References
- 1.Chen KH, Boettiger AN, Moffitt JR, Wang S, Zhuang X. Science. 2015;348(6233):aaa6090. doi: 10.1126/science.aaa6090. [DOI] [PMC free article] [PubMed] [Google Scholar]
- 2.Pal MK, Rashid M, Bisht M. Biosens. Bioelectron. 2015;73:146–152. doi: 10.1016/j.bios.2015.05.051. [DOI] [PubMed] [Google Scholar]
- 3.Voura EB, Jaiswal JK, Mattoussi H, Simon SM. Nat. Med. 2004;10(9):993–8. doi: 10.1038/nm1096. [DOI] [PubMed] [Google Scholar]
- 4.Al-Mehdi AB, Tozawa K, Fisher AB, Shientag L, Lee A, Muschel RJ. Nat. Med. 2000;6(1):100–2. doi: 10.1038/71429. [DOI] [PubMed] [Google Scholar]
- 5.(a) Jaiswal JK, Mattoussi H, Mauro JM, Simon SM. Nat. Biotechnol. 2002;21:47–51. doi: 10.1038/nbt767. [DOI] [PubMed] [Google Scholar]; (b) Lubeck E, Cai L. Nat. Methods. 2012;9(7):743–8. doi: 10.1038/nmeth.2069. [DOI] [PMC free article] [PubMed] [Google Scholar]; (c) Delehanty JB, Bradburne CE, Susumu K, Boeneman K, Mei BC, Farrell D, Blanco-Canosa JB, Dawson PE, Mattoussi H, Medintz IL. J. Am. Chem. Soc. 2011;133(27):10482–10489. doi: 10.1021/ja200555z. [DOI] [PubMed] [Google Scholar]
- 6.He S, Liu KK, Su S, Yan J, Mao X, Wang D, He Y, Li LJ, Song S, Fan C. Anal. Chem. 2012;84(10):4622–7. doi: 10.1021/ac300577d. [DOI] [PubMed] [Google Scholar]
- 7.Lam B, Das J, Holmes RD, Live L, Sage A, Sargent EH, Kelley SO. Nat. Commun. 2013;4:2001. doi: 10.1038/ncomms3001. [DOI] [PubMed] [Google Scholar]
- 8.Li Z, Zhao B, Wang D, Wen Y, Liu G, Dong H, Song S, Fan C. ACS Appl. Mater. Interfaces. 2014;6(20):17944–53. doi: 10.1021/am5047735. [DOI] [PubMed] [Google Scholar]
- 9.Mross S, Pierrat S, Zimmermann T, Kraft M. Biosens. Bioelectron. 2015;70:376–91. doi: 10.1016/j.bios.2015.03.049. [DOI] [PubMed] [Google Scholar]
- 10.Song E, Han W, Li J, Jiang Y, Cheng D, Song Y, Zhang P, Tan W. Anal. Chem. 2014;86(19):9434–42. doi: 10.1021/ac5031286. [DOI] [PubMed] [Google Scholar]
- 11.Chen L, Li X, Shen D, Zhou L, Zhu D, Fan C, Zhang F. Anal. Chem. 2015;87(11):5745–52. doi: 10.1021/acs.analchem.5b00944. [DOI] [PubMed] [Google Scholar]
- 12.(a) Fenniri H, Chun S, Ding L, Zyrianov Y, Hallenga K. J. Am. Chem. Soc. 2003;125(35):10546–60. doi: 10.1021/ja035665q. [DOI] [PubMed] [Google Scholar]; (b) Lee H, Kim J, Kim H, Kim J, Kwon S. Nat. Mater. 2010;9(9):745–9. doi: 10.1038/nmat2815. [DOI] [PubMed] [Google Scholar]
- 13.(a) Melkko S, Scheuermann J, Dumelin CE, Neri D. Nat. Biotechnol. 2004;22(5):568–574. doi: 10.1038/nbt961. [DOI] [PubMed] [Google Scholar]; (b) Mannocci L, Zhang YX, Scheuermann J, Leimbacher M, De Bellis G, Rizzi E, Dumelin C, Melkko S, Neri D. Proc. Natl. Acad. Sci. U. S. A. 2008;105(46):17670–17675. doi: 10.1073/pnas.0805130105. [DOI] [PMC free article] [PubMed] [Google Scholar]
- 14.(a) Pregibon DC, Toner M, Doyle PS. Science. 2007;315(5817):1393–6. doi: 10.1126/science.1134929. [DOI] [PubMed] [Google Scholar]; (b) Wang Z, Zong S, Chen H, Wang C, Xu S, Cui Y. Adv. Healthcare Mater. 2014;3(11):1889–97. doi: 10.1002/adhm.201400092. [DOI] [PubMed] [Google Scholar]
- 15.Krutzik PO, Nolan GP. Nat. Methods. 2006;3(5):361–368. doi: 10.1038/nmeth872. [DOI] [PubMed] [Google Scholar]
- 16.Steemers FJ, Ferguson JA, Walt DR. Nat. Biotechnol. 2000;18(1):91–94. doi: 10.1038/72006. [DOI] [PubMed] [Google Scholar]
- 17.Abbasi AZ, Amin F, Niebling T, Friede S, Ochs M, Carregal-Romero S, Montenegro JM, Gil PR, Heimbrodt W, Parak WJ. ACS Nano. 2011;5(1):21–25. doi: 10.1021/nn1034026. [DOI] [PubMed] [Google Scholar]
- 18.Han M, Gao X, Su JZ, Nie S. Nat. Biotechnol. 2001;19(7):631–5. doi: 10.1038/90228. [DOI] [PubMed] [Google Scholar]
- 19.Sathe TR, Agrawal A, Nie S. Anal. Chem. 2006;78(16):5627–32. doi: 10.1021/ac0610309. [DOI] [PubMed] [Google Scholar]
- 20.Li K, Qin W, Ding D, Tomczak N, Geng J, Liu R, Liu J, Zhang X, Liu H, Liu B, Tang BZ. Sci. Rep. 2013;3:1150. doi: 10.1038/srep01150. [DOI] [PMC free article] [PubMed] [Google Scholar]
- 21.(a) Zhang YJ, Clapp AR. RSC Adv. 2014;4(89):48399–48410. [Google Scholar]; (b) Wang G, Leng Y, Dou H, Wang L, Li W, Wang X, Sun K, Shen L, Yuan X, Li J, Sun K, Han J, Xiao H, Li Y. ACS Nano. 2013;7(1):471–81. doi: 10.1021/nn3045215. [DOI] [PubMed] [Google Scholar]
- 22.(a) Gorris HH, Wolfbeis OS. Angew. Chem., Int. Ed. 2013;52(13):3584–600. doi: 10.1002/anie.201208196. [DOI] [PubMed] [Google Scholar]; (b) Chen G, Agren H, Ohulchanskyy TY, Prasad PN. Chem. Soc. Rev. 2015;44(6):1680–713. doi: 10.1039/c4cs00170b. [DOI] [PubMed] [Google Scholar]
- 23.(a) Cheng LA, Yang K, Zhang SA, Shao MW, Lee ST, Liu ZA. Nano Res. 2010;3(10):722–732. [Google Scholar]; (b) Dou Q, Idris NM, Zhang Y. Biomaterials. 2013;34(6):1722–31. doi: 10.1016/j.biomaterials.2012.11.011. [DOI] [PubMed] [Google Scholar]
- 24.(a) Wu CF, Jin YH, Schneider T, Burnham DR, Smith PB, Chiu DT. Angew. Chem., Int. Ed. 2010;49(49):9436–9440. doi: 10.1002/anie.201004260. [DOI] [PMC free article] [PubMed] [Google Scholar]; (b) Wu CF, Hansen SJ, Hou QO, Yu JB, Zeigler M, Jin YH, Burnham DR, McNeill JD, Olson JM, Chiu DT. Angew. Chem., Int. Ed. 2011;50(15):3430–3434. doi: 10.1002/anie.201007461. [DOI] [PMC free article] [PubMed] [Google Scholar]; (c) Wu C, Chiu DT. Angew. Chem., Int. Ed. 2013;52(11):3086–109. doi: 10.1002/anie.201205133. [DOI] [PMC free article] [PubMed] [Google Scholar]; (d) Peng HS, Chiu DT. Chem. Soc. Rev. 2015;44(14):4699–4722. doi: 10.1039/c4cs00294f. [DOI] [PMC free article] [PubMed] [Google Scholar]; (e) Wu IC, Yu JB, Ye FM, Rong Y, Gallina ME, Fujimoto BS, Zhang Y, Chan YH, Sun W, Zhou XH, Wu CF, Chiu DT. J. Am. Chem. Soc. 2015;137(1):173–178. doi: 10.1021/ja5123045. [DOI] [PMC free article] [PubMed] [Google Scholar]
- 25.Rong Y, Wu C, Yu J, Zhang X, Ye F, Zeigler M, Gallina ME, Wu IC, Zhang Y, Chan YH, Sun W, Uvdal K, Chiu DT. ACS Nano. 2013;7(1):376–84. doi: 10.1021/nn304376z. [DOI] [PMC free article] [PubMed] [Google Scholar]
- 26.Zhang XJ, Yu JB, Rong Y, Ye FM, Chiu DT, Uvdal K. Chemical Science. 2013;4(5):2143–2151. doi: 10.1039/C3SC50222H. [DOI] [PMC free article] [PubMed] [Google Scholar]
- 27.Ye FM, White CC, Jin YH, Hu XG, Hayden S, Zhang XJ, Gao XH, Kavanagh TJ, Chiu DT. Nanoscale. 2015;7(22):10085–10093. doi: 10.1039/c5nr01857a. [DOI] [PMC free article] [PubMed] [Google Scholar]
- 28.Wu C, Bull B, Szymanski C, Christensen K, McNeill J. ACS Nano. 2008;2(11):2415–2423. doi: 10.1021/nn800590n. [DOI] [PMC free article] [PubMed] [Google Scholar]
- 29.Lee JM, Kim BS, Lee H, Im GI. Mol. Ther. 2012;20(7):1434–1442. doi: 10.1038/mt.2012.60. [DOI] [PMC free article] [PubMed] [Google Scholar]
Associated Data
This section collects any data citations, data availability statements, or supplementary materials included in this article.


