Abstract
In common thermoplastic additive manufacturing (AM) processes, a solid polymer filament is melted, extruded though a rastering nozzle, welded onto neighboring layers and solidified. The temperature of the polymer at each of these stages is the key parameter governing these non-equilibrium processes, but due to its strong spatial and temporal variations, it is difficult to measure accurately. Here we utilize infrared (IR) imaging - in conjunction with necessary reflection corrections and calibration procedures - to measure these temperature profiles of a model polymer during 3D printing. From the temperature profiles of the printed layer (road) and sublayers, the temporal profile of the crucially important weld temperatures can be obtained. Under typical printing conditions, the weld temperature decreases at a rate of approximately 100 °C/s and remains above the glass transition temperature for approximately 1 s. These measurement methods are a first step in the development of strategies to control and model the printing processes and in the ability to develop models that correlate critical part strength with material and processing parameters.
Keywords: infrared (IR) thermography, material extrusion, fused deposition modeling (FDM), acrylonitrile butadiene styrene (ABS)
1. Introduction
Recently there has been an explosion in development of polymer additive manufacturing (AM) systems, putting this disruptive technology into the hands of many users and generating a strong interest in AM production. In principle, AM methods offer unique capabilities, remove much of the technical skill required to go from design to build, and greatly reduce the cost of personalized manufacturing. As an example, healthcare related products need to be customized to the patient undergoing treatment and polymer AM offers faster and significantly less expensive production methods.[1]
In the most common process for thermoplastic AM, material extrusion1, a thermoplastic polymer is fed though an extrusion head while the extrusion head is rastered around the build surface creating a layer-by-layer 3 dimensional part. In parts prepared by this process the weld is typically the point of failure.[3] During the material extrusion process a hot layer is extruded onto the previous layer simultaneously cooling the printing layer and re-heating the substrate layer, resulting in a small window of time where the polymer-polymer interface is above the glass transition temperature (Tg) or crystalline melting temperature (Tm). Unlike, traditional processing methods where the properties of the polymer are, in general, bulk-like and formed homogeneously, weld formation in material extrusion is limited (non-bulk-like) and neighboring layers are formed in distinctly separate events (inhomogeneous).
However, for all the differences between additive and traditional polymer processing methods, the base thermoplastics are still processed by heating and cooling and are bound by the same polymer physics. In traditional thermoplastic processing methods, the temperature of the melt and cooling rate are crucial processing parameters.[4] In the melt, temperature dictates viscosity[5] and degradation rates[5], while crystallization[5] and development of thermal residual stresses[6, 7, 8] depend on cooling rate.
Temperature measurement of the polymer itself during thermoplastic processing is challenging because one cannot simply place a thermocouple in the flow stream without destroying the process one is attempting to measure. Further, since the polymer is a poor conductor of heat, it acts as a thermal insulator and significant temperature gradients can exist within the polymer as well as between polymer and adjacent metal. Finally, due to the high viscosity, the polymer can locally heat due to mechanical shear heating. In traditional processing methods, such as melt fiber spinning and film blow molding, processing temperatures have been measured and even controlled through infrared (IR) thermography.[9, 10, 11] In extrusion and injection molding, fluorescent measurements have been used to measure temperature gradients.[12, 13]
In material extrusion AM, there have been a few efforts to measure the temperature profile. Several groups have placed thermocouples on the build plate and used those measured profiles to estimate the cooling profile of the extruded layer.[14, 15] IR thermography is a promising technique for this purpose because the spatial and temporal scales match that of the process. Further, important aspects of the process occur with the polymer exposed to air, which is ideal for IR. Dinwiddie et al. used an IR camera to monitor the extrusion temperature stability during printing, however, the cooling profile was not investigated.[16] Further, IR measurements can be made far from the build plate, unlike thermocouple based experiments.
In this work, we use IR thermography under different printing conditions to measure spatial and temporal temperature profiles. We focus on the spatial region immediately surrounding the active printing region with a goal of measurement of the weld zones. In order to make accurate temperature measurements, a correction to the IR intensity is applied to remove reflected IR intensity generated by the hot extrusion head. A separate set of offline measurements provide the conversion from IR intensity to temperature. We also estimate the heating of the sublayers which is due to the molten extrudate and that which is due to radiative transfer from the hot extruder head.
2. Materials & Methods
2.1. Thermoplastic
Spools of acrylonitrile butadiene styrene (ABS) copolymer filament were purchased from MakerBot Industries2 (Brooklyn, NY). Spools were stored in an electronic desiccation cabinet, relative humidity less than 1 %, when not in use.
2.2. 3D Printing
A modified MakerBot Replicator 2X (MakerBot Industries, Brooklyn, NY) was used for all 3D printing processes. Modifications include replacement of plastic support components in the gantry and carriage with aluminum components. Printed samples were originally designed in Autodesk Inventor, exported as high resolution stereolithography (STL) files, and converted to G-code using the MakerBot Desktop V3.7 (all layers were preset to 0.3 mm). The G-code was then edited to create a constant tool path for all layers (always left to right or negative to positive on the x-axis). Multiple versions were then made to control the feed rate and extrusion temperature. The G-code was converted to the xg3 format native to the MakerBot Mighty-Board using the GPX command line utility with all overrides disabled. The build plate was always set at 110 °C and the first layer was printed using the default MakerBot Desktop output. Thermography measurements were made on samples with the following dimension: 160 mm long (x-axis), 2.4 mm tall (z-axis, 8 layers at 0.3 mm), and 0.4 mm wide (y-axis, extruder diameter). The sample was printed at the front edge of the build plate. 10 mm (y-axis) by 20 mm (x-axis) feet were added to the start and end of the first layer to prevent the sample from detaching from the build plate during the printing process.
2.3. Infrared Imaging
Infrared videos were captured using a CEDIP Jade III midwave IR camera. The camera is equipped with a 320 pixel by 240 pixel InSb focal plane array (FPA), a 3900 nm filter with a 400 nm bandwidth, 50 mm fixed focus lens and manufacturer rated precision of ±1 °C. The addition of extender rings result in an instantaneous field of view (iFoV) of 81.3 µm/pixel, determined from the known width of the extrusion head. Videos were captured at 50 frames/s with the integration time set to the maximum value without saturating the FPA. For ABS at 270 °C, this was 400 µs. The raw camera output is a digital level (DL) integer ranging from 0 to 16383. The camera faces normal to the x,z-plane or front of the build volume, centered on the printed object with the extruding (printing) layer in the center of the frame. Regions of interest (ROI) were taken near the center of the FPA. Non-uniformity corrections (NUC) were made using the 2-point NUC function in the camera software. A hot plate and hot plate covered with glass sheet were used for the 2-point image measurement. Within a printed layer, the ROIs are selected to be at the midpoints along the z-axis, such that the polymer/air boundary is normal to the camera. All IR data will be reported with the active printing layer denoted as LP and the lower sublayers denoted as LP−n; for example in our 8 layer build, the bottom layer on the base plate would be denoted LP−7.
2.4. Temperature Calculation
To convert IR intensity to temperature, offline measurements of the ABS at known temperatures were taken using the same settings as the in situ 3D printing IR thermography (50 frames/s, 400 µs). A pre-printed 0.6 mm polymer washer was placed on a THMS600 hot stage (Linkam Scientific, UK), δT = 0.1 °C, with the camera hanging over head. IR signals were captured for 10 s using ROIs in a similar area of the detector as the in situ ROIs at 10 different temperatures from 60 °C to 270 °C. This provides a direct conversion from camera DL signal to true temperature without the need of emissivity measurement and correction.
3. Results & Discussion
3.1. IR imaging
IR imaging systems provide IR signals that are dependent on material emissivity, thus looking at raw IR data of different materials is only qualitative. An illustration, fig. 1a, denotes the extruder, the printing layer LP (vermillion), sublayers LP−n (blue), and the build plate (black). False color IR images of the material extrusion process, the hot extruder without extrusion, and the cold extruder are presented in figs. 1b to 1d. Starting from the top of fig. 1b the hot extrusion nozzle is visible as a tapered, irregular red, yellow, and green shape. The irregular color is in part due to bits of polymer which are melted and burned onto the brass nozzle and the lack of symmetric heating cartridges (above the field of view). Closer to the center of the image, the hot, extruding polymer road (LP) is clearly present in fig. 1b, changing from red to yellow to green (right to left) as distance from the extrusion head increases. Vertically, LP changes from green to yellow to red then back to yellow to green. While some vertical IR intensity gradient is possible it is more likely due to the curvature of the extruded road, as the surface normal (to the camera) increases beyond 45° the IR intensity drops off sharply. Further down the sublayers (LP−1, LP−2, …, LP−7) in fig. 1b are visible as light blue stripes separated by darker blue stripes, again the darker blue is most likely due to the curvature of the roads in the sublayers.
Figure 1.
Illustration and false color IR images of 3D printing process. From left to right illustration, extrusion, extruder hot/no extrusion, and extruder cold (color scale is linear). The white markers in the center of the print and reflection images denote ROIs for print layer LP, layer LP−1, and layer LP−2. Reflected IR photons visible from all layers and the build plate (slightly lighter blue compared to cold pass).
However, the measured or total IR signal (I) at all layers is a combination of emitted photons (IE) and reflected photons (IR), which originate from the heated extruder. The reflection signal can be seen by comparing fig. 1b or fig. 1c to fig. 1d. In fig. 1c, the extruder is heated without extruding polymer and the image is similar to fig. 1b with exception of the already cooled LP. In fig. 1d the extruder is cold (faintly visible) and regions, which were lighter blue figs. 1b and 1c are significantly darker. The IR signal measured with the heated extruder overhead, while not extruding, can be used to subtract off the reflection signal, section 3.3. Then, by examining the velocity dependence of temperature profiles for the case of fig. 1c (heated extruder head but no extrusion), we can estimate the indirect radiative heating from the extruder head to the already printed polymer.
3.2. IR Profiles
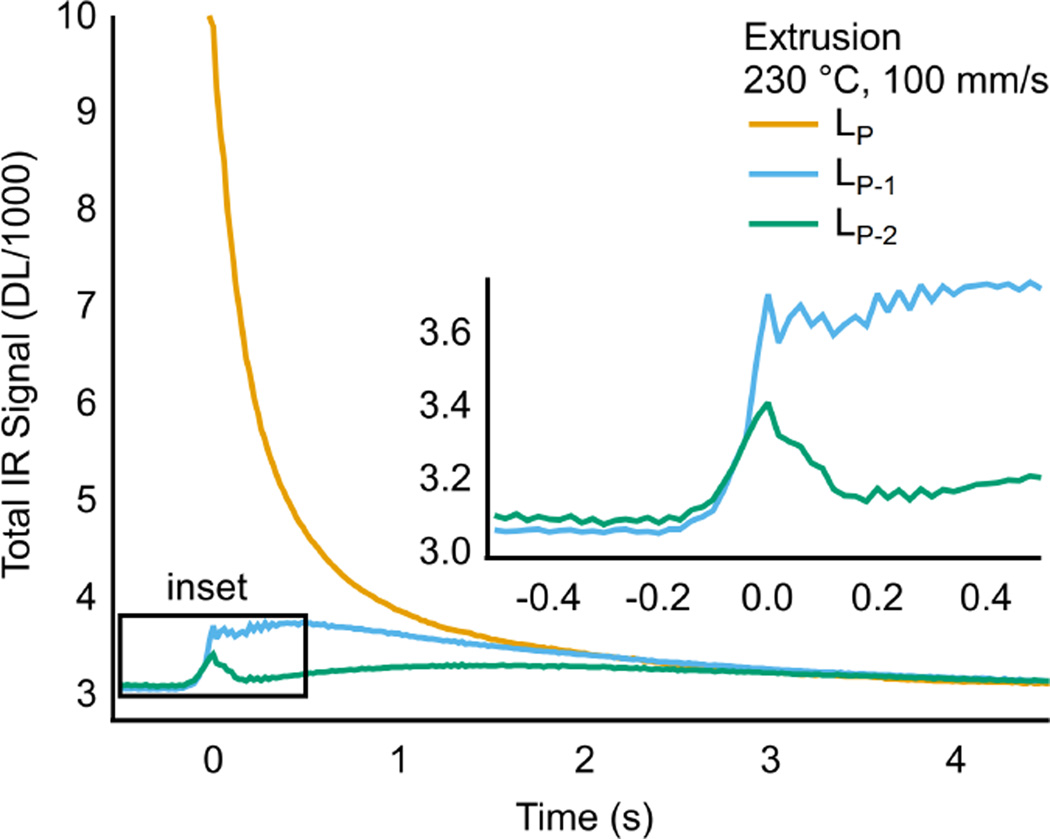
Time dependent total IR signal profiles, fig. 2, were extracted from the ROIs marked in fig. 1b. In fig. 2, all profiles are time shifted to have the printing layer (LP) appear at 0 s, corresponding to fig. 1b. The total IR signal (and thus temperature) for the printing layer drops off quickly converging with the layer below (LP−1) within 2 s. For the printing layer (LP) at times less than 0 s, the camera is measuring air or the defocused rear wall of the printer, as such the points are removed from the plot.
Figure 2.
IR intensity profiles for ABS printed at 230 °C and 100 mm/s. From ROIs corresponding to fig. 1b. The IR intensity of printing layer (LP) drops quickly while the intensity of sublayers LP−1 and LP−2 appear to increases instantly. The sudden increase in LP−1 and LP−2 is due to reflected IR photons from the extrusion head. Following the sudden increase a more sublet peak in intensity occurs for both LP−1 and LP−2 each lagging behind the appearance of the LP.
From this data, the drop off in total IR signal occurs over a time scale of 1 s to 2 s. Note that a second peak in the total IR signal for layers LP−1 and LP−2 lags behind intensity spike for the print layer as would be expected for thermal diffusion. Next we consider how to remove confounding IR reflections and to convert the IR signal to temperature.
3.3. Reflection Correction
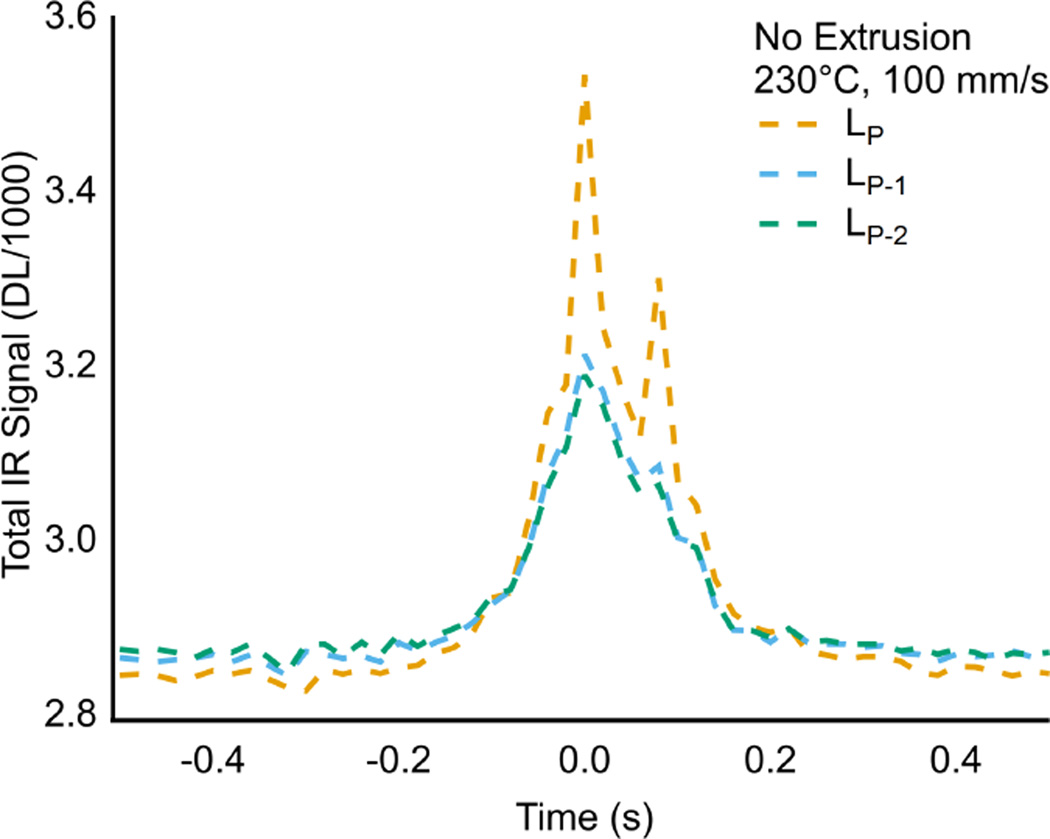
In order to accurately convert the total IR signal from the camera into temperature, the component of total signal due to emission (IE) must be determined. The measured or total signal stems from the summation of emitted and reflected energy from the object received by the detector (I = IE + IR). As noted in section 3.2, the reflected energy can be determined by passing the heated extruder over the build surface without extruding (fig. 1c), extracting IR profiles (fig. 3) from the ROIs, and calculating the signal strength above background.
Figure 3.
IR intensity profiles for heated nozzle, no extrusion, at 230 °C and 100 mm/s. From ROIs corresponding to fig. 1c. The reflection profile is unique for LP, while LP−1 and LP−2 have similar profiles.
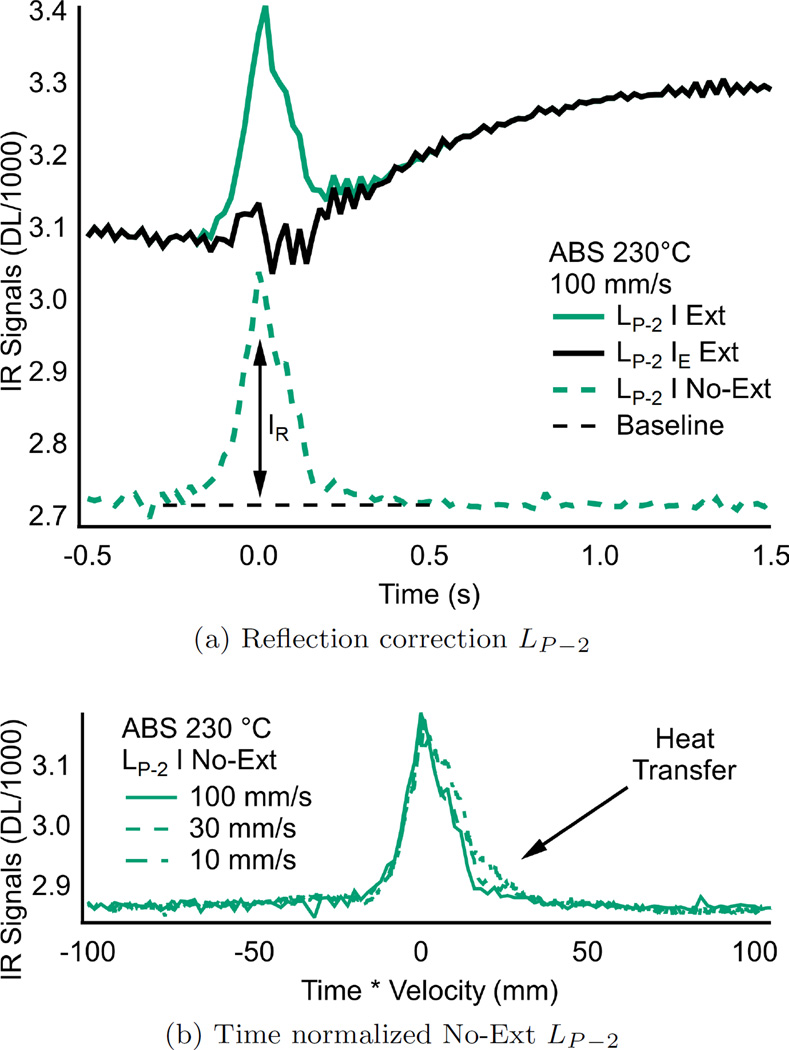
We calculated IE by linearly shifting the non-extruded IR profile until the peak intensities in the extruded and non-extruded IR profiles are aligned and subtracting IR from I during the time range where the extruder is over the ROIs. An example for ABS LP−2 printed at 230 °C and 100 mm/s is displayed in fig. 4a.
Figure 4.
(a) Reflection correction for ABS layer LP−2 printed at 230 °C and 100 mm/s. IR profile from hot extruder w/o extrusion (dashed bluish-green line) shifted to line up with initial peak of extrusion IR intensity (bluish-green). The reflection intensity corresponds to IR profile from the hot extruder w/o extrusion above baseline (black dashed). (b) Time normalized total IR intensives for LP−2 at print speeds of 10 mm/s, 30 mm/s and 100 mm/s.
The emission signal, LP−2 IE fig. 4a solid black represents the corrected profile, and is quite different form the uncorrected curve obtained from ignoring the reflection. Instead of a peak at t = 0 s of width 0.1 s followed by a gradual increase, we now find a more gradual increase in the emission signal with time; the peak in the emission signal occurs approximately 1.5 s behind the printing.
We can use this same technique of printing in the hot, no extrusion mode to determine the amount of indirect heating that is done by the extruder head. While most of the heating of the sublayers originates from thermal conduction from the printing layer, there can also be indirect heating (for example from radiative heat transfer). We measure this by moving the extruder in the hot, no extrusion mode over the sublayers for a range of extruder head velocities. The results are shown in fig. 4 where the IR profile is now plotted against extruder-head position rather than time. If there were no indirect heating, then the three curves would exactly coincide. Instead, a slight increase in IR intensity is observed at the slowest speed, which had more time for indirect thermal heating. The elevated IR is apparent for t > 0 s, which indicates there is a cumulative effect of the indirect heating. We shall see in the next section that this increase amounts to less than 3 °C of heating. Increasing the extrusion temperature will also increase this reflected intensity, in a non-deterministic way, thus it is important to measure or mitigate the reflection whenever possible.
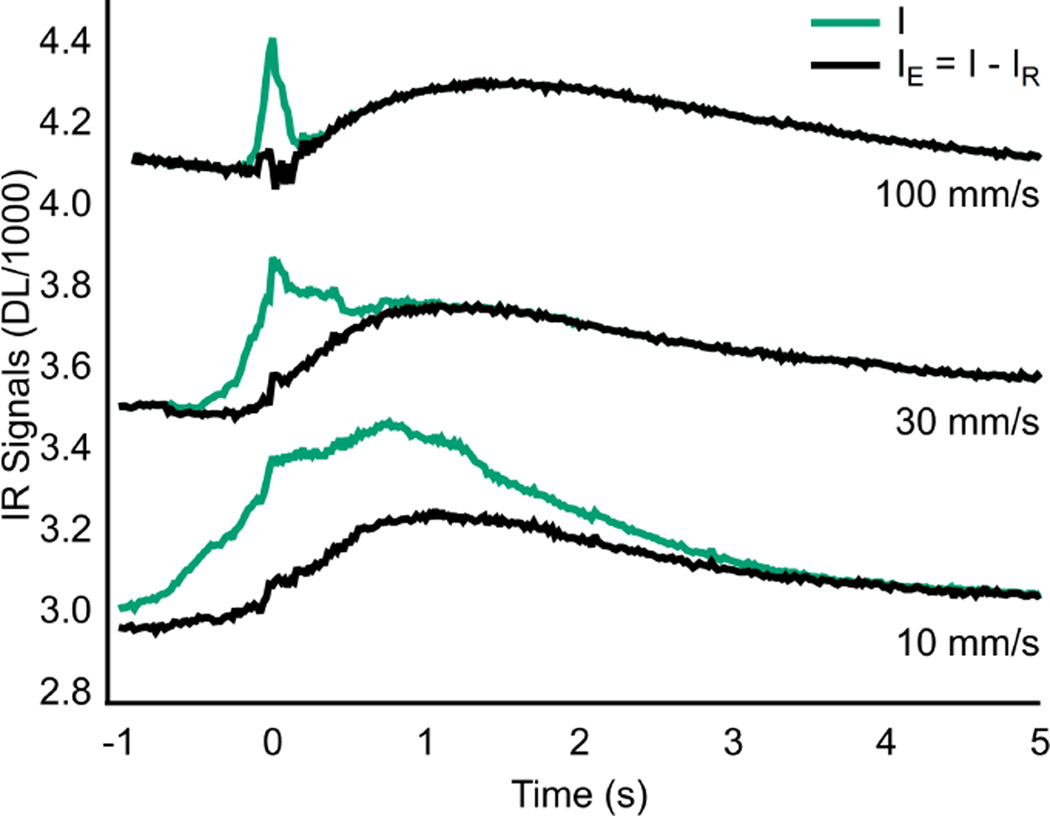
In fig. 5, we show the relative importance of the reflection correction as a function of extruder head speed. When plotted as a function of time, the difference between the corrected and non-corrected is the greatest at the slowest speed for the simple reason that the extruder head sits directly above the ROI for the longest period of time.
Figure 5.
IR profiles and reflection corrections for ABS LP−2 printed at 230 °C and several speeds. At 100 mm/s the reflection is only a minor part covering approximately 0.75 s of the profile, as speeds are decreased to 30 mm/s and 10 mm/s the reflection extends to cover approximately 2 s and 4.5 s of intensity profile. After the reflection correction the intensity profiles are very similar at different speeds.
3.4. Temperature Conversion
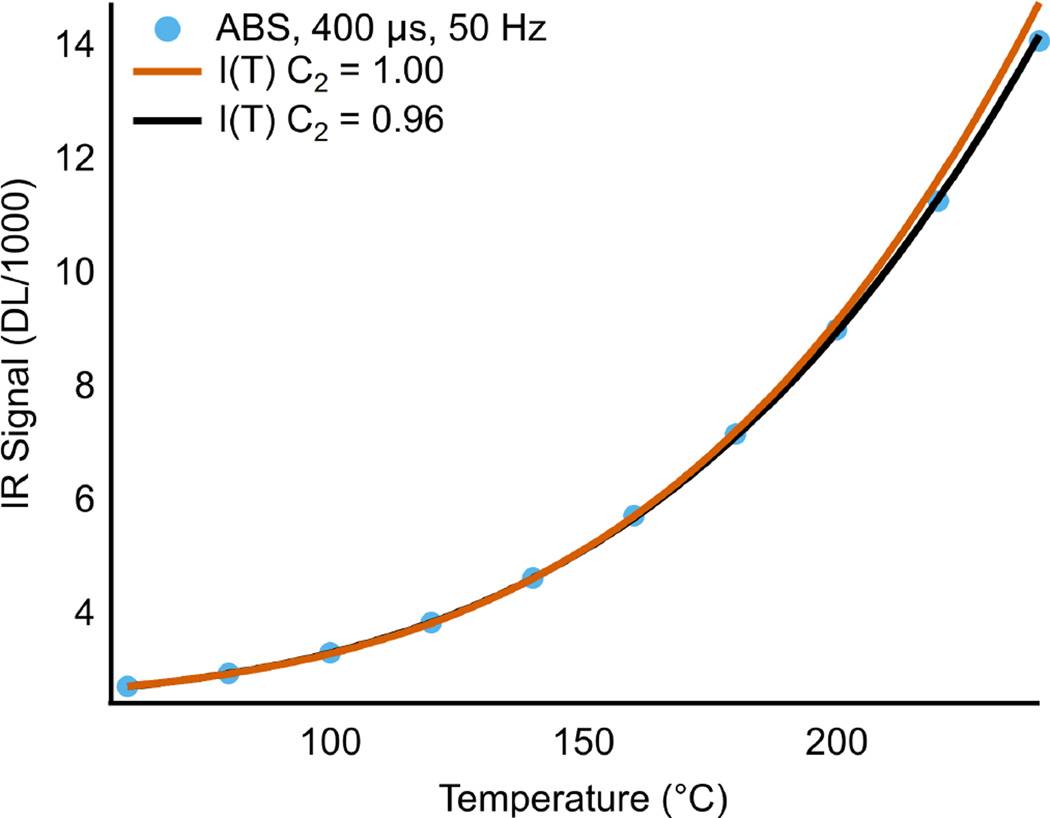
As noted in section 3.3, the signal from IR thermography is proportional to several parameters, such as emissivity, solid angle, and detector efficiency. Prior to reporting temperature, care must be taken to ensure the conversion from IE to temperature is handled correctly. The simplest solution for this setup was measuring the IR signal of the material of interest at a known temperature. As temperature is increased, a steady nonlinear increase in IR signal is observed, fig. 6.
Figure 6.
Temperature-IR signal plot of ABS disk on hot stage, intensity measured with IR camera. Solid lines are fits to eq. (2). Error bars fall inside markers.
The direct application of Plank’s Law, eq. (1), with fitting parameters for FPA efficiency and background IR, is non-invertible in closed form.
| (1) |
Furthermore, at a wavelengths of 3700 nm to 4100 nm and temperatures of 80 °C to 270 °C, , are well outside the limit for Rayleigh-Jeans Law (hc ≪ λkBT) and the Wien Approximation (hc ≫ λkBT). Instead, we ignore the finite spectral bandwidth and apply the monochromatic form Plank’s Law with fitting parameters to correct for FPA efficiency, solid angle of emission, iFoV, and emissivity (C1), the slight deviation due to the finite spectral bandwidth (C2), and background IR (bkg), arriving at eq. (2).
| (2) |
Although the descriptions of these corrections are oversimplified the functional form of the equation fits the data quite well. If we fit only C1 and bkg, good agreement (R2 = 0.9955) with the temperature-IR signal data is achieved, as shown in fig. 6 (red line). The slight deviation at high temperatures is likely due to the increasing slope of the actual spectral radiance in the 3700 nm to 4100 nm range. Using C1, C2, and bkg as fitting parameters, excellent agreement (R2 = 0.9999) with the data is achieved, fig. 6 (black line), and the function is invertible allowing for direct conversion of IR intensity to temperature. The deviation of C2 from the ideal case (C2 = 1) is only 4% and the deviation of bkg from the measured IR background in only 5.8 %.
Comparing the hot extruder, no extrusion profiles for LP−2 with changing speeds (fig. 4b) the maximum differential occurs around 25 mm. The IR signal is low, approximately 3000 DL, and the difference between the 10 mm/s and 30 mm/s or 100 mm/s is approximately 90 DL, which translates to maximum increase of less than 3 °C.
3.5. Temperature profiles
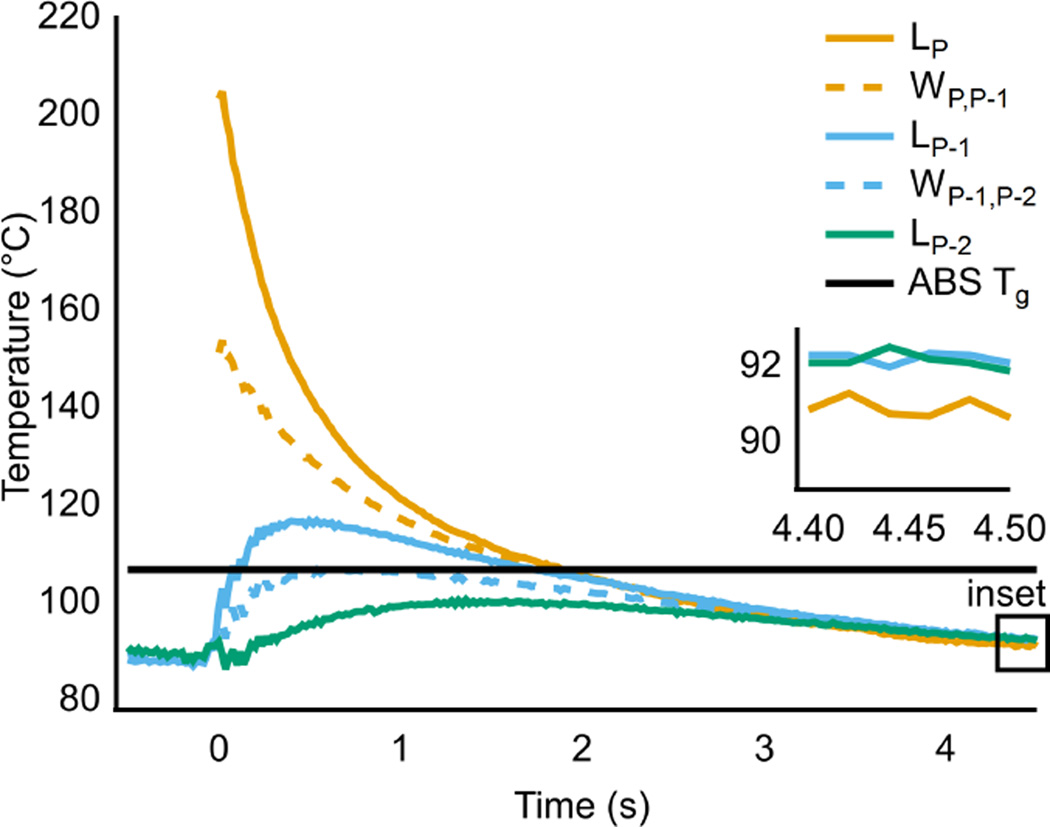
Having performed reflection corrections and calibration, we can report the actual temperature profiles, as shown in fig. 7. The polymer layer curves LP, LP−1, and LP−2 have similar shapes to the total IR signal profiles from fig. 2. The notable difference is the removal of the jump in temperature for sublayers LP−1 and LP−2 at 0 s. Two additional features are included in fig. 7, the glass transition temperature (Tg = 106.4 °C measured by differential scanning calorimetry (DSC) using standard practices[5]) for the ABS used and the estimated weld temperature profiles. Direct measurement of the temperature at the interface between two layers is extremely difficult, the extrusion profile produces high curved surfaces and the area where those surfaces meet is extremely small. Instead the weld temperature is estimated using the average temperature of the two adjacent layers.
Figure 7.
Temperature profiles for ABS printed at 230 °C and 100 mm/s. Solid lines indicate temperature from each layer. Dashed lines indicate weld temperature determined by averaging the corresponding layer temperatures.
From the printing and sublayer temperature profiles, solid lines fig. 7, several important features are observed. LP starts off just below the extrusion temperature and cools quickly, reaching Tg in less than 2 s, matching earlier thermocouple based measurements[14] but not later work[15]. LP−1 heats above Tg rather quickly peaking approximately 0.5 s behind the printing layer, however, the peak is below 120 °C. LP−2 lags further behind LP−1, peaking near 1.5 s and does not go above Tg, maxing out below 100 °C. By 3 s the temperature profiles have nearly converged and continue cooling.
The estimated weld temperature profiles, dashed lines fig. 7, provide a similar narrative. The top most weld, between the LP and LP−1, reaches approximately 155 °C and cools below Tg within 2 s. The weld between LP−1 and LP−2 barely reaches Tg, with the peak lagging behind the weld above, indicating further weld formation between those layers is highly unlikely after the initial formation of the weld.
The heated build plate is set to 110 °C, providing heat from below, which slowly increases the temperature of sublayers resulting in an inversion of the temperature at long times, inset fig. 7.
4. Conclusions
The measurement of temperature profiles from polymer material extrusion AM processes is essential in understanding the thermodynamic and kinetic states during weld formation. It is also important in understanding the temperature history of the printed part for example to help understand the evolution of residual stress effects. IR thermography offers an excellent method for measuring temperature profiles at any layer height during the polymer material extrusion AM process.
Conversion from total IR signal to temperature is straight forward if reflections are removed and the relationship between the IR signal and the temperature is determined. From the IR measurements of the part geometry and extrusion conditions studied, the printed layer temperature decreases very quickly and only a small amount of heat is transferred to the first sublayer, while the second sublayer never reaches Tg. The estimated weld temperature also decreases quickly, leaving little time for weld formation (less than 2 s). Furthermore, the weld is not annealed during the printing of successive layers, i.e., the weld temperature between sublayer 1 and sublayer 2 does not rise above Tg. Changing the processing conditions or part geometry may result in different thermal profiles, which IR thermography measurements could easily characterize.
The ability to accurately measure the temperature of the polymer, in particular the weld zone, is the first piece in the understanding, control, and ultimately enhancement of weld strength. Armed with the temperature profile one can relate the temperature to relaxation times and viscosities of the polymer. These parameters then dictate the inter-diffusion of the polymer which in turn drives the formation of weld strength. Thus IR thermography should become a critical tool in the further development of thermoplastic extrusion based AM.
Acknowledgments
The authors would like to thank B. Lane from the Engineering Lab for loaning us their CEDIP Jade III IR camera and many helpful discussion on IR thermography.
Footnotes
Offcial contribution of the National Institute of Standards and Technology; not subject to copyright in the United States.
Material extrusion is the ASTM definition for this process[2], however, it is also known as fused deposition modeling® (FDM) or fused filament fabrication (FFF).
Certain commercial equipment, instruments, or materials are identified in this paper in order to specify the experimental procedure adequately. Such identification is not intended to imply recommendation or endorsement by the National Institute of Standards and Technology, nor is it intended to imply that the materials or equipment identified are necessarily the best available for the purpose.
References
- 1.Huang SH, Liu P, Mokasdar A, Hou L. Additive manufacturing and its societal impact: a literature review. The International Journal of Advanced Manufacturing Technology. 2013;67(5–8):1191–1203. [Google Scholar]
- 2.ISO/ASTM 52900:2015(en), Additive manufacturing - general principles - terminology [Google Scholar]
- 3.Ahn S, Montero M, Odell D, Roundy S, Wright PK. Anisotropic material properties of fused deposition modeling ABS. Rapid Prototyping Journal. 2002;8(4):248–257. [Google Scholar]
- 4.Vlachopoulos J, Strutt D. Polymer processing. Materials science and technology. 2003;19(9):1161–1169. [Google Scholar]
- 5.Fried JR. Polymer science and technology. Pearson Education. 2014 [Google Scholar]
- 6.Akay M, Ozden S. Measurement of residual stresses in injection moulded thermoplastics. Polymer Testing. 1994;13(4):323–354. [Google Scholar]
- 7.So P, Broutman LJ. Residual stresses in polymers and their effect on mechanical behavior. Polymer Engineering & Science. 1976;16(12):785–791. [Google Scholar]
- 8.Thompson M, White J. The effect of a temperature gradient on residual stresses and distortion in injection moldings. Polymer Engineering & Science. 1984;24(4):227–241. [Google Scholar]
- 9.Golzar M, Beyreuther R, Brünig H, Tändler B, Vogel R. Online temperature measurement and simultaneous diameter estimation of fibers by thermography of the spinline in the melt spinning process. Advances in Polymer Technology. 2004;23(3):176–185. [Google Scholar]
- 10.Marla VT, Shambaugh RL, Papavassiliou DV. Use of an infrared camera for accurate determination of the temperature of polymer filaments. Industrial & engineering chemistry research. 2007;46(1):336–344. [Google Scholar]
- 11.Marla VT, Shambaugh RL, Papavassiliou DV. Online measurement of fiber diameter and temperature in the melt-spinning and melt-blowing processes. Industrial & Engineering Chemistry Research. 2009;48(18):8736–8744. [Google Scholar]
- 12.Migler KB, Bur AJ. Fluorescence based measurement of temperature profiles during polymer processing. Polymer engineering and science. 1998;38(1):213–221. [Google Scholar]
- 13.Bur AJ, Roth SC, Spalding MA, Baugh DW, Koppi KA, Buzanowski WC. Temperature gradients in the channels of a single-screw extruder. Polymer Engineering & Science. 2004;44(11):2148–2157. [Google Scholar]
- 14.Sun Q, Rizvi G, Bellehumeur C, Gu P. Effect of processing conditions on the bonding quality of fdm polymer filaments. Rapid Prototyping Journal. 2008;14(2):72–80. [Google Scholar]
- 15.Monzón MD, Gibson I, Benítez AN, Lorenzo L, Hernández PM, Marrero MD. Process and material behavior modeling for a new design of microadditive fused deposition. The International Journal of Advanced Manufacturing Technology. 2013;67(9–12):2717–2726. [Google Scholar]
- 16.Dinwiddie RB, Love LJ, Rowe JC. Real-time process monitoring and temperature mapping of a 3d polymer printing process. SPIE Defense, Security, and Sensing, International Society for Optics and Photonics. 2013:87050L–87050L. [Google Scholar]


