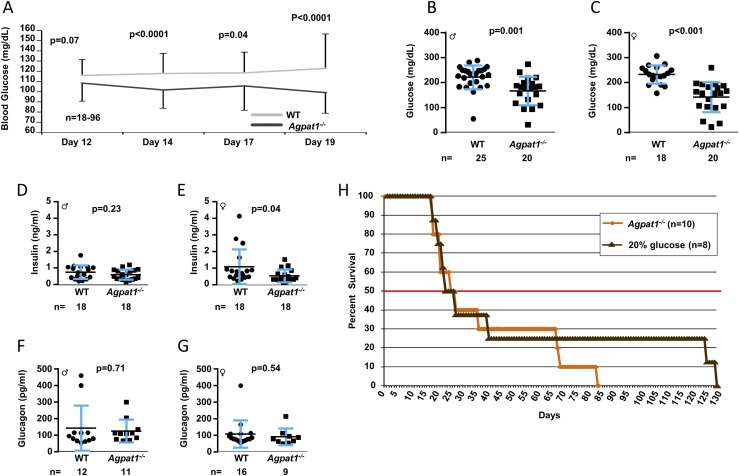
Figure 4.
Agpat1−/− mice were hypoglycemic. (A) Reduced blood glucose level in Agpat1−/− mice compared with the level in WT mice via tail vein is shown between days 12 and 19. The P value was determined by mixed-effects repeated-measures analysis. The plasma glucose levels remained low even at day 21 as measured in plasma obtained by cardiac puncture [(B) male; (C) female]. The line represents the mean ± standard deviation with the number of animals used underneath the graph. The low plasma glucose levels in Agpat1−/− mice were not due to hyperinsulinemia [(D) male; (E) female]. There was also no difference in glucagon levels in Agpat1−/− mice compared with WT mice [(F) male; (G) female]. (H) A survival curve was generated by administration of glucose (100 μL of 20% glucose per mouse per day) until the death of the mouse, which did not change the survivability of Agpat1−/− mice. The line horizontal graph-width line at 50% represents the %50% survivability. Survival curve P value was determined by the generalized Wilcoxon test followed by the Dunnett test for comparisons to the control group. Dot plot P value was determined by two-tailed Student t test. ♂, male; ♀, female.

