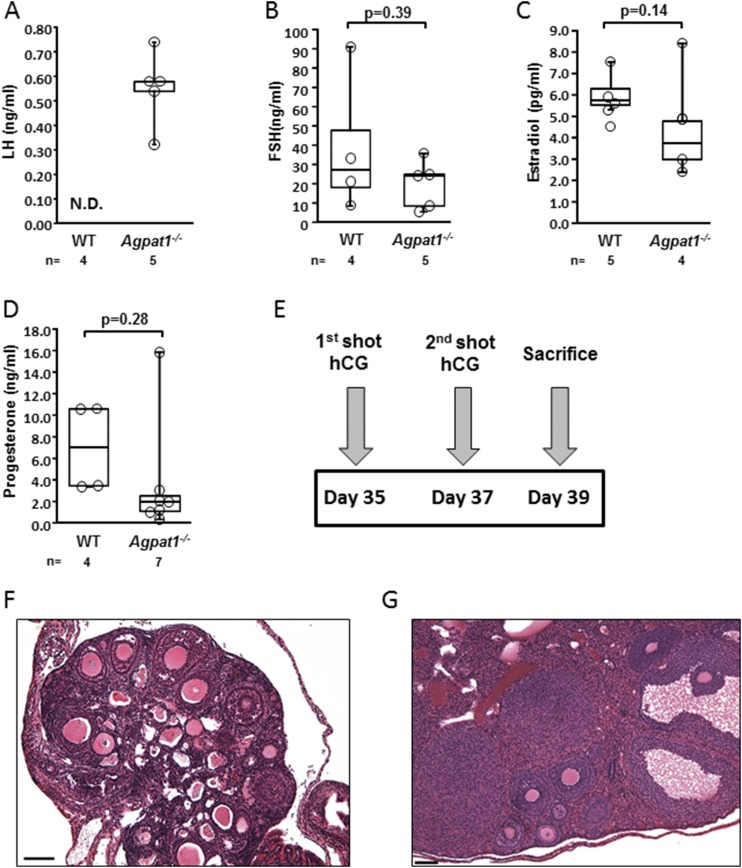
Figure 7.
The ovaries of Agpat1−/− mice were responsive to human chorionic gonadotropin (hCG) stimulation. The levels of (A) LH, (B) FSH, (C) estradiol, and (D) progesterone in WT and Agpat1−/− plasma at 6 weeks are shown. (E) The treatment schedule of mice injected with hCG is shown. WT and Agpat1−/− mice were given hCG injections (5 IU) as shown in the schematic and were euthanized 2 days later. (F, G) The morphology of hematoxylin and eosin−stained ovarian sections from (F) untreated and (G) treated Agpat1−/− mice show an increase in distinct regions of the corpora lutea in treated female mice. Images are representative of three independent images. Scale, 100 μM. For the box-and-whisker plots, the boxes represent the 25th and 75th percentiles, the line represents the median, and the whiskers represent the minimum and maximum values. The number of animals used is shown underneath the graph. The P value was determined by two-tailed Student t test. N.D., not detectable.

