Abstract
In search of the sequence of pathogenic events leading to glucocorticoid-induced osteonecrosis, we determined the molecular, biomechanical, cellular, and vascular changes in the femur of C57BL/6 mice receiving prednisolone for 14, 28, or 42 days. The femoral head, but not the distal femur, of mice treated for 14 days showed a decrease in the expression of the hypoxia-inducible factor (Hif)-1α and vascular endothelial growth factor (VEGF), the number of osteoblasts, and bone formation rate and strength and showed an increase in osteoclasts. These changes were accompanied by conversion of the normal dendritic vasculature to pools of edema as detected by magnetic resonance imaging, providing robust diagnostic evidence of early osteonecrosis. At that time point, there were no detectable changes in bone density, cortical or cancellous bone architecture, midshaft or distal cancellous bone, or osteocyte apoptosis. In mice treated for 28 days, femoral head cancellous density, cortical width, and trabecular thickness decreased, and by 42 days the femoral heads had full-depth cortical penetrations and cancellous tissue osteonecrosis. These results indicate that the femoral head is a particularly sensitive anatomical site to the adverse effects of glucocorticoid excess on bone and that decreases of Hif-1α and VEGF expression, bone vascularity, and strength precede the loss of bone mass and microarchitectural deterioration, thus rendering the femoral head vulnerable to collapse.
Glucocorticoid-induced osteonecrosis of the murine femoral head is due to site-specific decreases in Hif-1α and VEGF expression, vascularity, and strength before loss of bone mass.
Using murine models, we have shown previously that the primary adverse skeletal effects of glucocorticoid excess are exerted directly on osteoclasts, osteoblasts, and osteocytes, prolonging the lifespan of the osteoclasts while decreasing the lifespan of osteoblasts and osteocytes (1–5). However, glucocorticoid excess decreases bone strength disproportionately to the decline in bone mass, and bone strength often fails before a change in bone density occurs (6–9). Bone quality can be adversely affected by several factors unaccounted for by bone density determinations, such as changes in cancellous architecture, cortical osteon density, collagen cross-linking, and osteocyte perilacunar bone (10–12).
Water represents at least 25% of the wet weight of bone, but the role of water in the viscoelastic properties of bone is not widely appreciated (5). The amount of water within bone affects its material properties, and whether the water is bound or mobile affects bone quality and strength (13–18). The amount of bound or restrained water in bone cavities and vascular passageways correlates with bone strength and resistance to fracture (13, 19). We have found that decrements in bone vascularity, blood flow, and water content contribute to the decrease in bone strength that occurs with glucocorticoid excess and old age (5). The importance of water in the functional properties of bone is clinically used in the diagnosis of osteonecrosis. In patients with glucocorticoid-induced osteonecrosis of the femoral head, the abnormal distribution of bone water is detected using magnetic resonance imaging (MRI), but how this misdistribution occurs and why the femoral head is particularly at risk is unknown (20–22).
Impaired microcirculation of the femoral head may account in part for the vulnerability to osteonecrosis (23, 24). Angiogenesis and osteogenesis are coupled by a specific vessel subtype in bone (25). Furthermore, vascularity is critical for bone turnover and depends on the hypoxia-inducible factor (Hif)-1α pathway (26). Activation of this pathway in osteoblasts upregulates vascular endothelial growth factor (VEGF) and stimulates bone regeneration (27). This pathway may be particularly important in the femoral head, which requires continual remodeling to maintain strength under the load it supports (28). In addition, disruption of the vascularity of the femoral head could compromise delivery of nutrients and oxygen as well as waste removal in addition to decreasing hydraulic support (5, 21).
Considerable evidence indicates that glucocorticoid-induced osteonecrosis of the femoral head is dependent on the route and regimen of the glucocorticoid treatment (22, 29). Repeated administration of large pharmacologic doses of glucocorticoids, otherwise termed “pulse steroid therapy,” is associated with a greater risk of osteonecrosis of the femoral head than with steady-state treatment (30–33). In this study, we investigated the mechanisms responsible for the susceptibility of the femoral head to repeated pulses of glucocorticoids in mice. The femur of C57BL/6 mice provides an excellent model for studying diseases of bone vascularity (34). We report that a decrease in Hif-1α expression and the biomechanical properties of the femoral head occurred before changes in bone mineral density (BMD), cancellous and cortical bone, or osteocyte apoptosis and prior to changes in the distal femur or vertebrae. The femoral head changes were accompanied by a striking increase in femoral head edema detected by MRI-robust diagnostic evidence of osteonecrosis and a potential link between the redistribution of water in the osteonecrotic femoral head and decreased strength.
Materials and Methods
Animals
C57BL/6 male mice were purchased from Harlan Sprague Dawley (Indianapolis, IN). Experiments were done in 3-month-old and 7-month-old animals. The majority of our past work on the adverse effects of glucocorticoids on the skeleton was done with male mice (1–5). Mice were electronically tagged (Biomedic Data System Inc., Maywood, NJ) and kept in plastic cages (one animal per cage) under standard laboratory conditions with a 12-hour dark/12-hour light cycle and a constant temperature of 20°C and humidity of 48%. All mice were fed a standard rodent diet (RMH 3000; Agway, Arlington Heights, IL) containing 22% protein, 5% fat, 5% fiber, 6% ash, 3.5 Kcal/g, 1 IU vitamin D3/g, 0.97% calcium, and 0.85% phosphorus with water ad libitum. The Institutional Animal Care and Use Committee of the University of Arkansas for Medical Sciences approved these studies.
Glucocorticoid administration
To replicate systemic steroid pulse therapy, slow-release 90-day pellets of placebo or 2.1 mg/kg/d of prednisolone (Innovative Research of America, Sarasota, FL) were implanted at 14-day intervals. One to two days after implantation, this pellet delivers a steady glucocorticoid dose. However, the serum glucocorticoid level is substantially higher immediately after implantation before settling down to a steady state (35). Several days after implantation, the sequentially implanted pellets continually release 2.1 mg/kg/d of prednisolone, the equivalent of 20 mg/d of prednisone given to a human (1, 36). For dynamic histomorphometric measurements, tetracycline HCl (30 mg/kg body weight) was given intraperitoneally 8 and 4 days before animals were euthanized.
Quantitative reverse transcription polymerase chain reaction
Total messenger RNA (mRNA) was extracted using TRIzol® Reagent (Thermo Fisher, Foster City, CA). Osteocyte-enriched RNA from the separated femoral heads of both femurs from each animal was obtained after flushing with phosphate-buffered saline (Diamedix, Miami, FL) to remove the bone marrow and was then flash frozen in liquid nitrogen. Four femoral heads (from two animals) were pooled. Osteocyte-enriched RNA from the distal femur was also obtained after flushing with phosphate-buffered saline and flash frozen. Four distal femurs (from two animals) were pooled. Total mRNA from the entire fifth lumbar vertebra (L5) was also extracted. Equal amounts of RNA (1 μg) from each sample were reverse-transcribed using a High Capacity cDNA Archive Kit (Thermo Fisher). Aliquots of the reverse transcription products were amplified by reverse transcription polymerase chain reaction using TaqMan Universal PCR Master Mix (Thermo Fisher) on an ABI Prism 7000 Sequence Detection System (Thermo Fisher) as follows: 5-minute denaturation at 95°C for 10 minutes, 40 cycles of amplification including denaturation at 94°C for 15 seconds, and annealing/extension at 60°C for 1 minute. The primer and probe sets used were: mouse osteocalcin (OCN) forward, 5′-GCTGCGCTCTGTCTCTCTGA-3′, reverse, 5′-TGCTTGGACATGAAGGCTTTG-3′, probe, 5′-FAM-AAGCCCAGCGGCC-NFQ-3′; and predesigned primer/probe sets for the murine calcitonin receptor (CalR), Hif-1α, VEGF, prolyl hydroxylase (PHD) 2, erythropoietin-1 (Epo-1), osteoprotegerin (OPG), wingless-type MMTV integration site family, member 10b (Wnt10b), Wnt5a, and receptor activator of nuclear factor κB ligand (RANKL) (Thermo Fisher). Gene expression was calculated using the cycle threshold (Ct) method by subtracting the housekeeping gene ribosomal protein S2 Ct value from the Ct value of the gene of interest if the amplification efficiencies of the gene of interest and ribosomal protein S2 were equal, as previously described (4, 5, 9). Expression was also calculated using the housekeeping gene glyceraldehyde 3-phosphate dehydrogenase, with similar results.
BMD
BMD was measured in mice anesthetized with 2% isoflurane using a Piximus densitometer (GE-Lunar Corp., Madison, WI) with software version 2.0, as previously described (9).
Microcomputed tomography
Bone was examined at three skeletal sites: the femoral heads, the distal femora, and the sixth lumbar vertebrae. The ratio of cortical to cancellous bone contributes to bone strength (28). This ratio is quite similar in the femoral head and vertebrae because both have a high proportion of cancellous bone with a relatively thin cortex. Microcomputed tomography (µCT) analysis was done after the bones were dissected, cleaned, fixed in 10% Millonig formalin, transferred to ethanol, loaded into 12.3-mm-diameter scanning tubes, and imaged (μCT40; Scanco Medical, Basserdorf, Switzerland). Scans were integrated into three-dimensional voxel images (1024 × 1024 pixel matrices for each individual planar stack). A Gaussian filter (sigma = 0.8; support = 1) was used to reduce signal noise, and a threshold of 200 was applied to all analyzed scans. Scans were done at 12 µm resolution (E = 55 kVp; I = 145 µA; integration time, 200 ms). The entire femoral head and vertebral body were scanned with a transverse orientation excluding the trochanters and any bone outside the vertebral body. In the distal femur, 151 transverse slices were taken from the epicondyles and extending toward the proximal end of the femur. Manual analysis excluded the cortical bone and the primary spongiosa from the analysis. All trabecular measurements were made by manually drawing contours every 10 to 20 slices and using voxel counting for bone volume per tissue volume and sphere filling distance transformation indices without assumptions about the bone shape as a rod or plate for trabecular microarchitecture, as previously described (5).
Imaging of bone vasculature
The bone vascular bed was visualized after flushing the vasculature with heparinized saline (0.9% N) followed by 10% Millonig formalin and perfusing with a radiopaque lead chromate silicone rubber compound (Microfil MV-122; Flow Tech, Carver, MA) by intravenous drip through the left ventricle until it passed through the systemic vasculature and exuded from the inferior vena cava (5, 27). Afterward, animals were stored at 4°C for 24 hours to complete polymerization of the compound (n = 5 per group). Femora were fixed in 10% Millonig formalin for 24 hours and decalcified in formic acid (Cal Ex II; Fisher Scientific, Pittsburg, PA) for 24 to 48 hours. After transfer to 70% ethanol, µCT imaging was done at medium resolution (14 µm isotropic voxel size) using a threshold of 308.
MRI imaging of glucocorticoid-induced murine femoral head osteonecrosis
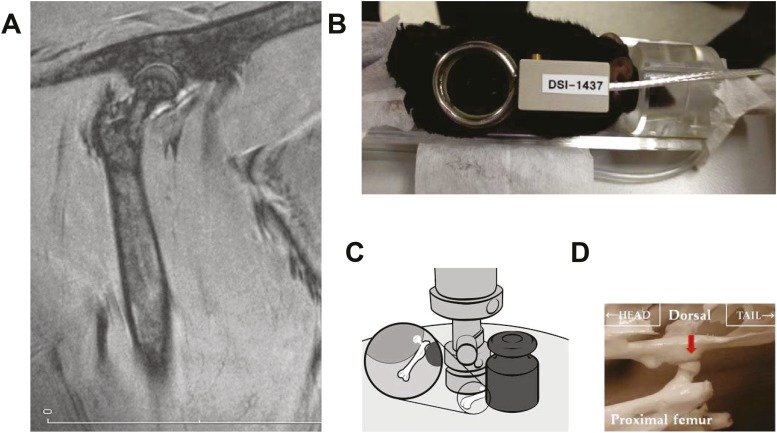
We imaged the 1-mm murine femoral head using a Bruker PharmaScan 7.0 Tesla MRI with an AVANCEIII console and custom-made surface coils (37) with diameters of 12, 16, and 20 mm (Doty Scientific, Inc., Columbia, SC) using three-dimensional, fast, low-angle, short imaging to emphasize T1 contrast (Fig. 1A and 1B). The sequence characteristics were: slice thickness, 0.33 mm; field of view, 2.56/2.56/1.60 cm; matrix, 512/512/48; repetition time, 15.0 ms; echo time, 3.0 ms; flip angle, 40.0 degrees; and acquisition time, 0 hours, 18 minutes, 25 seconds, 920 ms. MRI was performed on a small subset of animals because these mice were not allowed to return to the animal quarters after the procedure. The image intensity or density of the femoral heads was averaged across a manually drawn region of interest on the raw images and normalized to the averaged image intensity of the adjacent muscle area, calculated over a region of interest of the same size. All image analyses were performed using ImageJ software (https://imagej.nih.gov/ij/). The ratio of the intensity of bone over the muscle was calculated. In T1-weighted images, the higher number is most likely derived from the accumulation of water in the femoral head.
Figure 1.
(A) MRI showing an anatomical representation of the murine femoral head. (B) Placement of the MRI surface coil. (C) Apparatus used for compression testing. (D) Compression was done in the direction of the load (red arrow) carried by the femoral head.
Biomechanics
The load-bearing properties of the femoral head were measured at 25 ± 1.0°C using a single-column material testing machine and a calibrated tension/compression load cell (Model 5542; Instron Corp., Canton, MA). After preseating with <0.5 N of applied load, the femoral head was compressed between screw-driven loading platens. A 200-g mass from a standard weight calibration set was positioned against the protruding shaft of the proximal femur to prevent the force from moving the femoral head during the test (Fig. 1C). The compression was performed in the direction of the load borne by the rodent femoral head, causing the fracture to occur in the femoral head rather than the neck (Fig. 1D, red arrow). Generic ibuprofen tablets (200 mg) were used for quality control of the compression testing before the femoral heads of each group of animals were examined. In 51 sets of tests done over the past 2 years, compression of the tablets gave a mean ± standard deviation of 105.3 ± 8.5 N (coefficient of variation, 8.5%). The diameter of the femoral head was measured with a digital caliper at a resolution of 0.01 mm (Mitutoyo catalog no. 500-196; Ace Tools, Ft. Smith, AR), and the volume was calculated assuming a spherical shape (V = 4/3πr3). For comparison with the biomechanical properties of the femoral head, we also measured the load-bearing properties of the lumbar vertebrae and performed three-point bending of the femoral diaphysis as previously described (5, 9). The mechanical properties were normalized for bone size, and ultimate strength or stress (N/mm2; in megapascals or MPa) was calculated. The modulus of elasticity (intrinsic stiffness) was calculated in MPa from the linear region of the stress/strain curve.
Bone histomorphometry
The femoral heads were fixed and embedded undecalcified in methyl methacrylate, and the histomorphometric examination was done on longitudinal sections using the OsteoMeasure Analysis System (Osteometrics, Inc., Decatur, GA) as previously described (1–3, 9). Additional 5-μm-thick sections were examined at magnifications of ×400 to ×630 to search for microdamage. Bone formation rate was defined as the distance between the double tetracycline labels multiplied by the sum of the double-labeled perimeter plus one-half of the single-labeled perimeters. Due to inconsistencies with the transferase used in the terminal deoxynucleotidyltransferase-mediated dUTP nick end labeling assay on undecalcified bone sections, osteocyte apoptosis was assessed by enumerating the percentage of empty cancellous and cortical osteocytic lacunae.
Statistics
To investigate treatment effects for the various measurements, comparisons were made using one-way analysis of variance with the Sidak correction for multiple comparisons (STATA Statistical Software release 8.2; StatCorp, College Station, TX). P values <0.05 were considered significant. Comparisons of interest were specified a prioi. To determine pairwise differences between the placebo control group and the prednisone groups, two-group comparisons were analyzed using the unpaired Student t test. When results were not normally distributed, a Kruskal-Wallis test was used. The data are shown in box plots. The box extends from the first to third quartiles with outliers more than 1.5 the interquartile range plotted individually. The horizontal line is the median. Whiskers extend to the most extreme data point that is no more than 1.5 interquartile range from the edge of the box.
Results
Bone formation is accelerated in the femoral head
In 3-month-old C57BL/6 control mice, tetracycline labels in the cancellous bone of the femoral head were more intensely fluorescent than those in the distal femur. Femoral head tetracycline was increased in both linear extent and separation of the double labels. The cancellous bone formation rate (BFR) of the femoral head was more than threefold greater than that of the distal femur (Fig. 2A). Using µCT to examine the anatomical features of the femoral head and distal femur, we noted that the area of the arterial foramen of the femoral head (227 µm2) was 10-fold smaller than that of the nutrient foramen of the proximal femoral shaft (2213 µm2) (Fig. 2B).
Figure 2.
Unique features of the femoral head. (A) Bone formation rate in the cancellous bone of the femoral head vs distal femoral metaphysis. The insets show the double tetracycline labels from each site. **P < 0.01 (n = 11). (B) µCT images of the murine femoral head. On the left, coronal sectioning reveals that the distribution of the cancellous bone of the proximal femur corresponds to the direction of the maximum principal stress (green arrow). On the right, the orange arrow points to the adequately sized proximal nutrient foramen, and the red arrow points to the far more limited arterial foramina of the femoral head.
Glucocorticoids rapidly decrease expression of femoral head Hif-1α, VEGF, RANKL, and OPG before changes at the distal femora
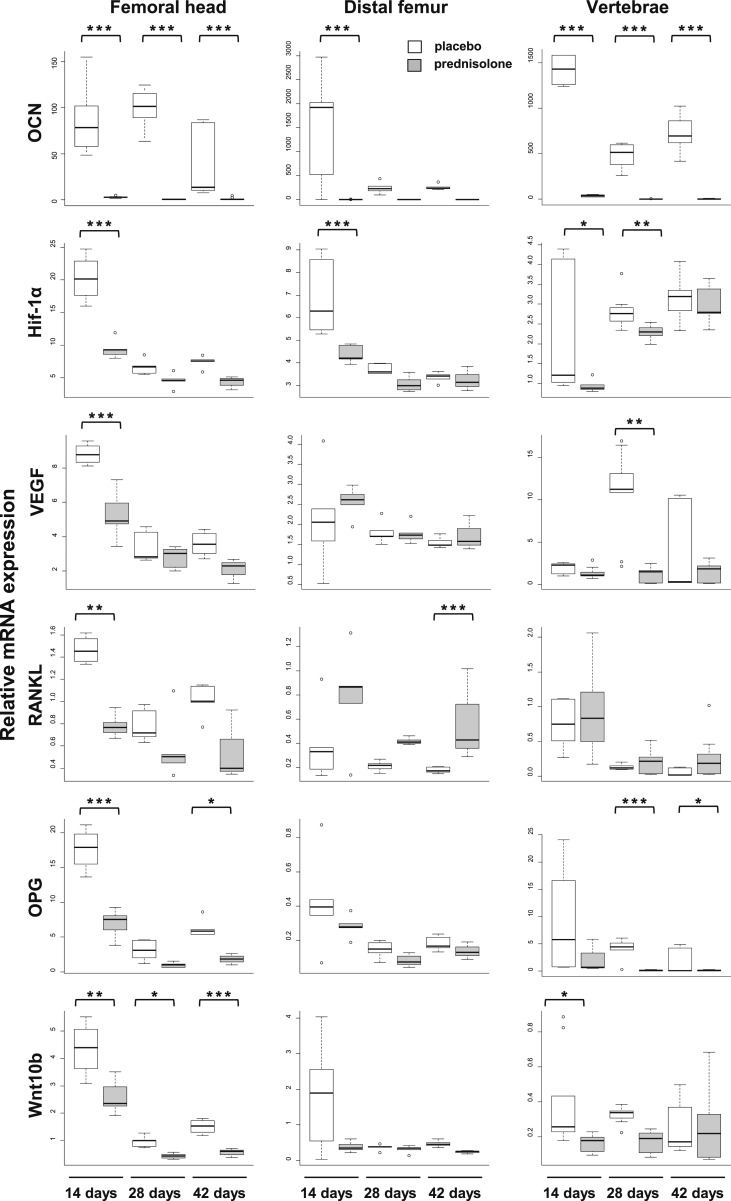
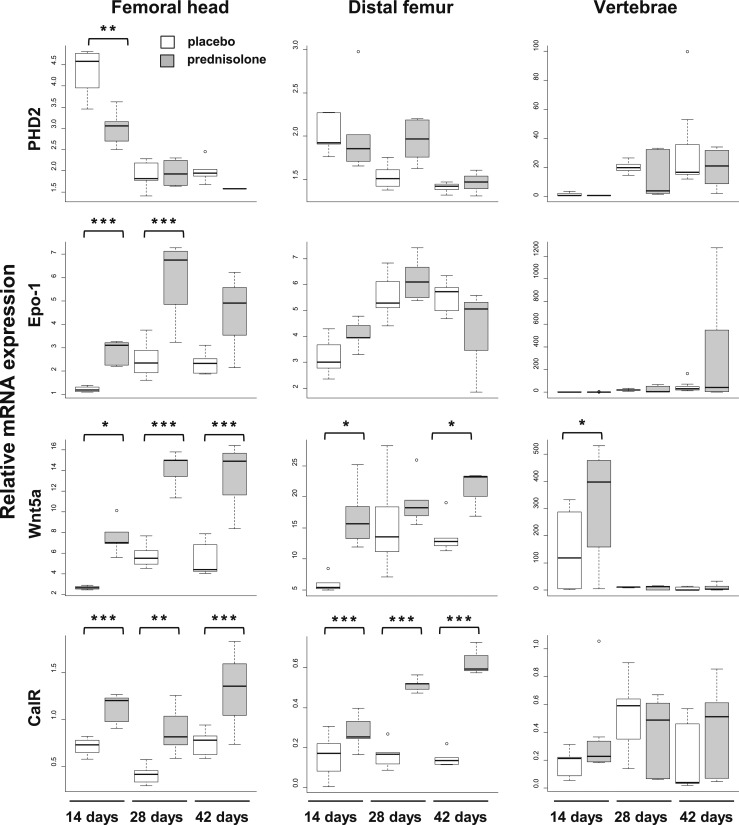
One, two, or three 14-day long pulses of glucocorticoids were given to 3-month-old mice. Necropsy was done at days 14, 28, and 42. At necropsy, there was no difference in weight between animals receiving placebo or prednisolone for 14 days, but there was significant weight loss in the animals receiving prednisolone for 28 and 42 days (Table 1). At 14 days, prednisolone caused a decrease in OCN expression in the femoral head, distal femur, and vertebrae, and this effect persisted throughout the experiment (Fig. 3). In mice receiving placebo, the expression of Hif-1α, RANKL, and OPG was considerably higher in the femoral head than in the distal femur. In the groups receiving placebo, there were inconsistent decreases in the expression of most messages in the distal femur by days 28 and 42, most likely reflecting a decreased rate of growth as these mice became older. Prednisolone caused a profound decrease in Hif-1α, VEGF, RANKL, OPG, and PHD2 mRNA in the femoral head at day 14. The decreases in VEGF, RANKL, OPG, and PHD2 mRNA expression in the femoral head occurred before changes in the distal femur or vertebrae. A decrease in Wnt10b expression in the femoral head and vertebrae was evident by day 14. Remarkably, in spite of the decrease in femoral head RANKL mRNA, Wnt5a, and CalR expression increased in the femoral head. As early as day 14 day, Epo-1 expression increased at the femoral head and remained increased at day 28.
Table 1.
Murine Body Weight
| Treatment | Age (mo) |
Body Weight (g) |
||
|---|---|---|---|---|
| 14 d | 28 d | 42 d | ||
| Placebo | 3 | 24.8 ± 1.5 | 27.0 ± 2.4 | 26.7 ± 1.7 |
| Prednisolone | 3 | 25.7 ± 1.3 | 24.5 ± 1.9a | 23.4 ± 3.6a |
| Placebo | 7 | 35.4 ± 1.2 | 39.8 ± 5.2 | 39.7 ± 6.3 |
| Prednisolone | 7 | 33.2 ± 2.3 | 30.3 ± 4.2a | 29.9 ± 5.9a |
Values are given as mean ± SD of measurements.
P < 0.02 vs placebo.
Figure 3.
mRNA expression in the femoral head, distal femur, and vertebrae after 14, 28, and 42 days of prednisolone administration. Glucocorticoids rapidly decrease expression of the hypoxia-inducible factor pathway in the femoral head. *P < 0.05; **P < 0.01; ***P < 0.001 (n = 5 pools of 2 mice each for femoral head and distal femur. In T1-weighted images, data point; n = 8 to 10 mice for the vertebral data).
There were no changes in the expression VEGF, OPG, Wnt10b, PHD2, and Epo-1 in the distal femur of mice receiving the drug for 14, 28, or 42 days. However, the expression of RANKL increased in the distal femur at day 42, but this did not occur at other sites or times.
Vertebral VEGF and OPG mRNA did not decrease until day 28. There was no change in the expression of RANKL, PHD2, Epo-1, and CalR in the vertebrae of mice receiving the drug for 14, 28, or 42 days. These site-selective changes suggest a preferential sensitivity of the femoral head to glucocorticoid administration.
Glucocorticoids decrease femoral head strength independently of osteocyte apoptosis
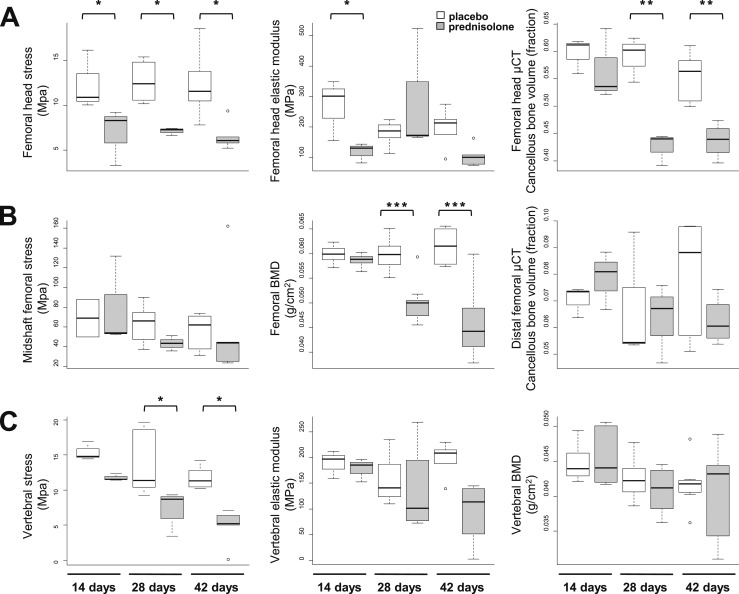
To eliminate the growth effects and to obtain larger femoral head specimens, a second set of experiments was done using 7-month-old mice. Due to animal losses associated with the prednisolone administration and the requirement for two mice for each femoral head and distal femoral data point, we were unable to repeat the mRNA expression examination in the 7-month-old mice. As in the younger mice, there was no difference in weight between animals receiving placebo or prednisolone for 14 days, but significant weight loss occurred in the animals receiving prednisolone for 28 and 42 days (Table 1). At 14 days, both femoral head strength and elastic modulus or flexibility decreased by 44% (P < 0.05) (Fig. 4A, first and second graphs) before changes in cancellous bone volume as determined by µCT (Fig. 4A, third graph). The femoral head changes occurred before changes in femoral BMD (Fig. 4B, second graph) and prior to any changes in the midshaft strength (Fig. 4B, first graph) or distal femoral cancellous bone volume (Fig. 4B, third graph).
Figure 4.
Bone strength, bone volume, and BMD in the femoral head, distal femur, and vertebrae after 14, 28, and 42 days of prednisolone administration. (A) Femoral head strength, modulus, and cancellous volume. (B) Midshaft femoral strength, femoral BMD, and distal femoral cancellous volume. (C) Vertebral strength, modulus, and BMD. Glucocorticoids decrease femoral head strength before decreasing femoral head cancellous bone volume. *P < 0.05; **P < 0.01; ***P < 0.001 (n = 3 to 8).
In mice receiving prednisolone for 28 days, femoral BMD (Fig. 4B, second graph) and femoral head cancellous bone volume (Fig. 4A, third graph) decreased, but no changes occurred in distal femoral µCT (Fig. 4B, third graph) or midshaft strength (Fig. 4B, first graph). Vertebral strength (Fig. 4C, first graph) did not decrease until day 28, when it declined by 24% (P < 0.01), which is about half of the loss previously noted at the femoral head. After 42 days of prednisolone administration, femoral head strength and cancellous bone volume (Fig. 4A) as well as femoral BMD (Fig. 4B, second graph) and vertebral strength (Fig. 4C, first graph) were significantly decreased, but there were still no changes in vertebral BMD (Fig. 4C, third graph), femoral midshaft strength (Fig. 4B, first graph), or distal femoral cancellous bone volume (Fig. 4B, third graph).
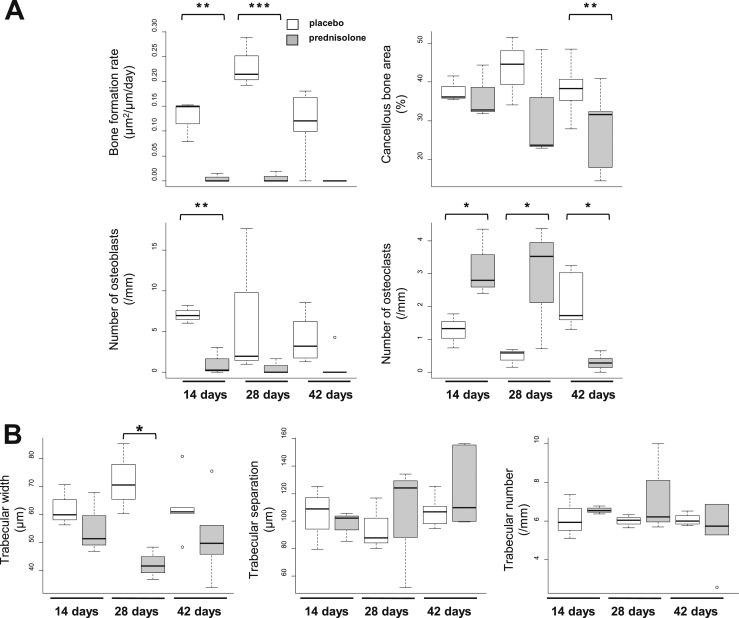
Bone histomorphometry showed that the BFR and the number of osteoblasts in the cancellous bone of the femoral head decreased after 14 days of prednisolone administration (Fig. 5A). The decrease in osteoblasts and bone formation was accompanied by a 2.5-fold increase in extraordinarily large, intensely tartrate-resistant acid phosphatase (TRAP)-stained cancellous osteoclasts (Fig. 5A). The increase in osteoclast numbers and size was also present in mice treated for 28 days but not in mice treated for 42 days because little femoral head cancellous bone remained in these animals (Fig. 5A). Osteoblast numbers remained low throughout the experiment. High-powered examination of the sections failed to reveal trabecular microfractures. The loss of femoral head cancellous bone volume by µCT was due to a decrease in trabecular width as determined by histomorphometry (Fig. 5B). Furthermore, examination after 14, 28, and 42 days of glucocorticoid administration showed that the trabecular separation and number were unaltered, indicating that cancellous integrity was maintained (Fig. 5B).
Figure 5.
Femoral head cancellous histomorphometry after 14, 28, and 42 days of prednisolone administration. (A) Bone formation rate, cancellous bone area, and number of osteoblasts and osteoclasts. (B) Cancellous microarchitecture. Glucocorticoids rapidly decrease the rate of bone formation and number of osteoblasts while increasing the number of osteoclasts in the cancellous bone of the femoral head. The unaltered trabecular separation and number indicate that the cancellous integrity was maintained. *P < 0.05; **P < 0.01; ***P < 0.001 (n = 3 to 6).
There were no changes in the number of empty cortical and cancellous osteocyte lacunae in the femoral heads of mice receiving prednisolone or placebo for 14 to 28 days (Fig. 6A), but, as expected, by day 42 empty osteocyte lacunae were increased in the cancellous bone of the femoral head and distal femur (Fig. 6B). This finding did not occur until 2 to 4 weeks after the loss of femoral head strength (Fig. 4A).
Figure 6.
Empty osteocyte lacunae in the cancellous and cortical bone of the femoral head and distal femur. (A) Femoral head. (B) Distal femur. The glucocorticoid-induced increase in empty osteocyte lacunae occurs much later than the loss of femoral head strength (see Fig. 3A). *P < 0.05; ***P < 0.001 (n = 3).
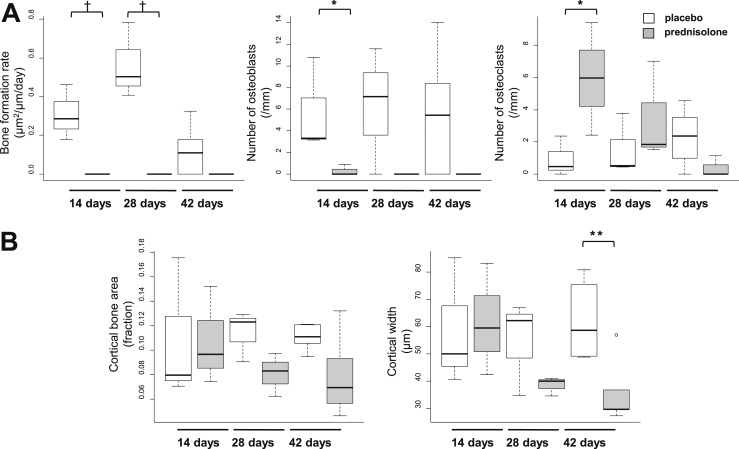
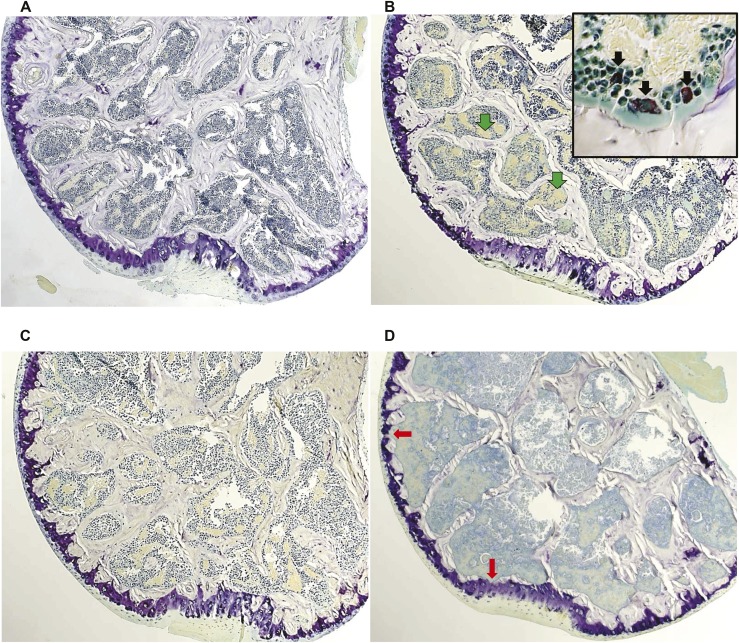
Similar to the changes noted in the cancellous bone of the femoral head, the BFR and number of osteoblasts at the endocortical perimeter of the femoral head decreased after 14 days of prednisolone and remained low in mice treated for 28 or 42 days (Fig. 7A). Cortical bone area did not change, but cortical width decreased after 42 days (Fig. 7B). As previously noted in the cancellous bone of the femoral head (Fig. 5A), there was a 6.3-fold increase in TRAP-positive osteoclasts on the endocortical perimeter after 14 days of treatment with prednisolone but not in mice treated for 28 or 42 days (Fig. 7A). The increased osteoclasts eventually caused interruptive deficits or bare areas in the cortical bone of the femoral head (Fig. 8D). The bare areas were not seen in the femoral heads of the mice receiving placebo (Fig. 8A). After 42 days of prednisolone administration, diffuse necrosis of the cancellous tissue and increased edema were noted (Fig. 8D). The pools of edema were not lined by endothelial cells.
Figure 7.
Femoral head cortical histomorphometry after 14, 28, and 42 days of prednisolone administration. (A) Endocortical bone formation rate and numbers of osteoblasts and osteoclasts. (B) Cortical area and width. Glucocorticoids rapidly decrease the number of osteoblasts and rate of bone formation while increasing the number of osteoclasts at endocortical margins. *P < 0.05; **P < 0.01; †P < 0.05 by Kruskal-Wallis test (n = 3 to 7).
Figure 8.
Femoral head sections after placebo and 14, 28, and 42 days of prednisolone administration. (A) Placebo control (magnification ×25). (B) After 14 days, increased pools of edema lacking an endothelial lining (green arrows) and abundant TRAP-positive osteoclasts are noted (inset, black arrows; magnification ×400). (C) After 28 days, a reduction in the cancellous architecture and cortical width occurred. (D) After 42 days, there was further loss of cancellous bone, increased edema, and diffuse necrosis of the cancellous tissue. Bare spots (red arrows) were found in cortical bone from the mice receiving prednisolone but not in those receiving placebo.
Femoral head vascularity was vulnerable to glucocorticoid-induced disruption
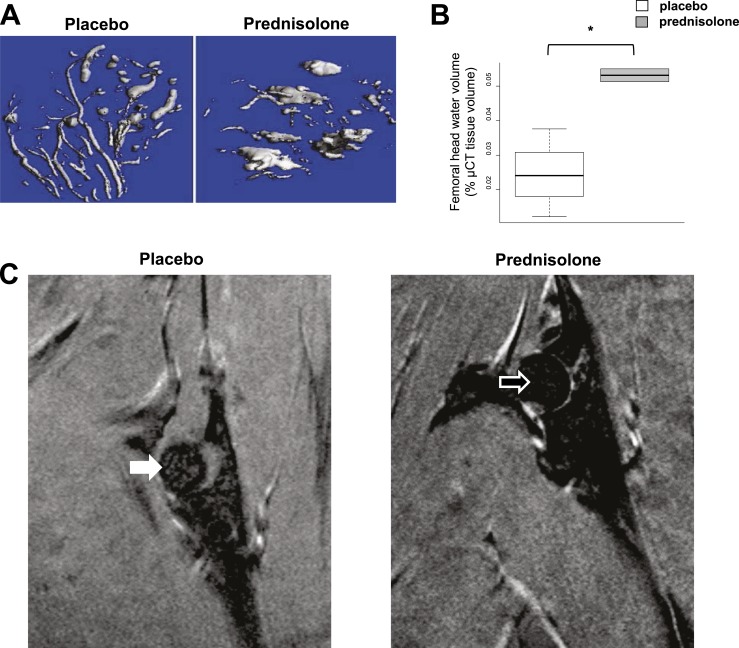
After 14 days of glucocorticoid administration, the normal dendritic pattern of the femoral head vasculature was converted to large pools of edema (Fig. 9A). Water restrained or bound by vessels was converted to mobile edema, increasing the volume of free water while decreasing intravascular water (Fig. 9B). We used MRI to verify this change in bone water distribution. MRI can detect excited hydrogen protons indicating bone marrow edema, criteria used as the basis for the early clinical diagnosis of osteonecrosis (20, 21, 38). MRI was done at 14 days in four mice receiving prednisolone and in three mice receiving placebo. In three of the four mice receiving prednisolone, the water signal in the femoral head tended to be greater than in the animals receiving placebo (Kruskal-Wallis test, P = 0.083). In some mice, the increased water signal in the femoral head after 14 days of prednisolone was striking (Fig. 9C).
Figure 9.
Femoral head vascularity after implantation of placebo or 14 days of prednisolone administration. (A) µCT after lead chromate infusion in the femoral head shows that prednisolone transforms the normal dendritic vascularity of the femoral head to large pools of edema. (B) Femoral head water volume. *P < 0.05 (n = 3). Water restrained or bound by vessels changed to more mobile free edema. (C) MRI obtained with T1 weighting reveals a higher image intensity ratio of the femoral head in the animal receiving prednisolone (open arrow, 0.334) than in the animal receiving placebo (closed arrow, 0.313), indicative of more free water or edema.
Discussion
Patients with osteonecrosis account for about 10% of the 250,000 total hip replacement surgeries done each year in the United States (39), and glucocorticoid administration is second only to trauma as the cause (20, 21). The adverse effect of glucocorticoid excess on the femoral head has been recognized for more than 65 years, but the precise molecular and cellular pathogenic events leading to osteonecrosis remain elusive (21, 40). Early suggestions of a vascular etiology were reflected in the term “avascular necrosis” applied to the disorder in spite of the evidence for intramedullary hemorrhages (20, 23, 24). Today, osteonecrosis develops in up to 40% of patients receiving long-term systemic therapy with glucocorticoids and may occur without widespread osteoporosis (20–22). Because the sequential pathological abnormalities that precede collapse of the hip remain obscure (20, 21), there are currently no plans for early diagnosis or a consensus for the evaluation or treatment of osteonecrosis of the femoral head before it becomes clinically manifested as localized pain (38).
The results of the current study in mice show that the head of the femur is particularly sensitive to the adverse effects of glucocorticoid excess on bone. Moreover, our results reveal that decreases of Hif-1α expression, bone vascularity, and strength precede the loss of bone mass and microarchitectural deterioration. Importantly, the femoral head changes were accompanied by a dramatic increase in femoral head edema, which is a key diagnostic feature of osteonecrosis in humans, suggesting a link between the redistribution of water in the osteonecrotic femoral head and the decreased strength. Based on these findings, we propose that the sequence of changes described herein and their predilection for the femoral head account for the unique early vulnerability of this anatomic site to glucocorticoid excess and ultimately lead to its catastrophic collapse.
Other important factors may contribute to this early disproportionate loss of strength before mass. The disruption in water circulation would also compromise the supply of nutrients and oxygen (5). In addition, glucocorticoids rapidly impair osteocyte perilacunar remodeling, resulting in hypermineralized regions and collagen disorganization with reduced elastic modulus and increased fragility (10, 12). Further compromise of bone strength would occur later with the deterioration of the cancellous microarchitecture and reduced trabecular width.
The rate of bone remodeling varies greatly among anatomical sites, likely reflecting the magnitude of the mechanical strains and the physical demand and hence the chances of microdamage. This relationship between mechanical loads and bone remodeling was noted in 1892 by Julius Wolff (28). The susceptibility of the femoral head to glucocorticoid-induced osteonecrosis may be the result of the high level of bone remodeling in this site caused by repeated loads of weight bearing during walking and standing. An additional predisposition to osteonecrosis may be the minimal blood supply of this region (Fig. 2B) (23, 24). In the work presented here, we have determined that the cancellous BFR of the murine femoral head under basal conditions is more than threefold greater than that of the distal femur (Fig. 2A). A higher BFR in the cancellous bone of the proximal femoral as compared with other skeletal regions has also been shown in humans (41). A 74-year-old woman with osteoporosis received two courses of oral tetracycline prior to a therapeutic trial but died suddenly about 2 weeks after iliac crest bone specimens were obtained. Necropsy did not reveal gastrointestinal, metabolic, or malignant disease. Afterward, bone specimens were removed from multiple skeletal sites. Akin to our findings in mice, the cancellous BFR was threefold greater in the left proximal femur than in the proximal tibia. The site-selective increase in BFR and the minimal blood supply suggest that the preferential sensitivity of the femoral head to osteonecrosis could be due the adverse effects of glucocorticoids on bone vascularity (5, 21).
The vascular compromise of the normal femoral head creates a particularly hypoxic microenvironment for osteocytes, resulting in limited availability of oxygen for Hif-specific PHD enzymes to hydroxylate Hif-1α (42). Support for this supposition is given by the evidence that the Hif-1α message is higher in the murine femoral head than in the distal femur (Fig. 3). Von Hippel-Lindau protein ubiquitin ligase complexes are unable to recognize nonhydroxylated Hif-1α, which translocates to the nucleus and stimulates more than 500 target genes, including those involved in bone formation (25–27). The earliest pathophysiologic change that results in glucocorticoid-induced osteonecrosis of the femoral head might therefore be the decrease in the message for Hif-1α with less reaching the nucleus, thus resulting in a decline in VEGF and vascular disruption. This disruption could result in decreased bone strength before any change in femoral head density, cancellous architecture, or cortical width. The MRI-documented changes in the murine femoral head water signal are diagnostic of osteonecrosis and thus may well account for the link between the rearrangement of bone water in the femoral head and decreased strength (13, 14, 17). We suggest that the vascular changes delineated by the early changes in lead chromate perfusion and MRI and later evidence of histological cancellous tissue necrosis represent proof that our mouse model recapitulates the clinical disease.
Definitive evidence that the early decreases in Hif-1α and VEGF are involved in glucocorticoid-induced osteonecrosis of the femoral head could be obtained by genetic manipulation of these proteins. However, previous studies have demonstrated that this results in a profound bone and vascular phenotype that would obfuscate the impact of glucocorticoid administration. Previous studies have shown that mice overexpressing Hif-1α in osteoblasts through selective deletion of the von Hippel-Lindau gene express high levels of VEGF and develop increased, hypervascularized cancellous bone in the femur. Conversely, mice with deletion of Hif-1α in osteoblasts develop poorly vascularized, osteoporotic femurs (26, 27). Mutations of the gene in humans also result in cardiovascular disease, including angiomatosis and hemangioblastomas. Nonetheless, the phenotype of mice with reduced Hif-1a expression is consistent with our proposal that the reduction observed in glucocorticoid-treated mice may contribute to reduced bone vascularity and strength. In addition, we have previously shown that glucocorticoids suppress both Hif-1α and VEGF mRNA levels in osteoblast and osteocytelike cell lines in as little as 16 hours (5). The relatively short time required for these effects is consistent with a mechanism involving transcriptional regulation, although mRNA half-life changes cannot be ruled out. Importantly, these in vitro studies suggest that the effects of glucocorticoids are directly on these cell types. This information and the present data support our contention that decreased expression of Hif-1α by glucocorticoids is the starting point of osteonecrosis of the femoral head.
Decreased angiogenesis is coupled to reduced osteogenesis (26), and a concurrent decrease in OCN, RANKL, OPG, and Wnt10b accompanied the decreases in osteoblasts and bone formation. In the presence of reduced PHD2, an increase in Epo-1 may stimulate bone resorption independently of changes in RANKL expression (43, 44) and cause an increase in mRNA for Wnt5a and the calcitonin receptor and osteoclast number. Other researchers have created this scenario with genetically modified animals (43, 44), and here we have caused it pharmacologically. The increased osteoclasts eventually caused deterioration of the cortical architecture, leading to cortical bone bare spots. These findings suggest that, if recognized early enough, the cortical architectural disruption may be amendable.
The pathogenesis of osteonecrosis at the time of the hip replacement has been partially elucidated, and glucocorticoid-induced osteocyte apoptosis is abundant. However, the sequential pathological abnormalities that precede replacement of the hip remain obscure (45). We found that the murine femoral head strength failed before an increase in empty osteocyte lacunae. Empty osteocyte lacunae could represent apoptotic, necrotic, or dead osteocytes. However, other researchers have reported that glucocorticoids alter osteocyte function independently of apoptosis (10).
In summary, glucocorticoid-induced osteonecrosis of the hip has been thought over the years to result from increased marrow fat, fat embolism, hypercoagulability, or accumulation of fatigue fractures (20, 23, 24, 39). Instead, the present results strongly suggest that decreased expression of Hif-1α and VEGF and loss of the normal dendritic vascularity are among the earliest changes that accompany the loss of strength. Therefore, the early term applied to the disorder, “avascular,” may be more accurate than previously realized.
Acknowledgments
We thank magnetic resonance technologist Terri Alpe, the UAMS Molecular Imaging Core for the MRI, radiologists Tarun Pandy and Kedar Jambhekar for help with the imaging, and Stuart Berryhill for help with the biomechanical studies. This document has been reviewed in accordance with US Food and Drug Administration’s policy and approved for publication. Approval does not signify that the contents necessarily reflect the position or opinions of the FDA, nor does mention of trade names or commercial products constitute endorsement or recommendation for use. The findings and conclusions in this report are those of the authors and do not necessarily represent the views of the FDA.
Financial Support: This work was supported by the Office of Research and Development, Department of Veterans Affairs VA Merit Review Grants I01 BX000436-08 (to R.S.W.), I01 BX001405 (to S.C.M.), and I01 BX000294 (to C.A.O.), by the National Institutes of Health Grant P01-AG13918, and by Tobacco Settlement Funds provided by the University of Arkansas for Medical Sciences College of Medicine.
Author Contributions: R.S.W. designed the studies, interpreted the data, and wrote the first draft of the manuscript. E.A.H. conducted the animal husbandry and carried out the studies, obtaining mRNA and histological information, performing the lead chromate injection, and acquiring histomorphometric measurements. M.J.B. and S.L. assisted with the MRI. C.A.O. and S.C.M. helped to write the manuscript.
Acknowledgments
Disclosure Summary: The authors have nothing to disclose.
Footnotes
- BFR
- bone formation rate
- BMD
- bone mineral density
- CalR
- calcitonin receptor
- Ct
- cycle threshold
- Epo-1
- erythropoietin-1
- Hif
- hypoxia-inducible factor
- MRI
- magnetic resonance imaging
- mRNA
- messenger RNA
- OCN
- osteocalcin
- OPG
- osteoprotegerin
- PHD
- prolyl hydroxylase
- RANKL
- receptor activator of nuclear factor κB ligand
- TRAP
- tartrate-resistant acid phosphatase
- VEGF
- vascular endothelial growth factor
- Wnt10b
- wingless-type MMTV integration site family, member 10b
- µCT
- microcomputed tomography.
References
- 1.Weinstein RS, Jilka RL, Parfitt AM, Manolagas SC. Inhibition of osteoblastogenesis and promotion of apoptosis of osteoblasts and osteocytes by glucocorticoids: potential mechanisms of their deleterious effects on bone. J Clin Invest. 1998;102(2):274–282. [DOI] [PMC free article] [PubMed] [Google Scholar]
- 2.Weinstein RS, Chen JR, Powers CC, Stewart SA, Landes RD, Bellido T, Jilka RL, Parfitt AM, Manolagas SC. Promotion of osteoclast survival and antagonism of bisphosphonate-induced osteoclast apoptosis by glucocorticoids. J Clin Invest. 2002;109(8):1041–1048. [DOI] [PMC free article] [PubMed] [Google Scholar]
- 3.O’Brien CA, Jia D, Plotkin LI, Bellido T, Powers CC, Stewart SA, Manolagas SC, Weinstein RS. Glucocorticoids act directly on osteoblasts and osteocytes to induce their apoptosis and reduce bone formation and strength. Endocrinology. 2004;145(4):1835–1841. [DOI] [PubMed] [Google Scholar]
- 4.Jia D, O’Brien CA, Stewart SA, Manolagas SC, Weinstein RS. Glucocorticoids act directly on osteoclasts to increase their life span and reduce bone density. Endocrinology. 2006;147(12):5592–5599. [DOI] [PMC free article] [PubMed] [Google Scholar]
- 5.Weinstein RS, Wan C, Liu Q, Wang Y, Almeida M, O’Brien CA, Thostenson J, Roberson PK, Boskey AL, Clemens TL, Manolagas SC. Endogenous glucocorticoids decrease skeletal angiogenesis, vascularity, hydration, and strength in aged mice. Aging Cell. 2010;9(2):147–161. [DOI] [PMC free article] [PubMed] [Google Scholar]
- 6.Peel NFA, Moore DJ, Barrington NA, Bax DE, Eastell R. Risk of vertebral fracture and relationship to bone mineral density in steroid treated rheumatoid arthritis. Ann Rheum Dis. 1995;54(10):801–806. [DOI] [PMC free article] [PubMed] [Google Scholar]
- 7.Manolagas SC. Corticosteroids and fractures: a close encounter of the third cell kind. J Bone Miner Res. 2000;15(6):1001–1005. [DOI] [PubMed] [Google Scholar]
- 8.Van Staa TP, Laan RF, Barton IP, Cohen S, Reid DM, Cooper C. Bone density threshold and other predictors of vertebral fracture in patients receiving oral glucocorticoid therapy. Arthritis Rheum. 2003;48(11):3224–3229. [DOI] [PubMed] [Google Scholar]
- 9.Almeida M, Han L, Martin-Millan M, Plotkin LI, Stewart SA, Roberson PK, Kousteni S, O’Brien CA, Bellido T, Parfitt AM, Weinstein RS, Jilka RL, Manolagas SC. Skeletal involution by age-associated oxidative stress and its acceleration by loss of sex steroids. J Biol Chem. 2007;282(37):27285–27297. [DOI] [PMC free article] [PubMed] [Google Scholar]
- 10.Fowler TW, Acevedo C, Mazur CM, Hall-Glenn F, Fields AJ, Bale HA, Ritchie RO, Lotz JC, Vail TP, Alliston T. Glucocorticoid suppression of osteocyte perilacunar remodeling is associated with subchondral bone degeneration in osteonecrosis. Sci Rep. 2017;7:44618. [DOI] [PMC free article] [PubMed] [Google Scholar]
- 11.Zimmermann EA, Schaible E, Bale H, Barth HD, Tang SY, Reichert P, Busse B, Alliston T, Ager JW III, Ritchie RO. Age-related changes in the plasticity and toughness of human cortical bone at multiple length scales [published correction appears in Proc Natl Acad Sci USA 2012;109(29):11890] Proc Natl Acad Sci USA. 2011;108(35):14416–14421. [DOI] [PMC free article] [PubMed] [Google Scholar]
- 12.Lane NE, Yao W, Balooch M, Nalla RK, Balooch G, Habelitz S, Kinney JH, Bonewald LF. Glucocorticoid-treated mice have localized changes in trabecular bone material properties and osteocyte lacunar size that are not observed in placebo-treated or estrogen-deficient mice. J Bone Miner Res. 2006;21(3):466–476. [DOI] [PMC free article] [PubMed] [Google Scholar]
- 13.Nyman JS, Ni Q, Nicolella DP, Wang X. Measurements of mobile and bound water by nuclear magnetic resonance correlate with mechanical properties of bone. Bone. 2008;42(1):193–199. [DOI] [PMC free article] [PubMed] [Google Scholar]
- 14.Lien J, Kaye M. Changes in the red cell, plasma and inulin spaces and in the total water contents of rat femurs in cortisone induced osteoporosis. Calcif Tissue Res. 1978;25(3):245–248. [DOI] [PubMed] [Google Scholar]
- 15.Ishijima H, Ishizaka H, Horikoshi H, Sakurai M. Water fraction of lumbar vertebral bone marrow estimated from chemical shift mis-registration on MR imaging. AJR Am J Roentgenol. 1996;167:355–358. [DOI] [PubMed] [Google Scholar]
- 16.Prisby RD, Ramsey MW, Behnke BJ, Dominguez JM II, Donato AJ, Allen MR, Delp MD. Aging reduces skeletal blood flow, endothelium-dependent vasodilation, and NO bioavailability in rats. J Bone Miner Res. 2007;22(8):1280–1288. [DOI] [PubMed] [Google Scholar]
- 17.Miserez A, Schneberk T, Sun C, Zok FW, Waite JH. The transition from stiff to compliant materials in squid beaks. Science. 2008;319(5871):1816–1819. [DOI] [PMC free article] [PubMed] [Google Scholar]
- 18.Wilson EE, Awonusi A, Morris MD, Kohn DH, Tecklenburg MM, Beck LW. Three structural roles for water in bone observed by solid-state NMR. Biophys J. 2006;90(10):3722–3731. [DOI] [PMC free article] [PubMed] [Google Scholar]
- 19.Liebschner MAK, Keller TS. Hydraulic strengthening affects the stiffness and strength of cortical bone. Ann Biomed Eng. 2005;33(1):26–38. [DOI] [PubMed] [Google Scholar]
- 20.Mankin HJ. Nontraumatic necrosis of bone (osteonecrosis). N Engl J Med. 1992;326(22):1473–1479. [DOI] [PubMed] [Google Scholar]
- 21.Weinstein RS. Glucocorticoid-induced osteonecrosis. Endocrine. 2012;41(2):183–190. [DOI] [PMC free article] [PubMed] [Google Scholar]
- 22.Shigemura T, Nakamura J, Kishida S, Harada Y, Ohtori S, Kamikawa K, Ochiai N, Takahashi K. Incidence of osteonecrosis associated with corticosteroid therapy among different underlying diseases: prospective MRI study. Rheumatology (Oxford). 2011;50(11):2023–2028. [DOI] [PubMed] [Google Scholar]
- 23.Johnson EO, Soultanis K, Soucacos PN. Vascular anatomy and microcirculation of skeletal zones vulnerable to osteonecrosis: vascularization of the femoral head. Orthop Clin North Am. 2004;35(3):285–291, viii. [DOI] [PubMed] [Google Scholar]
- 24.Saito S, Ohzono K, Ono K. Early arteriopathy and postulated pathogenesis of osteonecrosis of the femoral head: the intracapital arterioles. Clin Orthop Relat Res. 1992;(277):98–110. [PubMed]
- 25.Kusumbe AP, Ramasamy SK, Adams RH. Coupling of angiogenesis and osteogenesis by a specific vessel subtype in bone. Nature. 2014;507(7492):323–328. [DOI] [PMC free article] [PubMed] [Google Scholar]
- 26.Wan C, Gilbert SR, Wang Y, Cao X, Shen X, Ramaswamy G, Jacobsen KA, Alaql ZS, Eberhardt AW, Gerstenfeld LC, Einhorn TA, Deng L, Clemens TL. Activation of the hypoxia-inducible factor-1α pathway accelerates bone regeneration. Proc Natl Acad Sci USA. 2008;105(2):686–691. [DOI] [PMC free article] [PubMed] [Google Scholar]
- 27.Wang Y, Wan C, Deng L, Liu X, Cao X, Gilbert SR, Bouxsein ML, Faugere MC, Guldberg RE, Gerstenfeld LC, Haase VH, Johnson RS, Schipani E, Clemens TL. The hypoxia-inducible factor alpha pathway couples angiogenesis to osteogenesis during skeletal development. J Clin Invest. 2007;117(6):1616–1626. [DOI] [PMC free article] [PubMed] [Google Scholar]
- 28.Frost HM. Bone Remodelling Dynamics. Springfield, IL: CC Thomas; 1963. [Google Scholar]
- 29.Sinha A, Bagga A. Pulse steroid therapy. Indian J Pediatr. 2008;75(10):1057–1066. [DOI] [PubMed] [Google Scholar]
- 30.Ce P, Gedizlioglu M, Gelal F, Coban P, Ozbek G. Avascular necrosis of the bones: an overlooked complication of pulse steroid treatment of multiple sclerosis. Eur J Neurol. 2006;13(8):857–861. [DOI] [PubMed] [Google Scholar]
- 31.Nagasawa K, Tada Y, Koarada S, Horiuchi T, Tsukamoto H, Murai K, Ueda A, Yoshizawa S, Ohta A. Very early development of steroid-associated osteonecrosis of femoral head in systemic lupus erythematosus: prospective study by MRI. Lupus. 2005;14(5):385–390. [DOI] [PubMed] [Google Scholar]
- 32.Chan KL, Mok CC. Glucocorticoid-induced avascular bone necrosis: diagnosis and management. Open Orthop J. 2012;6:449–457. [DOI] [PMC free article] [PubMed] [Google Scholar]
- 33.Williams IA, Mitchell AD, Rothman W, Tallett P, Williams K, Pitt P. Survey of the long term incidence of osteonecrosis of the hip and adverse medical events in rheumatoid arthritis after high dose intravenous methylprednisolone. Ann Rheum Dis. 1988;47(11):930–933. [DOI] [PMC free article] [PubMed] [Google Scholar]
- 34.Cole HA, Yuasa M, Hawley G, Cates JMM, Nyman JS, Schoenecker JG. Differential development of the distal and proximal femoral epiphysis and physis in mice. Bone. 2013;52(1):337–346. [DOI] [PubMed] [Google Scholar]
- 35.Defranco DJ, Lian JB, Glowacki J. Differential effects of glucocorticoid on recruitment and activity of osteoclasts induced by normal and osteocalcin-deficient bone implanted in rats. Endocrinology. 1992;131(1):114–121. [DOI] [PubMed] [Google Scholar]
- 36.Weinstein RS, O’Brien CA, Almeida M, Zhao H, Roberson PK, Jilka RL, Manolagas SC. Osteoprotegerin prevents glucocorticoid-induced osteocyte apoptosis in mice. Endocrinology. 2011;152(9):3323–3331. [DOI] [PMC free article] [PubMed] [Google Scholar]
- 37.Rivera M, Vaquero JJ, Santos A, Ruiz-Cabello J, del Pozo F. MRI visualization of small structures using improved surface coils. Magn Reson Imaging. 1998;16(2):157–166. [DOI] [PubMed] [Google Scholar]
- 38.McGrory BJ, York SC, Iorio R, Macaulay W, Pelker RR, Parsley BS, Teeny SM. Current practices of AAHKS members in the treatment of adult osteonecrosis of the femoral head. J Bone Joint Surg Am. 2007;89(6):1194–1204. [DOI] [PubMed] [Google Scholar]
- 39.Moya-Angeler J, Gianakos AL, Villa JC, Ni A, Lane JM. Current concepts on osteonecrosis of the femoral head. World J Orthop. 2015;6(8):590–601. [DOI] [PMC free article] [PubMed] [Google Scholar]
- 40.Boland EW, Headley NE. Management of rheumatoid arthritis with smaller (maintenance) doses of cortisone acetate. J Am Med Assoc. 1950;144(5):365–372. [DOI] [PubMed] [Google Scholar]
- 41.Pødenphant J, Engel U. Regional variations in histomorphometric bone dynamics from the skeleton of an osteoporotic woman. Calcif Tissue Int. 1987;40(4):184–188. [DOI] [PubMed] [Google Scholar]
- 42.Simon MC. The hypoxia response pathway: hats off! N Engl J Med. 2016;375(17):1687–1689. [DOI] [PMC free article] [PubMed] [Google Scholar]
- 43.Rauner M, Franke K, Murray M, Singh RP, Hiram-Bab S, Platzbecker U, Gassmann M, Socolovsky M, Neumann D, Gabet Y, Chavakis T, Hofbauer LC, Wielockx B. Increased EPO levels are associated with bone loss in mice lacking PHD2 in EPO-producing cells. J Bone Miner Res. 2016;31(10):1877–1887. [DOI] [PubMed] [Google Scholar]
- 44.Hiram-Bab S, Liron T, Deshet-Unger N, Mittelman M, Gassmann M, Rauner M, Franke K, Wielockx B, Neumann D, Gabet Y. Erythropoietin directly stimulates osteoclast precursors and induces bone loss. FASEB J. 2015;29(5):1890–1900. [DOI] [PubMed] [Google Scholar]
- 45.Weinstein RS, Nicholas RW, Manolagas SC. Apoptosis of osteocytes in glucocorticoid-induced osteonecrosis of the hip. J Clin Endocrinol Metab. 2000;85(8):2907–2912. [DOI] [PubMed] [Google Scholar]


