

1. Introduction
More than 15 years after the publication of the Institute of Medicine’s (IOM) landmark study estimating that medical error was among the five leading causes of death in the U.S. (IOM, 2000). A related IOM report, Keeping Patients Safe: Transforming Nurse Work Environments (IOM, 2004), concluded that good nurse work environments were essential building blocks for improving patient safety. Yet the patient safety movement has been more focused on improving the patient safety climate in hospitals than on “transforming” nurse work environments. A recent updated estimate of hospital mortality associated with medical error was 2.5 times greater than the 98,000 deaths estimated by the IOM in 1999 (Makary & Daniel, 2016). These observations raise an important question about whether nurse practice environments and patient safety climate are the same or different concepts.
Globally, healthcare errors and adverse events claim millions of lives each year and result in significant excess medical costs (Aranaz-Andrés et al., 2011; Hogan et al., 2015; James, 2013; Jha et al., 2013; Makary & Daniel, 2016). Hospital administrators, policy makers, and researchers have sought to identify modifiable factors that could decrease the morbidity and mortality associated with adverse events. The nurse work environment has long been established as an important, and modifiable, organizational trait that impacts patient outcomes (Aiken et al., 2011; Carthon et al., 2015; Cho et al., 2014; Clarke et al., 2002; Clarke, 2007; Estabrooks et al., 2005; Friese et al., 2008; Gunnarsdóttir et al., 2009; Kelly et al., 2014; Kirwan et al., 2013; Kutney-Lee et al., 2009; Lake et al., 2016; Lasater and Mchugh, 2016; Ma et al., 2015a, 2015b; Spence Laschinger and Leiter, 2006; Vahey et al., 2004). It is characterized as the set of “organizational characteristics of a work setting that facilitate or constrain professional nursing practice” (Lake, 2002). A professional nurse work environment is characterized as having adequate staffing, managerial support for nurses, and good nurse-physician relations. This environment encourages nurses to think critically about medical and nursing orders, make recommendations for the care plan, and offer advice about the best ways to care for a patient (“Magnet: Empowering nurses”, 2005).
Research documents an association between the nurse work environment and patient mortality (Aiken et al., 2008; Aiken et al., 2011; Cho et al., 2014; Estabrooks et al., 2005; Friese et al., 2008; Kelly et al., 2014; Silber et al., 2016), failure to rescue (Aiken et al., 2008; Friese et al., 2008), readmissions (Carthon et al., 2015; Lasater and McHugh, 2016; Ma et al., 2015a), adverse patient events and complications (Friese et al., 2008; Lake et al., 2016; Spence Laschinger and Leiter, 2006), and nurse-rated quality of care (Aiken et al., 2008; Friese, 2005; Gunnarsdóttir et al., 2009; Lake et al., 2016; Ma et al., 2015b). The nurse work environment is a cornerstone of the American Nurses Credentialing Center’s Magnet designation and is included as a nurse sensitive measure by the National Quality Forum (NQF). Because of the strong association between the nurse work environment and patient outcomes, the NQF endorsed the Practice Environment Scale of the Nursing Work Index (PES-NWI) in 2004, with renewed endorsements in 2009 and 2012 (“National Quality Forum”, 2015).
Although there is a strong relationship between the nurse work environment and patient outcomes, the healthcare safety literature has instead largely focused on safety climate as a key organizational determinant of patient safety. Safety climate is the perception of the state of safety among individuals at a point in time (Zhang et al., 2002). It has been associated with adverse patient events and complications (Birkmeyer et al., 2013; Bonner et al., 2009; Davenport et al., 2007; Kline et al., 2008; Mardon et al., 2010; Singer et al., 2009; Taylor et al., 2012; Weaver et al., 2014; Weingart et al., 2004), length of stay (Huang et al., 2010), and readmissions (Hansen et al., 2011). Organizations such as the Joint Commission, the National Health Service in the United Kingdom, and the Canadian Council on Health Services Accreditation, either require or encourage hospitals to measure and improve their safety climate (Ginsburg et al., 2009; Pronovost et al., 2006).
Although nurses frequently report on safety climate, it does not fully capture the general working conditions of nurses. Safety climate is, by its nature, more narrowly focused on the perception of safety at a point in time (Zhang et al., 2002). The concept encompasses specific elements of the organization that are thought to increase or decrease the incidence of adverse events and errors. Two studies have examined the relationship between work environment and how nurses grade the safety of their units or hospitals. Nurses in U.S. and European hospitals with better work environments were half as likely to give their hospitals a poor or failing safety grade (Aiken et al., 2012). Similarly, nurses in neonatal intensive care units with better work environments have lower odds of reporting a fair or poor grade for patient safety (Lake et al., 2016). However, to date there has not been an examination of work environment and safety climate.
Because both the work environment and safety climate have been endorsed by accrediting and credentialing agencies, many hospitals assess both organizational measures. The purpose of this study was to determine whether safety climate and the nurse work environment make comparable or distinct contributions to patient outcomes.
2. Methods
2.1. Study Design
This study examined nurse work environment, safety climate, and patient outcomes in 600 hospitals and uses a cross-sectional secondary analysis of merged data from three sources: 1) the Multi-State Nursing Care and Patient Safety Study nurse survey; 2) adult acute care administrative discharge data from state agencies; and 3) the American Hospital Association Annual Survey of Hospitals.
The hospitals studied included almost all acute non-federal hospitals in four large states: California, Florida, Pennsylvania, and New Jersey. Hospital characteristic data used for analyses were purchased from the American Hospital Association. Surveys were sent to large random samples of nurses from state licensure lists. On the surveys, nurses reported the hospitals where they worked. Hospitals were included if they were acute care non-federal hospitals that performed at least 50 surgical procedures per year and had at least 10 staff nurse respondents. These criteria were selected to generate reliable measures from nurse survey data and a sufficient volume of surgical care consistent with prior research (Aiken et al., 2011). The average number of nurse respondents per hospital in this analysis was 37. A significant, positive correlation was found between the number of respondents per hospital and the number of full-time-equivalent registered nurses per hospital from the American Hospital Association Annual Survey of Hospitals. This correlation suggests that representative samples of nurses were obtained in the hospitals.
Patient discharge data from 2006 were obtained from the Office of Statewide Healthcare Planning and Development in California, the Department of Health and Senior Services in New Jersey, and the Pennsylvania Health Care Cost Containment Council. Data from 2007 were obtained from the Agency for Health Care Administration in Florida. Patients were included if it was their index admission, they were: between 18 and 89; had a length of stay of at least one day; and had been hospitalized for general surgery (Diagnosis Related Groups (DRGs) 146–162, 164–167, 170–171, 191–201, 257–268, 285–293, and 493–494), orthopedic surgery (DRGs 209–211, 213, 216–219, 223–230, 232–234, 471, 491, 496–503, 519–520, 537–538, and 544–546), or vascular surgery procedures (DRGs 110–111, 113–114, and 119–120). The selected DRGs represent common surgical procedures performed at most hospitals. Further, the selected DRGs allow comparability with previous studies of the nurse work environment and outcomes (Aiken et al., 2011; Aiken et al., 2008; Aiken et al., 2002).
Using state RN licensure lists and a modified Dillman method (Dillman, 2000), the Multi-State Nursing Care and Patient Safety Study survey was mailed to a large random sample of nurses in California, Pennsylvania, and New Jersey in 2006 and in Florida in 2007. The survey included items that assessed nursing work, demographics, and organization characteristics. The survey response rate was 39 percent; a survey of a random sample of non-respondents achieved a 91 percent response rate and revealed no response bias in items reported here (Smith, 2008). Both the parent study and the secondary analysis were approved by the Institutional Review Board of the University of Pennsylvania.
2.2. Theoretical Framework
For decades, Donabedian’s Structure-Process-Outcome model has been important in studying healthcare quality (Donabedian, 1966). The Quality Health Outcomes Model (Mitchell, Ferketich, and Jennings, 1998), used to guide this analysis, builds upon the work of Donabedian but posits that system and patient factors mediate the relationship between clinical interventions and patient outcomes as presented in Figure 1.
Figure 1. Theoretical Framework.
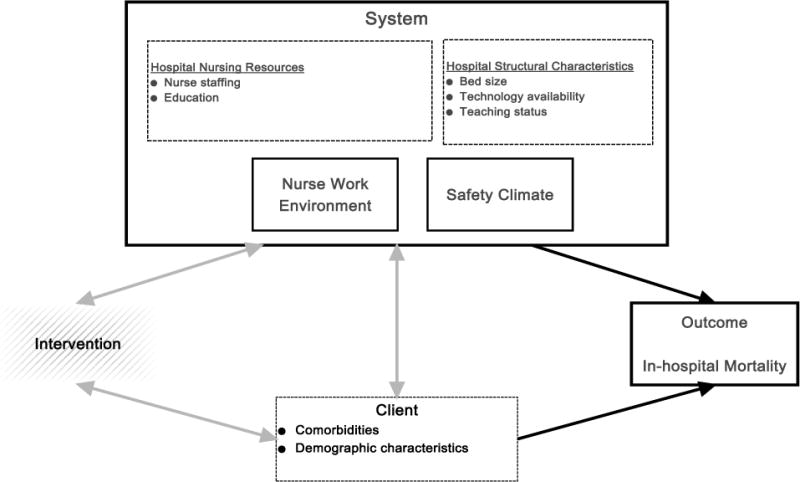
Solid outline squares = Main study variables
Dashed outline squares = Control variables
Hatched squares = Unstudied variables
Black arrows = Study relationships
Gray arrows = Unstudied relationships
2.3. Measures
2.3.1. Nurse Work Environment
The nurse work environment was assessed using the NQF endorsed PES-NWI, comprising five subscales: Nurse Participation in Hospital Affairs (9 items); Nursing Foundation for Quality of Care (10 items); Nurse Manager Ability, Leadership, and Support of Nurses (5 items); Collegial Nurse-Physician Relations (3 items); and Staffing and Resource Adequacy (4 items). Although we included a direct measure of nurse staffing in our study, the Staffing and Resource Adequacy subscale is broader than nurse staffing. It addresses nurse perceptions of enough staff to get the work done, opportunities to discuss patient care problems with other staff, adequate support services, and enough RNs to provide high quality care. The five subscales had high Cronbach’s alphas (0.85–0.88) in this sample. Subscale items were scored on a four-point Likert scale where 1=strongly disagree and 4=strongly agree. PES-NWI scores were aggregated to hospital-level mean and scores were standardized for multivariate analyses. The ICC(1,k) was 0.82, indicating nurse-level responses could be aggregated to the hospital-level.
2.3.2. Safety Climate
The Multi-State Nursing Care and Patient Safety Study survey included seven-items from the Agency for Healthcare Research and Quality’s Hospital Survey on Patient Safety Culture, a 51-item instrument (Sorra and Nieva, 2007). Given the length of the nurse survey and to minimize respondent burden, the investigators selected items to reflect a range of safety features of hospitals. These items assessed nurses’ perceptions of safety-related issues at the time of the survey and were conceptualized as safety climate for this study. The items selected from the Hospital Survey on Patient Safety Culture were: 1) staff feel like their mistakes are held against them; 2) important patient care information is often lost during shift changes; 3) things “fall through the cracks” when transferring patients from one unit to another; 4) staff feel free to question the decisions or actions of those in authority; 5) in this unit, we discuss ways to prevent errors from happening again; 6) we are given feedback about changes put into place based on event reports; and 7) the actions of hospital/organization management show that patient safety is a top priority. Item responses were based on the original five-point Likert scale where 1=strongly disagree and 5=strongly agree. For analyses, the percent positive score was calculated to facilitate comparisons with AHRQ benchmarks (Sorra et al., 2007). To calculate the percent positive score, each item’s Likert response was coded one to five from least to most desirable. The two desirable responses were coded as positive, with the neutral and two undesirable responses coded as negative. Responses were then aggregated to the hospital-level as the mean percent positive score.
The psychometric properties of the seven safety climate items were evaluated through exploratory factor analysis, reliability testing, and convergent validity assessment. Exploratory factor analysis revealed a single factor with an Eigenvalue higher than 1.0 (Eigenvalue=2.56). All seven items were included and had factor loadings between 0.54 and 0.66. The seven-item safety climate scale had a Cronbach’s alpha of 0.80; dropping any of the items would have lowered it (0.76 to 0.78). Convergent validity, using item-rest correlations, ranged from 0.45 to 0.58. Because the seven-item scale demonstrated a high Cronbach’s alpha and each item had a high item-rest correlation, it was used to assess safety climate in this study. The intra-class correlation coefficient was evaluated at the hospital level to determine if there was significant similarity of individual responses within hospitals. A coefficient of 0.60 or higher is considered satisfactory (Glick, 1985). The ICC(1,k) of the safety climate measure was satisfactory (0.69).
2.3.3 Hospital Nursing Resources and Structural Characteristics
Nurses provided details on nursing resources, including unit staffing, educational preparation, and specialty. Nursing resources were aggregated to the hospital-level because surgical patients may receive nursing care in a variety of inpatient locations. Staffing was calculated as the number of patients on a respondent’s unit divided by the total number of RNs working on the unit aggregated across respondents to a hospital-level mean. Education was calculated as the hospital-level proportion of nurses with at least a baccalaureate degree in nursing (BSN). Nurse specialty was classified as critical care, medical/surgical, or other.
The AHA Annual Survey was used to obtain data on hospital structural characteristics. Hospital bedsize was categorized as small (≤100 beds), medium (101–250 beds) or large (≥251 beds). For teaching intensity, hospitals were labeled as major teaching (at least one medical trainee per four beds), minor teaching (medical trainees present, but less than one per 4 beds), and non-teaching. Hospitals were classified as high-technology if they performed open-heart surgeries, solid organ transplantation, or both. This classification system has been used extensively in prior research on nurse work environments (Aiken et al., 2008; Kelly et al., 2011; Kutney-Lee et al., 2015; McHugh et al., 2016; Stimpfel et al., 2015).
2.3.4. Outcome Variable
Patient-level mortality was measured as in-hospital mortality. Mortality has been used in studies of the nurse work environment (Aiken et al., 2011; Cho et al., 2015; Friese, Lake, Aiken, Silber, & Sochalski, 2008; Kutney-Lee et al., 2015; Silber et al., 2016) and in studies of patient safety climate (Berry et al., 2016; Huang et al., 2010). We focused on the hospital-level as the unit of analysis because the outcome of mortality could be related to the nursing care a patient experiences in multiple units throughout a facility during a hospital stay.
2.4. Analytic Procedure
Hospital-level data from the three sources were linked using a common hospital identification number. Analyses included descriptive statistics and multivariate logistic regression models. Relationships between independent variables were assessed using bivariate correlations. At the patient- and hospital-level, missing data were found to be less than 5%. Safety climate and the work environment were standardized and modeled separately and then jointly. The variance inflation factor was computed for the major variables in the joint model.
The mortality models also contained patient risk-adjustment factors, hospital structural characteristics, and hospital nursing resources. The Elixhauser Comorbidity Index was used for risk-adjustment and included 27 individual dummy variables indicating the presence or absence of pre-existing conditions based on codes from the International Classification of Disease Version 9 (ICD-9) (Elixhauser et al., 1998). Additional covariates included surgical diagnosis, age, and sex. To account for differences in respondent work area, all models included the hospital-level proportion of nurse respondents from medical/surgical and intensive care units. The Huber-White sandwich estimator was used to account for the clustering of nurse responses within hospitals (Huber, 1967; Rogers, 1993; White, 1980). Stata 13 (StataCorp, College Station, TX) and SAS 9.4 (SAS Institute, Cary, NC) were used for data analyses.
3. Results
Data were available from 27,009 nurses working in 600 hospitals in the four states, with a mean of 36.8 nurses per hospital and a total of 852,974 patients (Table 1). Most hospitals were mid-sized and large non-teaching hospitals with low technology availability. Similar proportions of nurses had an associate degree or a bachelor’s degree (~40%) as their highest nursing degree. A third worked in adult critical care or medical/surgical units. The remainder worked on a variety of unit types. Most patients were females (57%), with a median age of 60, and hospitalized for orthopedic surgery (54%). For the outcome of in-hospital mortality, there were 10,432 deaths for a rate of 10.3 per 1,000 patients.
Table 1.
Hospital (n=600), Nurse (n=27,009), and Patient (n=852,974) Sample Characteristics
| Categories | Number (%) or Mean (SD) | |
|---|---|---|
| Hospitals by | 0–100 Beds | 71 (12%) |
| Bed Size | 101–250 Beds | 267 (44%) |
| > 250 Beds | 262 (44%) | |
|
| ||
| Hospitals by | Non-teaching | 311 (52%) |
| Teaching Status | Minor Teaching | 244 (41%) |
| Major Teaching | 45 (7%) | |
|
| ||
| Hospitals by | Low-technology | 343 (57%) |
| Technology | High-technology | 257 (43%) |
| Availability | ||
|
| ||
| Hospitals by | California | 232 (39%) |
| State | Florida | 158 (26%) |
| New Jersey | 71 (12%) | |
| Pennsylvania | 139 (23%) | |
|
| ||
| Hospital-level Percent of Nurses with BSN or Higher |
Mean: 38% (SD 14%) | |
|
| ||
| Nurses by | Diploma | 4,813 (19%) |
| Highest Degree | Associate’s Degree | 9,891 (39%) |
| Baccalaureate Degree | 10,206 (40%) | |
| Master’s Degree | 761 (3%) | |
| Doctoral Degree | 7 (0.03%) | |
|
| ||
| Nurses by State | California | 8,529 (32%) |
| Florida | 5,882 (22%) | |
| New Jersey | 5,918 (22%) | |
| Pennsylvania | 6,680 (25%) | |
|
| ||
| Nurses by | Adult Critical Care | 3,986 (17%) |
| Specialty Areas | Adult Medical/Surgical | 3,894 (16%) |
| Other | 16,074 (67%) | |
|
| ||
| Hospital-level Staffinga |
Mean: 5.3 (SD 1.4) | |
|
| ||
| Patients by Sex | Female | 485,230 (57%) |
| Male | 367,728 (43%) | |
|
| ||
| Patients’ Age | Mean: 59.1 (SD 17.5) | |
|
| ||
| Patients by State | California | 345,376 (40%) |
| Florida | 224,298 (26%) | |
| New Jersey | 91,827 (11%) | |
| Pennsylvania | 191,473 (22%) | |
|
| ||
| Patients by | General Surgery | 363,296 (43%) |
| Procedure | Orthopedic Surgery | 446,230 (52%) |
| Vascular Surgery | 43,448 (5%) | |
Note: May not total to full sample size due to missing values; may not total 100% due to rounding.
Staffing is defined as the mean number of patients per nurse.
Table 2 is a description of the hospital-level PES-NWI composite and subscales. The mean composite value was 2.68, tending toward the midpoint of 2.50, which indicates that respondents neither disagreed nor agreed that the organizational traits were present. In this sample, “Nursing Foundations for Quality of Care” had the highest mean of all the subscales (2.93). The subscale “Staffing and Resource Adequacy” had the lowest mean score (2.48). The hospital-level average percent positive safety climate scores for the composite and individual items are shown in Table 3. At the hospital-level on average, over half of the nurses gave a positive assessment of the safety climate. The most negative opinion was for the item, “Staff feel like their mistakes are held against them.” This item is an indication of a punitive response to error. The item with the most positive respondents was, “In this unit, we discuss ways to prevent errors from happening again.” The favorable rating of this item represents feedback and communication about errors. These findings together may indicate that while error prevention is discussed, staff feel blamed for mistakes.
Table 2.
Hospital-level PES-NWI Subscales
| Range | Mean (SD) | |
|---|---|---|
|
|
||
| Composite | 2.11–3.41 | 2.68 (0.23) |
| Nurse Participation in Hospital Affairs | 1.67–3.38 | 2.18–3.52 |
| Nursing Foundations for Quality of Care | 2.54 (0.29) | 2.93 (0.22) |
| Nurse Manager Ability, Leadership, and Support of Nurses | 1.71–3.54 | 2.57 (0.28) |
| Collegial Nurse-Physician Relations | 2.17–3.56 | 2.89 (0.22) |
| Staffing and Resource Adequacy | 1.60–3.57 | 2.48 (0.31) |
Note: Range is the hospital-level mean of items from the subscale. Items were scored 1, indicating the respondent “strongly disagrees” that the organizational characteristic is “present in the current job,” to 4, indicating” strongly agree.”
Table 3.
Hospital-level Safety Climate Percent Positive Responses
| Range | Mean (SD) | |
|---|---|---|
|
|
||
| Scale Composite | 26.7%–92.3% | 55.0% (8.7) |
| Staff feel like their mistakes are held against them.a | 5.0%–76.9% | 33.8% (11.7) |
| Important patient care information is often lost during shift changes.a | 10.0%–100.0% | 52.4% (11.8) |
| Things “fall between the cracks” when transferring patients from one unit to another.a | 0.0%–100.0% | 44.5% (12.4) |
| Staff feel free to question the decisions or actions of those in authority. | 8.3%–84.0% | 45.9% (13.4) |
| In this unit, we discuss ways to prevent errors from happening again. | 40.0%–100.0% | 77.1% (10.1) |
| We are given feedback about changes put into place based on event reports. | 9.1%–100.0% | 57.5% (13.7) |
| The actions of hospital/organization management show that patient safety is a top priority. | 23.1%–100.0% | 69.9% (14.6) |
Note:
indicates the item is reverse coded such that disagree and strongly disagree are positive (i.e., desirable) responses
In separate analyses, the work environment and safety climate were significantly associated with mortality (Table 4). A one-standard deviation increase in the work environment and safety climate scales had similar statistically significant effects on the odds of mortality in the individual models (Odds Ratio=0.92 for Work Environment; Odds Ratio=0.92 for Safety Climate). However, in the joint model, the work environment variable remained significant and attenuated slightly to an Odds Ratio of 0.94, while the safety climate measure lost statistical significance. Multicollinearity was tested and the variance inflation factors were 3.60 for safety climate and 3.84 for work environment, below the threshold of 10 established by Cohen, Cohen, West, and Aiken (2003, p. 423).
Table 4.
Multivariate Analyses
| eβ | SE | 95% CI | P-value | |
|---|---|---|---|---|
|
Model 1: Work Environment |
0.919 | 0.016 | 0.888, 0.950 | ˂ 0.001 |
|
Model 2: Safety Climate |
0.923 | 0.016 | 0.893, 0.956 | ˂ 0.001 |
|
Model 3 (Joint): Work Environment |
0.940 | 0.027 | 0.888, 0.996 | 0.035 |
| Safety Climate | 0.971 | 0.028 | 0.917, 1.028 | 0.316 |
Note: eβ is the odds ratio; SE is the robust standard error; 95% CI is the 95% Confidence Interval. Models included hospital bed size, technology availability, teaching status, hospital-level nurse staffing, hospital-level percentage of nurses with at least a BSN degree, percentage of respondents in medical/surgical and intensive care units, and patient pre-existing conditions, surgical DRG, age, and sex. Work Environment and Safety Climate are standardized variables.
4. Discussion
Safety climate and the work environment are organizational characteristics associated with patient mortality. In this study, we found that perceptions of safety climate did not predict patient mortality above and beyond the impact of the work environment. When modeled separately, poorer safety climate and poorer work environments were each associated with increased risk of mortality. However, when the variables were modeled together, the effect of the safety climate became nonsignificant, while that of the work environment continued to be a significant predictor of mortality.
Safety climate within the hospitals has been found in a previous study to be associated with mortality (Huang et al., 2010). This association between safety climate and mortality is thought to exist because hospitals with poor safety climate have higher rates of adverse safety events, which then result in preventable mortality (Mardon et al., 2010; Rosen et al., 2010; Singer et al., 2009; Taylor et al., 2012). However, this safety-focused concept is different from the concept of the work environment. The work environment extends beyond safety to encompass characteristics that support professional nursing practice, a conclusion reached in the Institute of Medicine’s report Keeping Patients Safe: Transforming the Work Environment of Nurses (IOM, 2004). Professional nursing practice allows nurses to provide the highest quality care to patients and is influenced by such things as nurses’ participation in hospital decisions; nursing care models and philosophies; the ability, support, and leadership of nurse managers; and the quality of relationships among nurses and physicians.
Strategies directed at changing organizational culture are thought to be the most effective and sustainable because the culture underlies and drives all the processes within an organization. Research suggests that Magnet is an intervention that improves work environments over time (Aiken et al., 2008; Kutney-Lee et al., 2015; Silber et al., 2016). It is noteworthy that Magnet recognition is rarely acknowledged as improving safety despite research findings that Magnet hospitals have better patient safety grades, scores on safety climate surveys, and characteristics, including managerial commitment to safety, error communication, and error problem solving (Hughes et al., 2012; Kelly et al., 2011; McHugh et al., 2013).
More commonly, strategies to improve safety in organizations have included team training, administrators routinely walking around to speak with frontline staff about safety, education programs, and multicomponent interventions (Morello et al., 2013; Weaver et al., 2014, 2013). These have been deployed with mixed success in terms of changing the culture, impacting processes, and improving outcomes, particularly in the long term (Armour Forse et al., 2011; Morello et al., 2013; Weaver et al., 2013). Checklists, briefings, and debriefings are also common strategies to improve safety (Haynes et al., 2011; Hill et al., 2015). While the WHO Safe Surgery Saves Lives check-list may improve overall safety climate, no significant improvements have been found for key indices, including physicians and nurses working well together, team members speaking up if there is a problem, and personnel disregarding rules for the OR (Haynes et al., 2011). Many safety-focused interventions may not bring about the extensive organizational change that comes from empowering nurses to forge a strengthened culture of patient safety. Thus, to improve patient outcomes it would be beneficial for hospitals to improve the work environment in which nurses provide care. The PES-NWI can be used as a tool to specifically target aspects of the work environment for quality improvement.
The majority of the published literature focuses on organizational interventions to influence safety climate whereas our findings suggest the nurse work environment may have a greater impact on patient outcomes. Compared to research in safety climate and culture, very few interventions directed at the nurse work environment have been developed and tested; even so, there is evidence that the process of becoming a Magnet-recognized hospital is associated with improved practice environments and patient outcomes (Aitken et al., 2011; Gardner et al., 2009; Kutney-Lee et al., 2015; Warshawsky and Havens, 2011). An important area for future research includes studies evaluating effects on patient outcomes of interventions designed to improve the nurse work environment. This is particularly true given the amount of observational research indicating the positive relationship between a better work environment and nurse and patient outcomes (Aiken et al., 2011; Aiken et al., 2008; Clarke, 2007; Estabrooks et al., 2005; Friese, 2005; Friese et al., 2008; Gunnarsdóttir et al., 2009; Kutney-Lee et al., 2009; Spence Laschinger and Leiter, 2006; Vahey et al., 2004). Our use of the Quality Health Outcomes Model did not account for all the possible factors that could impact the work environment and patient outcomes, including certification and expertise, as well as burnout and psychological safety. Techniques such as structural equation modeling could be used to more fully describe relationships among system factors, patient characteristics, nursing care interventions, and patient outcomes.
4.1 Limitations
There are several limitations to consider when interpreting these results. First, the cross-sectional design of this study limits causal inference. Second, the inability to include out-of-hospital mortality may result in a smaller number of deaths than actually occurred. Because mortality is a distal outcome, it may not be as sensitive to changes in nursing care at the bedside as some other outcome measures. In a study of seven nurse-sensitive patient outcomes, however, none were found to be significantly related to patient safety climate (Ausserhofer et al., 2013). The authors suggested that future research use 30-day mortality because of its higher reliability. Mortality does not have issues with present on admission and we were able to use a well validated risk-adjustment model (Silber et al., 2000; Silber, Rosenbaum, Schwartz, Ross, & Williams, 1995). Finally, there may be self-selection bias among those who responded to the survey and because nurses were asked about the work environment and the safety climate on the same survey, there may be some degree of same source bias.
4.2 Conclusions
More than 15 years after the Institute of Medicine’s seminal report To Err is Human (IOM, 2000), patient safety progress has lagged expectations (Makary & Daniel, 2016; Kronick, Arnold, Brady, 2016). Leaders in patient safety have pointed to hospital safety culture as a key component to address the staggering mortality and morbidity associated with adverse events and errors in healthcare (Clancy, 2009; Wachter, 2010). While both safety climate and the work environment have been associated with patient mortality, we found that when these two aspects of the organization are considered together, safety climate is no longer a significant predictor, whereas the work environment remains so. This indicates that a comprehensive approach involving improving the environment in which nurses and others work could be an important strategy for improving hospital quality and safety. This article adds to the science by extending our understanding of the role of the work environment vis-à-vis safety climate in surgical patient mortality. Our findings provide additional empirical support for the conclusion of the Institute of Medicine (IOM, 2004) that creating work environments that fully support nursing practice are critical to improving the safety and quality of patient care.
What is already known about the topic?
The nurse work environment is associated with mortality, failure to rescue, readmissions, and nurse-reported care quality, among other important outcomes.
Safety climate, i.e. the perception of the state of safety at a given point in time, has been associated with adverse events and complications, readmissions, and length of stay.
To improve patient safety and outcomes, many interventions focus on patient safety climate, with less emphasis on improving the nurse work environment.
What this paper adds.
When considered together, nurse work environment is a significant predictor of patient mortality, while safety climate is not a significant predictor.
To achieve the highest levels of safety and quality, hospitals should invest in creating an environment supportive of nurses’ work, including adequate staffing, managerial support for nurses, and good relationships among nurses and physicians.
Acknowledgments
The authors wish to thank Tim Cheney, University of Pennsylvania for his analytic support and Dr. Douglas Sloane, PhD, University of Pennsylvania and the United States Government Accountability Office, for his guidance on the study design. This study is based on work supported by the National Institute of Nursing Research, National Institutes of Health – Advanced Training in Nursing Outcomes Research (T32-NR-007104, Aiken, PI), and Outcomes of Nurse Practice Environments (R01-NR-004513, Aiken, PI).
Footnotes
Publisher's Disclaimer: This is a PDF file of an unedited manuscript that has been accepted for publication. As a service to our customers we are providing this early version of the manuscript. The manuscript will undergo copyediting, typesetting, and review of the resulting proof before it is published in its final citable form. Please note that during the production process errors may be discovered which could affect the content, and all legal disclaimers that apply to the journal pertain.
Contributor Information
Danielle M. Olds, Research Assistant Professor, University of Kansas Medical Center, School of Nursing, 3901 Rainbow Blvd. Mail Stop 4043, Kansas City, KS 66160 913 – 588 – 0426.
Linda H. Aiken, Director, Center for Health Outcomes and Policy Research, The Claire M. Fagin Leadership Professor of Nursing, Professor of Sociology. University of Pennsylvania School of Nursing, Philadelphia, PA.
Jeannie P. Cimiotti, Director, Florida Blue Center for Health Care Quality, Associate Professor and Dorothy M. Smith Endowed Chair, University of Florida, Gainesville, FL.
Eileen T. Lake, Associate Director, Center for Health Outcomes and Policy Research, Jessie M. Scott Endowed Term Associate Professor in Nursing and Health Policy, Associate Professor of Sociology, University of Pennsylvania School of Nursing, Philadelphia, PA.
References
- Aiken L, Buchan J, Ball J, Rafferty AM. Transformative impact of Magnet designation: England case study. Journal of Clinical Nursing. 2008;17:3330–3337. doi: 10.1111/j.1365-2702.2008.02640.x. [DOI] [PMC free article] [PubMed] [Google Scholar]
- Aiken LH, Cimiotti JP, Sloane DM, Smith HL, Flynn L, Neff DF. Effects of nurse staffing and nurse education on patient deaths in hospitals with different nurse work environments. Medical Care. 2011;49:1047–1053. doi: 10.1097/MLR.0b013e3182330b6e. [DOI] [PMC free article] [PubMed] [Google Scholar]
- Aiken LH, Clarke SP, Sloane DM, Lake ET, Cheney T. Effects of hospital care environment on patient mortality and nurse outcomes. Journal of Nursing Administration. 2008;38:223–229. doi: 10.1097/01.NNA.0000312773.42352.d7. [DOI] [PMC free article] [PubMed] [Google Scholar]
- Aiken LH, Clarke SP, Sloane DM, Sochalski J, Silber JH. Hospital nurse staffing and patient mortality, nurse burnout, and job dissatisfaction. JAMA. 2002;288:1987–1993. doi: 10.1001/jama.288.16.1987. [DOI] [PubMed] [Google Scholar]
- Aiken LH, Sermeus W, Van den Heede K, Sloane DM, Busse R, McKee M, Bruyneel L, Rafferty AM, Griffiths P, Moreno-Casbas MT, Tishelman C, Scott A, Brzostek T, Kinnunen J, Schwendimann R, Heinen M, Zikos D, Sjetne IS, Smith HL, Kutney-Lee A. Patient safety, satisfaction, and quality of hospital care: cross sectional surveys of nurses and patients in 12 countries in Europe and the United States. BMJ. 2012;344:e1717–e1717. doi: 10.1136/bmj.e1717. [DOI] [PMC free article] [PubMed] [Google Scholar]
- Aitken LM, Burmeister E, Clayton S, Dalais C, Gardner G. The impact of Nursing Rounds on the practice environment and nurse satisfaction in intensive care: pre-test post-test comparative study. International Journal of Nursing Studies. 2011;48:918–925. doi: 10.1016/j.ijnurstu.2010.10.004. [DOI] [PubMed] [Google Scholar]
- Aranaz-Andrés JM, Aibar-Remón C, Limón-Ramírez R, Amarilla A, Restrepo FR, Urroz O, Sarabia O, García-Corcuera LV, Terol-García E, Agra-Varela Y, Gonseth-García J, Bates DW, Larizgoitia I, IBEAS team Prevalence of adverse events in the hospitals of five Latin American countries: results of the “Iberoamerican Study of Adverse Events” (IBEAS) BMJ Quality & Safety. 2011;20:1043–1051. doi: 10.1136/bmjqs.2011.051284. [DOI] [PubMed] [Google Scholar]
- Armour Forse R, Bramble JD, McQuillan R. Team training can improve operating room performance. Surgery. 2011;150:771–778. doi: 10.1016/j.surg.2011.07.076. [DOI] [PubMed] [Google Scholar]
- Ausserhofer D, Schubert M, Desmedt M, Blegen MA, De Geest S, Schwendimann R. The association of patient safety climate and nurse-related organizational factors with selected patient outcomes: a cross-sectional survey. Int J Nurs Stud. 2013;50:240–252. doi: 10.1016/j.ijnurstu.2012.04.007. [DOI] [PubMed] [Google Scholar]
- Berry JC, Davis JT, Bartman T, Hafer CC, Lieb LM, Khan N, Brilli RJ. Improved Safety Culture and Teamwork Climate Are Associated with Decreases in Patient Harm and Hospital Mortality Across a Hospital System. Journal of Patient Safety. 2016 doi: 10.1097/PTS.0000000000000251. E-pub ahead of print. [DOI] [PubMed] [Google Scholar]
- Birkmeyer NJO, Finks JF, Greenberg CK, McVeigh A, English WJ, Carlin A, Hawasli A, Share D, Birkmeyer JD. Safety culture and complications after bariatric surgery. Annals of Surgery. 2013;257:260–265. doi: 10.1097/SLA.0b013e31826c0085. [DOI] [PubMed] [Google Scholar]
- Bonner AF, Castle NG, Men A, Handler SM. Certified nursing assistants’ perceptions of nursing home patient safety culture: is there a relationship to clinical outcomes? Journal of the American Medical Directors Association. 2009;10:11–20. doi: 10.1016/j.jamda.2008.06.004. [DOI] [PubMed] [Google Scholar]
- Carthon JMB, Lasater KB, Sloane DM, Kutney-Lee A. The quality of hospital work environments and missed nursing care is linked to heart failure readmissions: a cross-sectional study of US hospitals. BMJ Quality & Safety. 2015;24:255–263. doi: 10.1136/bmjqs-2014-003346. [DOI] [PMC free article] [PubMed] [Google Scholar]
- Cho E, Sloane DM, Kim EY, Kim S, Choi M, Yoo IY, Lee HS, Aiken LH. Effects of nurse staffing, work environments, and education on patient mortality: An observational study. Int J Nurs Stud. 2014;52(2):535–542. doi: 10.1016/j.ijnurstu.2014.08.006. [DOI] [PMC free article] [PubMed] [Google Scholar]
- Clancy CM. Ten years after To Err is Human. American Journal of Medical Quality. 2009;24:525–528. doi: 10.1177/1062860609349728. [DOI] [PubMed] [Google Scholar]
- Clarke SP. Hospital work environments, nurse characteristics, and sharps injuries. American Journal of Infection Control. 2007;35:302–309. doi: 10.1016/j.ajic.2006.07.014. [DOI] [PubMed] [Google Scholar]
- Clarke SP, Sloane DM, Aiken LH. Effects of hospital staffing and organizational climate on needlestick injuries to nurses. American Journal of Public Health. 2002;92:1115–1119. doi: 10.2105/ajph.92.7.1115. [DOI] [PMC free article] [PubMed] [Google Scholar]
- Cohen J, Cohen P, West SG, Aiken LS. Applied Multiple Regression/Correlation Analysis for the Behavioral Sciences. 3rd. Lawrence Erlbaum Associated; Mahwah, New Jersey: 2003. [Google Scholar]
- Davenport DL, Henderson WG, Mosca CL, Khuri SF, Mentzer RM., Jr Risk-adjusted morbidity in teaching hospitals correlates with reported levels of communication and collaboration on surgical teams but not with scale measures of teamwork climate, safety climate, or working conditions. Journal of the American College of Surgeons. 2007;205:778–784. doi: 10.1016/j.jamcollsurg.2007.07.039. [DOI] [PubMed] [Google Scholar]
- Dillman D. Mail and Internet Surveys: The Tailored Design Method. 2nd. Wiley; New York, New York: 2000. [Google Scholar]
- Donabedian A. Evaluating the quality of medical care. Milbank Memorial Fund Quarterly. 1966;44(Suppl):166–206. [PubMed] [Google Scholar]
- Elixhauser A, Steiner C, Harris DR, Coffey RM. Comorbidity measures for use with administrative data. Medical Care. 1998;36:8–27. doi: 10.1097/00005650-199801000-00004. [DOI] [PubMed] [Google Scholar]
- Estabrooks CA, Midodzi WK, Cummings GG, Ricker KL, Giovannetti P. The impact of hospital nursing characteristics on 30-day mortality. Nursing Research. 2005;54:74–84. doi: 10.1097/00006199-200503000-00002. [DOI] [PubMed] [Google Scholar]
- Friese CR. Nurse practice environments and outcomes: implications for oncology nursing. Oncology Nursing Forum. 2005;32:765–772. doi: 10.1188/05.ONF.765-772. [DOI] [PubMed] [Google Scholar]
- Friese CR, Lake ET, Aiken LH, Silber JH, Sochalski J. Hospital nurse practice environments and outcomes for surgical oncology patients. Health Services Research. 2008;43:1145–1163. doi: 10.1111/j.1475-6773.2007.00825.x. [DOI] [PMC free article] [PubMed] [Google Scholar]
- Gardner G, Woollett K, Daly N, Richardson B. Measuring the effect of patient comfort rounds on practice environment and patient satisfaction: a pilot study. International Journal of Nursing Practice. 2009;15:287–293. doi: 10.1111/j.1440-172X.2009.01753.x. [DOI] [PubMed] [Google Scholar]
- Glick WH. Conceptualizing and measuring organizational and psychological climate: pitfalls in multilevel research. Academy of Management Review. 1985;10:601–616. [Google Scholar]
- Ginsburg L, Gilin D, Tregunno D, Norton PG, Flemons W, Fleming M. Advancing measurement of patient safety culture. Health Services Research. 2009;44:205–224. doi: 10.1111/j.1475-6773.2008.00908.x. [DOI] [PMC free article] [PubMed] [Google Scholar]
- Gunnarsdóttir S, Clarke SP, Rafferty AM, Nutbeam D. Front-line management, staffing and nurse-doctor relationships as predictors of nurse and patient outcomes. A survey of Icelandic hospital nurses. International Journal of Nursing Studies. 2009;46:920–927. doi: 10.1016/j.ijnurstu.2006.11.007. [DOI] [PubMed] [Google Scholar]
- Hansen LO, Williams MV, Singer SJ. Perceptions of hospital safety climate and incidence of readmission. Health Services Research. 2011;46:596–616. doi: 10.1111/j.1475-6773.2010.01204.x. [DOI] [PMC free article] [PubMed] [Google Scholar]
- Haynes AB, Weiser TG, Berry WR, Lipsitz SR, Breizat AHS, Dellinger EP, Dziekan G, Herbosa T, Kibatala PL, Lapitan MCM, Merry AF, Reznick RK, Taylor B, Vats A, Gawande AA, Safe Surgery Saves Lives Study Group Changes in safety attitude and relationship to decreased postoperative morbidity and mortality following implementation of a checklist-based surgical safety intervention. BMJ Quality & Safety. 2011;20:102–107. doi: 10.1136/bmjqs.2009.040022. [DOI] [PubMed] [Google Scholar]
- Hill MR, Roberts MJ, Alderson ML, Gale TCE. Safety culture and the 5 steps to safer surgery: an intervention study. British Journal of Anaesthesia. 2015;114:958–962. doi: 10.1093/bja/aev063. [DOI] [PubMed] [Google Scholar]
- Hogan H, Zipfel R, Neuburger J, Hutchings A, Darzi A, Black N. Avoidability of hospital deaths and association with hospital-wide mortality ratios: retrospective case record review and regression analysis. BMJ. 2015;351:h3239. doi: 10.1136/bmj.h3239. [DOI] [PMC free article] [PubMed] [Google Scholar]
- Huang DT, Clermont G, Kong L, Weissfeld LA, Sexton JB, Rowan KM, Angus DC. Intensive care unit safety culture and outcomes: a US multicenter study. International Journal of Quality in Health Care. 2010;22:151–161. doi: 10.1093/intqhc/mzq017. [DOI] [PMC free article] [PubMed] [Google Scholar]
- Huber PJ. Proceedings of the Fifth Berkeley Symposium on Mathematical Statistics and Probability. University of California Press; 1967. The behavior of maximum likelihood estimates under nonstandard conditions; pp. 221–233. [Google Scholar]
- Hughes LC, Chang Y, Mark BA. Quality and strength of patient safety climate on medical-surgical units. Journal of Nursing Administration. 2012;42:S27–36. doi: 10.1097/01.NNA.0000420392.33531.61. [DOI] [PubMed] [Google Scholar]
- Kohn LT, Corrigan J, Donaldson MS, editors. IOM. To Err is Human: Building a Safer Health System. National Academy Press; Washington, D.C.: 2000. [PubMed] [Google Scholar]
- Page A, editor. IOM. Keeping Patients Safe: Transforming the Work Environment of Nurses. National Academies Press; Washington, D.C.: 2003. [PubMed] [Google Scholar]
- James JT. A new, evidence-based estimate of patient harms associated with hospital care. Journal of Patient Safety. 2013;9:122–128. doi: 10.1097/PTS.0b013e3182948a69. [DOI] [PubMed] [Google Scholar]
- Jha AK, Larizgoitia I, Audera-Lopez C, Prasopa-Plaizier N, Waters H, Bates DW. The global burden of unsafe medical care: analytic modelling of observational studies. BMJ Quality & Safety. 2013;22:809–815. doi: 10.1136/bmjqs-2012-001748. [DOI] [PubMed] [Google Scholar]
- Kelly DM, Kutney-Lee A, McHugh MD, Sloane DM, Aiken LH. Impact of critical care nursing on 30-day mortality of mechanically ventilated older adults. Critical Care Medicine. 2014;42:1089–1095. doi: 10.1097/CCM.0000000000000127. [DOI] [PMC free article] [PubMed] [Google Scholar]
- Kelly LA, McHugh MD, Aiken LH. Nurse outcomes in Magnet® and non-magnet hospitals. Journal of Nursing Administration. 2011;41:428–433. doi: 10.1097/NNA.0b013e31822eddbc. [DOI] [PMC free article] [PubMed] [Google Scholar]
- Kirwan M, Matthews A, Scott PA. The impact of the work environment of nurses on patient safety outcomes: a multi-level modelling approach. International Journal of Nursing Studies. 2013;50:253–263. doi: 10.1016/j.ijnurstu.2012.08.020. [DOI] [PubMed] [Google Scholar]
- Kline TJB, Willness C, Ghali WA. Determinants of adverse events in hospitals–the potential role of patient safety culture. Journal of Healthcare Quality. 2008;30:11–17. doi: 10.1111/j.1945-1474.2008.tb01122.x. [DOI] [PubMed] [Google Scholar]
- Kutney-Lee A, McHugh M, Sloane D, Cimiotti J, Flynn L, Neff D, Aiken L. Nursing: a key to patient satisfaction. Health Affairs (Millwood) 2009;28:w669–77. doi: 10.1377/hlthaff.28.4.w669. [DOI] [PMC free article] [PubMed] [Google Scholar]
- Kutney-Lee A, Stimpfel AW, Sloane DM, Cimiotti JP, Quinn LW, Aiken LH. Changes in patient and nurse outcomes associated with magnet hospital recognition. Medical Care. 2015;53:550–557. doi: 10.1097/MLR.0000000000000355. [DOI] [PMC free article] [PubMed] [Google Scholar]
- Lake ET. Development of the practice environment scale of the Nursing Work Index. Research in Nursing and Health. 2002;25:176–188. doi: 10.1002/nur.10032. [DOI] [PubMed] [Google Scholar]
- Lake ET, Hallowell SG, Kutney-Lee A, Hatfield LA, Del Guidice M, Boxer BA, Ellis LN, Verica L, Aiken LH. Higher quality of care and patient safety associated with better NICU work environments. Journal of Nursing Care Quality. 2016;31:24–32. doi: 10.1097/NCQ.0000000000000146. [DOI] [PMC free article] [PubMed] [Google Scholar]
- Lasater KB, Mchugh MD. Nurse staffing and the work environment linked to readmissions among older adults following elective total hip and knee replacement. International Journal of Quality in Health Care. 2016;28:253–258. doi: 10.1093/intqhc/mzw007. [DOI] [PMC free article] [PubMed] [Google Scholar]
- Ma C, McHugh MD, Aiken LH. Organization of Hospital Nursing and 30-Day Readmissions in Medicare Patients Undergoing Surgery. Medical Care. 2015a;53:65–70. doi: 10.1097/MLR.0000000000000258. [DOI] [PMC free article] [PubMed] [Google Scholar]
- Ma C, Olds DM, Dunton NE. Nurse work environment and quality of care by unit types: A cross-sectional study. International Journal of Nursing Studies. 2015b;52:1565–1572. doi: 10.1016/j.ijnurstu.2015.05.011. [DOI] [PubMed] [Google Scholar]
- Magnet: Empowering nurses. Briefings on Patient Safety. 2005;4:8–9. [Google Scholar]
- Makary MA, Daniel M. Medical error-the third leading cause of death in the US. BMJ Clinical Research Edition. 2016;353:i2139. doi: 10.1136/bmj.i2139. [DOI] [PubMed] [Google Scholar]
- Mardon RE, Khanna K, Sorra J, Dyer N, Famolaro T. Exploring relationships between hospital patient safety culture and adverse events. Journal of Patient Safety. 2010;6:226–232. doi: 10.1097/PTS.0b013e3181fd1a00. [DOI] [PubMed] [Google Scholar]
- McHugh MD, Aiken LH, Eckenhoff ME, Burns LR. Achieving Kaiser Permanente quality. Health Care Management Review. 2016;41:178–188. doi: 10.1097/HMR.0000000000000070. [DOI] [PMC free article] [PubMed] [Google Scholar]
- McHugh MD, Kelly LA, Smith HL, Wu ES, Vanak JM, Aiken LH. Lower mortality in Magnet hospitals. Medical Care. 2013;51:382–388. doi: 10.1097/MLR.0b013e3182726cc5. [DOI] [PMC free article] [PubMed] [Google Scholar]
- Mitchell PH, Ferketich S, Jennings BM. Quality health outcomes model. American Academy of Nursing Expert Panel on Quality Health Care. Image—Journal of Nursing Scholarship. 1998;30:43–46. doi: 10.1111/j.1547-5069.1998.tb01234.x. [DOI] [PubMed] [Google Scholar]
- Morello RT, Lowthian JA, Barker AL, McGinnes R, Dunt D, Brand C. Strategies for improving patient safety culture in hospitals: a systematic review. BMJ Quality & Safety. 2013;22:11–18. doi: 10.1136/bmjqs-2011-000582. [DOI] [PubMed] [Google Scholar]
- National Quality Forum. Practice Environment Scale – Nursing Work Index PES-NWI Composite and Five Subscales. 2015 Available at: http://www.qualityforum.org/QPS/0206 (accessed 8.10.16)
- Pronovost P, Holzmueller CG, Needham DM, Sexton JB, Miller M, Berenholtz S, Wu AW, Perl TM, Davis R, Baker D, Winner L, Morlock L. How will we know patients are safer? An organization-wide approach to measuring and improving safety. Critical Care Medicine. 2006;34:1988–1995. doi: 10.1097/01.CCM.0000226412.12612.B6. [DOI] [PubMed] [Google Scholar]
- Rogers WH. Regression standard errors in clustered samples. Stata Technical Bulletin. 1993;13:19–23. [Google Scholar]
- Silber JH, Rosenbaum PR, McHugh MD, Ludwig JM, Smith HL, Niknam BA, Aiken LH. Comparison of the value of nursing work environments in hospitals across different levels of patient risk. JAMA Surgery. 2016;151(6):527–536. doi: 10.1001/jamasurg.2015.4908. [DOI] [PMC free article] [PubMed] [Google Scholar]
- Singer S, Lin S, Falwell A, Gaba D, Baker L. Relationship of safety climate and safety performance in hospitals. Health Services Research. 2009;44:399–421. doi: 10.1111/j.1475-6773.2008.00918.x. [DOI] [PMC free article] [PubMed] [Google Scholar]
- Smith H. (PSC Working Paper Series).Double sample to minimize bias due to non-response in a mail survey. 2009 Available at: http://repository.upenn.edu/psc_working_papers/20.
- Sorra J, Nieva V. AHRQ Publication No. 04-0041. Agency for Healthcare Research and Quality; Rockville, MD: 2007. Hospital Survey on Patient Safety Culture (Prepared by Westat, Rockville, MD, under contract No. 290-96-0004) [Google Scholar]
- Sorra J, Nieva V, Famolaro T, Dyer N. AHRQ Publication No. (No. AHRQ Publication No. 07-0025) Agency for Healthcare Research and Quality; Rockville, MD: 2007. Hospital Survey on Patient Safety Culture: 2007 Comparative Database Report. (Prepared by Westat, Rockville, MD, under contract No. 233-02-0087, Task Order no. 18) [Google Scholar]
- Spence Laschinger HK, Leiter MP. The impact of nursing work environments on patient safety outcomes: the mediating role of burnout/engagement. Journal of Nursing Administration. 2006;36:259–267. doi: 10.1097/00005110-200605000-00019. [DOI] [PubMed] [Google Scholar]
- Stimpfel AW, Rosen JE, McHugh MD. Understanding the Role of the Professional Practice Environment on Quality of Care in Magnet® and Non-Magnet Hospitals. Journal of Nursing Administration. 2015;45:S52–58. doi: 10.1097/NNA.0000000000000253. [DOI] [PMC free article] [PubMed] [Google Scholar]
- Taylor JA, Dominici F, Agnew J, Gerwin D, Morlock L, Miller MR. Do nurse and patient injuries share common antecedents? An analysis of associations with safety climate and working conditions. BMJ Quality & Safety. 2012;21:101–111. doi: 10.1136/bmjqs-2011-000082. [DOI] [PubMed] [Google Scholar]
- Vahey DC, Aiken LH, Sloane DM, Clarke SP, Vargas D. Nurse burnout and patient satisfaction. Medical Care. 2004;42:II57–66. doi: 10.1097/01.mlr.0000109126.50398.5a. [DOI] [PMC free article] [PubMed] [Google Scholar]
- Wachter RM. Patient safety at ten: unmistakable progress, troubling gaps. Health Affairs Project Hope. 2010;29:165–173. doi: 10.1377/hlthaff.2009.0785. [DOI] [PubMed] [Google Scholar]
- Warshawsky NE, Havens DS. Global use of the Practice Environment Scale of the Nursing Work Index. Nursing Research. 2011;60:17–31. doi: 10.1097/NNR.0b013e3181ffa79c. [DOI] [PMC free article] [PubMed] [Google Scholar]
- Weaver SJ, Lubomksi LH, Wilson RF, Pfoh ER, Martinez KA, Dy SM. Promoting a culture of safety as a patient safety strategy: a systematic review. Annals of Internal Medicine. 2013;158:369–374. doi: 10.7326/0003-4819-158-5-201303051-00002. [DOI] [PMC free article] [PubMed] [Google Scholar]
- Weaver SJ, Weeks K, Pham JC, Pronovost PJ. On the CUSP: Stop BSI: evaluating the relationship between central line-associated bloodstream infection rate and patient safety climate profile. American Journal of Infection Control. 2014;42:S203–208. doi: 10.1016/j.ajic.2014.05.020. [DOI] [PMC free article] [PubMed] [Google Scholar]
- Weingart SN, Farbstein K, Davis RB, Phillips RS. Using a multihospital survey to examine the safety culture. Joint Commission Journal of Quality and Safety. 2004;30:125–132. doi: 10.1016/s1549-3741(04)30014-6. [DOI] [PubMed] [Google Scholar]
- White H. A heteroskedasticity-consistent covariance matrix estimator and a direct test for heteroskedasticity. Econometrica: Journal of the Econometric Society. 1980;48:817. [Google Scholar]
- Zhang H, Wiegmann DA, von Thaden TL, Sharma G, Mitchell AA. Safety culture: a concept in chaos? Proceedings of the Human Factors and Ergonomics Society Annual Meeting. 2002;46:1404–1408. [Google Scholar]