

Summary
Glucagon is secreted from pancreatic α cells, and hypersecretion (hyperglucagonemia) contributes to diabetic hyperglycemia. Molecular heterogeneity in hyperglucagonemia is poorly investigated. By screening human plasma using high-resolution-proteomics, we identified several glucagon variants, among which proglucagon 1-61 (PG 1-61) appears to be the most abundant form. PG 1-61 is secreted in subjects with obesity, both before and after gastric bypass surgery, with protein and fat as the main drivers for secretion before surgery, but glucose after. Studies in hepatocytes and in β cells demonstrated that PG 1-61 dose-dependently increases levels of cAMP, through the glucagon receptor, and increases insulin secretion and protein levels of enzymes regulating glycogenolysis and gluconeogenesis. In rats, PG 1-61 increases blood glucose and plasma insulin and decreases plasma levels of amino acids in vivo. We conclude that glucagon variants, such as PG 1-61, may contribute to glucose regulation by stimulating hepatic glucose production and insulin secretion.
Keywords: glucagon, GLP-1, alpha cells, diabetes, proglucagon, L-cells, proteomics
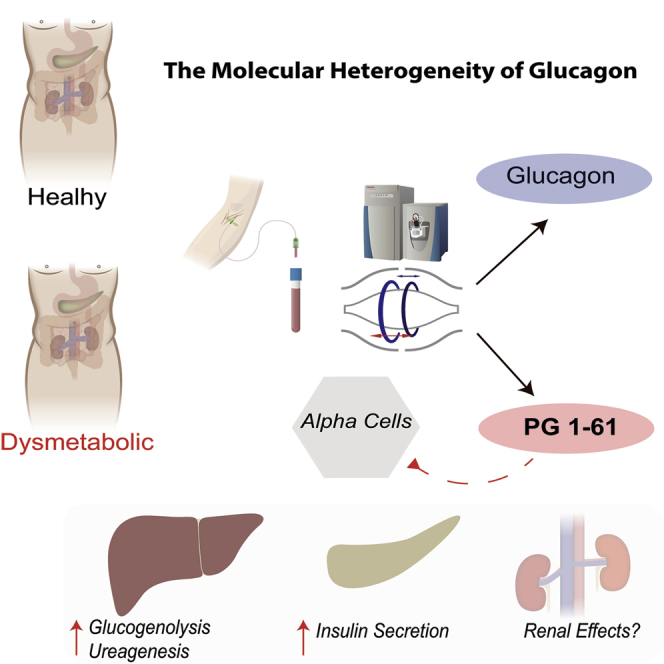
Graphical Abstract
Highlights
-
•
PG 1-61 is a glucagon-like peptide in humans
-
•
Hyperglucagonemia may include PG 1-61, as well as glucagon
-
•
PG 1-61 stimulates insulin secretion and activates human hepatocytes
-
•
PG 1-61 may be a surrogate marker of alpha cell dysfunction
Wewer Albrechtsen et al. identify a glucagon-like molecule, PG 1-61, in humans using mass-spectrometry-based proteomics. PG 1-61 activates the glucagon receptor, stimulates insulin secretion, and activates key gluconeogenic enzymes. In dysmetabolic conditions, PG 1-61 is upregulated and may therefore serve as a marker of alpha cell stress.
Introduction
Glucagon is a peptide hormone secreted from pancreatic α cells in response to hypoglycemia and hyperaminoacidemia (Gromada et al., 2007). Hypersecretion of glucagon (hyperglucagonemia) is an important element of the pathophysiology of diabetes and contributes to its pathogenesis (Unger and Cherrington, 2012).
The glucagon gene (GCG), which encodes the precursor molecule of glucagon, proglucagon (PG), is expressed in pancreatic α cells, in enteroendocrine L cells and in the brain stem (Vrang and Larsen, 2010). The processing of PG is strictly regulated by the differential expression of the two prohormone convertases, 2 (PC2) and 1/3 (PC1), which, in α cells, gives rise to glucagon (because of PC2 activity), while in the L cells, which express PC1, a number of “glucagon-like” hormones, including the incretin hormone glucagon-like peptide-1 (GLP-1) are formed (Figure 1A). Heterogeneity of the products of PG (in particular, PC2-dependent processing) has previously been reported in patients with glucagon-producing tumors (Holst, 1983) (glucagonoma) and in uremic pigs (Baldissera and Holst, 1986). However, the extent to which molecular heterogeneity is normally seen and whether it is involved in diabetes and/or other metabolically related diseases are unknown (Unger and Cherrington, 2012).
Figure 1.

PG 1-61, a Glucagon Variant, Identified in Human Plasma by Mass Spectrometry
(A) Overview of the processing of proglucagon (1-160). In the pancreas, proglucagon is processed by prohormone convertase 2 (PC2), resulting in the formation of glicentin-related pancreatic polypeptide (GRPP), glucagon, and the major proglucagon fragment. In the intestine, the actions of prohormone convertase 1/3 (PC1/3) lead to the formation of glicentin, glucagon-like peptide 1 (GLP-1), and glucagon-like peptide 2 (GLP-2). Below, potential (denoted as X and Y) N-terminally elongated and C-terminally truncated forms of glucagon are depicted.
(B) A mass-spectrometry-based platform for identification of low-abundant peptides such as glucagon. In short, blood is taken from a subject, and the plasma is subjected to ultra-pressure liquid chromatography (UPLC), and the peptides are sprayed into an Orbitrap-based mass spectrometer, using an electrospray technique (ESI). The identified spectra are deconvoluted into amino acid sequences using the MaxQuant software package.
(C) Separate plasma pools, obtained from subjects with kidney failure (n = 8) and from healthy subjects (n = 8), were subjected to the platform shown in (B), and the corresponding amino acid intensities are depicted as red (kidney failure) and green (healthy subjects). Synthesized PG 1-61 (positive control) is depicted in blue.
(D) By comparing plasma levels of immunoreactive total glucagon (i.e., PG 1-61 + PG 33-61 [glucagon]), using a C-terminal assay (blue), to plasma levels of PG 1-61 (black) and glucagon 33-61 (red) using two sandwich ELISAs, we were able to verify immunoreactive PG 1-61 in plasma in response to an oral glucose load (E) in the same kidney failure individuals used in our mass-spectrometry-based platform (C).
(F) Size-exclusion chromatography identified two major immunoreactive glucagon-like moieties using the C-terminal assay (blue): one identified having similar coefficient of distribution (Kd) as recombinant PG 1-61 (Kd = 0.22) (only immunoreactive peak identified using the PG 1-61 assay, black curve) and one similar to pancreatic glucagon (33-61) (Kd = 0.8).
In the present study, we investigated the molecular heterogeneity of PG products in conditions known to be associated with hyperglucagonemia, such as post gastric bypass, type 2 diabetes, and renal failure. An N-terminally elongated glucagon molecule, PG 1-61, was identified using a mass spectrometry-based proteomic platform. Furthermore, using an array of in vitro and in vivo studies, we demonstrate that PG 1-61 possesses gluco-regulatory effects through activation of the glucagon receptor expressed in pancreatic β cells and hepatocytes.
Results
PG 1-61 Identified in Human Plasma by Mass Spectrometry, Immunoassays, and Size-Exclusion Chromatography
We identified an N-terminally elongated glucagon molecule using a validated and unbiased mass-spectrometry-based platform (Figures 1B and 1C), corresponding to the amino acid sequence of PG 1-61 (RSLQDTEEKSRSFSASQADPLSDPDQMNEDKRHSQGTFTSDYSKYLDSRRAQDFVQWLMNT), in plasma from patients with hyperglucagonemia due to kidney failure (end-stage renal disease [ESRD]) but not in plasma from healthy controls. Furthermore, we identified several other N-terminally elongated glucagon variants, but their abundancies were much less (10-fold) compared to those of PG 1-61 (Figure S1).
The structure of the N-terminally elongated glucagon variant was consistent with its reactions toward two sandwich ELISAs: lack of reactivity in an assay specific for fully processed glucagon and full reactivity in an assay designed for reaction with PG 1-61, as well as in a validated C-terminal-specific glucagon radioimmunoassay (Figure 1D). Secretory profiles of glucagon-like immunoreactivity assessed by a C-terminal assay were almost superimposable to a profile calculated as the sum of fully processed glucagon and PG 1-61 concentrations (Figure 1E) (AUC0-180min for the C-terminal assay = 4,021 ± 195 min × pM, compared to AUC0-180min for the two sandwich ELISAs: 4,102 ± 219 min × pM, p = 0.74). Finally, size-exclusion chromatography of pooled plasma, from the same kidney failure patients as described above, with concomitant measurements with a C-terminal glucagon assay and a PG 1-61 specific assay, identified a peak (Kd = 0.28) corresponding to that of exogenous PG 1-61 (Figure 1F), thereby independently verifying the results obtained using the mass-spectrometry-based platform.
PG 1-61 Is Secreted in Several Clinical Conditions Associated with Hyperglucagonemia
Thirteen out of 14 patients with renal dysfunction had measurable plasma levels of PG 1-61, which dropped significantly (p < 0.001) 3 months after renal transplantation (in parallel with normalization of the kidney function), and remained stable at a 12-month follow-up (Figure 2A). There were no differences in plasma levels of PG 1-61 in kidney failure patients with diabetes compared to those with normal glucose tolerance (7 in total). To investigate whether immunoreactive PG 1-61 is only found in subjects with insufficient renal plasma clearance (end-stage renal disease), we analyzed plasma from subjects with other pathologies associated with hyperglucagonemia, namely, type 2 diabetes and morbid obesity.
Figure 2.

PG 1-61 Responses in Subjects with a Variety of Clinical Conditions Characterized with Hyperglucagonemia
(A) Plasma levels of PG 1-61 during an oral glucose tolerance test (0-min time point was analyzed and is shown) in subjects with kidney failure (end-stage renal disease) before, 3 months, and 12 months after renal transplantation.
(B) PG 1-61 responses during a meal stimulation test (black) and an oral glucose tolerance test (OGTT) (red) in subjects with type 2 diabetes (T2D).
(C) PG 1-61 responses during an oral glucose load (red), fat ingestion (blue), or protein ingestion (black) in obese subjects.
(D) PG 1-61 (red) and glucagon (black) responses during an L-arginine test in healthy subjects (circles) or in gastric-bypass-operated subjects (squares) (Roux-en-Y gastric bypass).
(E) PG 1-61 responses during an oral glucose tolerance test (red), fat ingestion (blue), or protein ingestion (black) in gastric-bypass-operated subjects (Roux-en-Y gastric bypass).
(F) PG 1-61 responses during an oral glucose tolerance test in fully pancreatectomized subjects (PX). n = 8–12.
No detectable PG 1-61 was found in plasma from patients with type 2 diabetes during an oral glucose tolerance test (OGTT) (concentrations remained around the detection limit of the sandwich ELISA ∼1 pM) (Figure 2B), whereas measurable levels were found during a meal stimulation test (nAUC0-240min, OGTT 182 ± 90 min × pM, compared to meal AUC0–240min. meal stimulation 1,430 ± 284 min × pM, respectively, p < 0.01). In obese subjects, protein and fat ingestion increased plasma levels of PG 1-61 (Figure 2C). In contrast, glucose ingestion was not associated with any rise in PG 1-61 levels, and, if anything, there was a trend for levels to be reduced. Extracts of gut biopsies (mucosa) from obese subjects did not contain immunoreactive PG 1-61 (<1 pmol/g) but had high levels of other peptides derived from intestinal processing of proglucagon (GLP-1, 58 ± 12 pmol/g; glicentin, 102 ± 23 pmol/g; oxyntomodulin, 32 ± 6 pmol/g), all three derived from the proglucagon-expressing L cells. Furthermore, extracts from three human healthy pancreases showed detectable levels of PG 1-61 (above limits of detection), although compared to glucagon this was rather low (PG 1-61: 2 pmol/g, glucagon 29 pmol/mg). Collectively, suggesting that PG 1-61 in some conditions may be derived from pancreatic α cells and co-secreted with pancreatic glucagon.
In both Roux-en-Y gastric bypass (RYGB)-operated and BMI-matched obese individuals, i.v. administration of L-arginine (an α cell secretagogue) robustly stimulated glucagon secretion (Figure 2D). PG 1-61 levels were also increased in the obese controls, albeit to a much lower extent than glucagon, but remained undetectable in the gastric bypass subjects (Figure 2D). Furthermore, glucose, but not fat and protein, elicited a secretory PG 1-61 response in gastric bypass individuals (Figure 2E). In pancreatectomized patients, where the surgery results in similar anatomical rearrangement of the gastrointestinal tract as after Roux-en-Y gastric bypass surgery, an oral glucose load led to modest increases in PG 1-61 plasma levels (Figure 2F).
PG 1-61 Activates the Glucagon Receptor, Stimulates Insulin Secretion in β Cells, and Increases Blood Glucose in Rats
In transiently transfected COS-7 cells, synthetic PG 1-61 (synthesized according to the sequence identified in humans) activated the human glucagon receptor (hGCGR) as a full agonist with a 100-fold decreased potency compared to native glucagon (LogEC50, PG 1-61 = −8.0 ± 0.22 compared to LogEC50, glucagon = −10.0 ± 0.17) (Figure 3A). In contrast, it acted with very low potency on cells expressing hGLP-1R and only reached 38% of Emax of GLP-1 at a concentration of 1 μM, whereas glucagon acted as a partial agonist with 100-fold lower potency and an Emax of 78% compared to native GLP-1 (LogEC50, PG 1-61 < −6, compared to LogEC50, glucagon = −8.2 ± 0.08 and LogEC50, GLP-1 = −10.2 ± 0.11) (Figure 3B).
Figure 3.

PG 1-61 Activates GCGR and Regulates Blood Glucose by Stimulating Insulin Secretion from Cultured β Cells and Isolated Pancreases
(A and B) PG 1-61 activated the human glucagon receptor (hGCGR) (A) but not the human glucagon-like peptide 1 receptor (hGLP-1R) (B) with same efficacy but with lower potency compared to native glucagon in transiently transfected COS-7 cells expressing hGCGR (A) and hGLP-1R (B).
(C) PG 1-61 dose-dependently stimulated levels of cAMP in INS1 cells. Positive control (PC), consisting of Bombesin, Forskolin, and IBMX, is shown.
(D) PG 1-61 (1 nM) stimulated the secretion of insulin in INS1 cells; thus, this could be significantly reduced by small interfering RNA of the glucagon receptor (red), compared to small interfering RNA control (black). PBS was used as negative control, L-arginine was used as a positive control, and glucagon was used as comparator to the effects of PG 1-61.
(E) Perfusions of isolated rat pancreases (n = 6) with PG 1-61 (1 nM), glucagon (1 nM), and L-arginine as positive control. PG 1-61 significantly (∗∗∗p < 0.001) increased insulin secretion. n = 6–8.
PG 1-61 dose-dependently increased accumulation of cAMP in cultured rat β cells (INS1) (Figure 3C) and significantly stimulated insulin release compared to PBS administration alone (Figure 3D, p < 0.001). The effect was comparable to that of native glucagon. In INS1 cells with small interfering RNA (siRNA)-induced knockdown of the rat glucagon receptor (rGCGR) knockdown estimated to ∼70% by qPCR, data not shown), PG 1-61-induced insulin secretion was significantly blunted compared to small interfering RNA mock-treated cells (Figure 3D, p < 0.01). Perfusion of isolated rat pancreases with PG 1-61 (1 nM) resulted in significant increases in insulin secretion compared to baseline (tAUC1-61: 3,534 ± 321 min × pM versus tAUCbaseline: 2,073 ± 521 min × pM, p < 0.001) (Figure 3E).
i.v. administration of PG 1-61 (1 nM) in rats resulted in a rapid and robust increase in blood glucose compared to mannitol-treated rats (iAUC0–20min: 41 ± 9 min × mM versus 11 ± 10 min × mM, p < 0.001) (Figure 4A). Plasma insulin increased transiently in response to both PG 1-61 and glucagon administration, but not mannitol (Figure 4B), and the summed molarity of amino acids (total plasma levels of amino acids) decreased (Figure 4C). PG 1-61 inhibited the secretion of pancreatic glucagon measured using a highly specific sandwich ELISA (Figure 4D) (which does not react with PG 1-61, unlike “traditional” (C-terminally directed) glucagon assays). Analysis of plasma using the two specific sandwich ELISAs for PG 1-61 and pancreatic glucagon, respectively, confirmed their specificity (i.e., no measureable PG1-61 in rats receiving exogenous glucagon and vice versa [Figures 4E and 4F]). Moreover, the observation that immunoreactive glucagon was not detected in the PG 1-61-treated rats indicates that PG 1-61 is not cleaved in the plasma to form glucagon. Administration of PG 1-61 to diabetic animal models did, however, not seem to inhibit the secretion of glucagon (Figure S2).
Figure 4.

PG 1-61 Regulates Blood Glucose in Rats by Stimulating Insulin Secretion
Intravenous injection with mannitol (1 g/kg, gray), PG 1-61 (1 pmol, red), or glucagon (1 pmol, black) in rats. Mannitol was used as a control for volume and osmolarity. Plasma samples were obtained subsequently during a 20-min period.
(A and B) Both blood glucose (A) and plasma insulin levels (B) increased significantly after the injection of PG 1-61 and glucagon, respectively.
(C) Plasma amino acids decreased significantly after the injection of PG 1-61 and glucagon.
(D) Plasma glucagon levels decreased significantly after injection of PG 1-61 (red) but not mannitol (gray).
(E and F) Plasma levels of PG 1-61 (E) in PG 1-61, glucagon, and mannitol-treated rats are shown, and plasma levels of glucagon (F) in PG 1-61, glucagon, and mannitol-treated rats are shown. n = 4–8.
PG 1-61 Increases cAMP Levels in Primary Human Hepatocytes and Increases the Expression of Enzymes Related to Gluconeogenesis in the HEP1 Cell Line in a Glucagon Receptor-Dependent Manner
PG 1-61 dose-dependently increased intracellular levels of cAMP in primary human hepatocytes (HMCS10) (Figure 5A) and in cultured human hepatocytes (HepG2) (Figure 5B). Small interfering RNA knockdown of hGCGR (knockdown estimated to ∼75% by qPCR, Figure S3) attenuated both PG 1-61 and glucagon-stimulated increases in cAMP compared to small interfering RNA-treated controls in cultured hepatocytes (Figure 5B). 30-min incubation with PG 1-61 significantly increased protein levels of the enzymes protein kinase A (PKA), glucose-6-phosphatase (G6P), phosphorylase kinase (PKC-1), glycogen phosphorylase (GP), and phosphoenolpyruvate carboxykinase (PECK), essential for the regulation of gluconeogenesis and glycogenolysis (Figure 5C). In small interfering RNA-treated cells, the protein levels of these enzymes tended to be lower. Incubation for 3 hr with PG 1-61 showed more pronounced effects on the protein levels of protein kinase A, G6P, PKC-1, GP, and PECK (Figure 5D). Corresponding western blots are shown in Figures S3, S4, and S5.
Figure 5.

PG 1-61 Stimulates cAMP Production in Primary and Cultured Human Hepatocytes and Increases Protein Content of Enzymes Related to Gluconeogenesis and Glycogenolysis
(A) PG 1-61 stimulated cAMP production dose-dependently (10–1,000 pM) in primary human hepatocytes. As negative control (NC), we used PBS, and, as positive control (GCG), we used 100 pM glucagon.
(B) PG 1-61 stimulated cAMP production dose-dependently (10–1,000 pM) in cultured human hepatocytes (HepG2). Small interfering RNA mock and small interfering RNA glucagon receptor (siRNA GCGR)-mediated knockdown are shown. As negative control (NC), we used PBS, and, as positive control (GCG), we used 100 pM glucagon.
(C) PG1-61 (red, 1,000 pM) increased protein levels (30 min of incubation) of glucose-6-phosphatase (G6P), phosphorylase kinase (PKC-1), glycogen phosphorylase (GP), and phosphoenolpyruvate carboxykinase (PECK). Administration of glucagon (1,000 pM) is shown in black.
(D) PG1-61 (red) increased protein levels (3-hr incubation) of protein kinase A (PKA), glucose-6-phosphatase (G6P), phosphorylase kinase (PKC-1), glycogen phosphorylase (GP), and phosphoenolpyruvate carboxykinase (PECK). In small interfering RNA-treated cells, the protein levels of these enzymes were not significantly different from PBS-treated cells (white). Corresponding original western blots are shown in Figure S4, and uncropped blots are shown in Figures S5 and S6. ∗∗p < 0.01, ∗∗∗p < 0.001 tested using one-way ANOVA corrected for multiple testing (Sidak-Holm). n = 3–6.
Discussion
Here, we unequivocally identified a glucagon variant (PG 1-61) in humans, using a mass-spectrometry-based platform for low-abundant plasma peptides (Wewer Albrechtsen et al., 2016), and subsequently characterized its potential biological functions in vitro, ex vivo, and in vivo. Collectively, our data suggest that circulating PG 1-61 may contribute to the dysregulation of glucose homeostasis in clinical conditions including renal dysfunction, obesity, type 2 diabetes, and after Roux-en-Y gastric bypass, whereas its circulating levels in healthy lean controls did not exceed our analytical detection limit.
First, we demonstrated that PG 1-61 activates the hGCGR, but not the hGLP-1R, with similar efficacy as native glucagon but with lower potency. PG 1-61, like glucagon, increased cAMP and insulin secretion in cultured β cells mediated through GCGR signaling, as evidenced by the reduced effect seen after small interfering RNA induced knockdown of GCGR. A similar effect of PG 1-61 on insulin secretion was also observed in isolated rat pancreases, and, when it was given in vivo (intravenously, aimed at reaching similar concentrations to those used in the ex vivo experiments), blood glucose increased and plasma levels of amino acids decreased. The liver is the primary target for glucagon, and, accordingly, PG 1-61 also had hepatic effects. In primary hepatocytes expressing GCGR, PG 1-61 increased levels of cAMP, and this may be associated with relatively small changes in protein levels of enzymes related to the processes of glycogenolysis and gluconeogenesis. However, the latter need to be confirmed in future studies.
Our findings and previous observations (Holst, 1983, Challis et al., 2015, Baldissera and Holst, 1986, Rouillé et al., 1994, Friis-Hansen et al., 2001) suggest that a residual plasticity in proglucagon-producing cells may exist. A single study (Holst, 1983), comparing the gel filtration profiles of plasma from healthy controls to patients with glucagon-producing tumors, reported glucagon-like immunoreactivity with an estimated molecular size of 8,000 Da; however, that variant may actually represent another proglucagon-derived peptide, glicentin (PG 1–—69, ∼8,100 Da), as it contains the entire sequence of glucagon and reacts with antisera directed toward the glucagon sequence.
Using an unbiased mass-spectrometry-based platform, we identified a peptide having the same amino acid sequence as the first 61 amino acids of the proglucagon molecule. Mass-spectrometry technologies can be superior to immune-based assays as they have an absolute specificity (Aebersold and Mann, 2016), but they can be very laborious. We therefore (together with Mercodia) developed an ELISA specific for PG 1-61 in humans, the accuracy of which was validated using the same mass-spectrometry platform as well as gel filtration chromatography. This sandwich ELISA allowed us to obtain secretory profiles of PG 1-61 in subjects with hyperglucagonemia of differing etiologies.
In a previous study in subjects with end-stage renal disease, we found that immunoreactive glucagon concentrations differed according to the immunoassay employed (higher using a C-terminally directed glucagon assay compared to a sandwich ELISA combining N-and C-terminal antibodies) (Wewer Albrechtsen et al., 2014), indicating that the apparent hyperglucagonemia was not due to elevated levels of fully processed glucagon. Analyzing plasma samples from these subjects in the current study established PG 1-61 as the major circulating glucagon variant, with levels increasing in response to an oral glucose load. However, after kidney transplantation, levels of immunoreactive PG 1-61 were dramatically reduced, suggesting that the increased levels observed before transplantation likely reflect decreased renal clearance of this component rather than adaptive changes in proglucagon producing cells leading to increased secretion. On the other hand, given the complete absence of PG 1-61 in the plasma from healthy subjects, it cannot be fully excluded that the presence of this component in the subjects with renal insufficiency might be associated specifically with some aspect of the pathology of their disease. In addition, as glucagon may be affected by freeze-thaw cycles (Wewer Albrechtsen et al., 2015) the same could be true for PG 1-61, and, as such, we may therefore underestimate plasma concentrations of PG 1-61. PG 1-61 could also have a direct effect on the kidneys and thereby contribute to regulate gluconeogenesis; however, further studies will be needed to explore these possibilities.
PG 1-61 was not detected in plasma from subjects with type 2 diabetes during oral glucose administration, but a meal challenge did lead to an increase in plasma levels. Moreover, in morbidly obese subjects and in gastric-bypass-operated individuals, plasma levels of PG 1-61 increased in response to oral administration of macronutrients, but, intriguingly, the magnitude of the responses to the different stimuli varied between the two groups of subjects. In obese subjects, both protein and fat led to increases in immunoreactive PG 1-61, whereas glucose was without effect (as was also seen in subjects with type 2 diabetes). In contrast, in the gastric-bypass-operated individuals, glucose seems to constitute the major driver for PG 1-61 secretion, with only minor effects of protein and fat. These observations raise questions, not only about the mechanisms leading to PG 1-61 secretion, but also about its origin: in the gut or the pancreas? In support of gut-derived PG 1-61, the anatomical rearrangements associated with total pancreatectomy also lead to glucose-induced PG 1-61 secretion. As such, it seems that the molecular heterogeneity of hyperglucagonemia may be derived either from the pancreatic α cells in subjects with obesity and or type 2 diabetes, or from enteroendocrine L cells scattered along the small intestine in patients with rearrangement of such anatomical compartments. The residual plasticity, activated upon metabolic or anatomical alternations, in both α cells and L cells may therefore reflect a potential path to understand and to target dysmetabolic conditions.
Plasma concentrations of PG 1-61 were relatively low (picomolar range), which may be related to the instability of the molecule, as we previously shown for glucagon (Wewer Albrechtsen et al., 2015), and, since it also had lower potency on the glucagon receptor compared to the native peptide, one may question its relevance to dysregulated glucose metabolism in diabetes. That said, PG 1-61 did have glucose regulatory capabilities in human hepatocytes and did significantly increase blood glucose levels in the in vivo rat studies, supporting a role for PG 1-61 in glucose metabolism at least under these circumstances. PG 1-61 may be subject to further cleavage, thereby potentially generating increases in plasma glucagon concentration. However, i.v. injection in rats was not associated with increases in plasma glucagon levels—rather glucagon tended to decrease, which might reflect a negative feedback mechanism involving the interaction with the glucagon receptor on pancreatic α cells. However, in diabetic animal models, PG 1-61 did not inhibit secretion of glucagon, suggesting that such a negative feedback circuit may be blunted in diabetic animals, as a consequence of their hyperglycemia.
In conclusion, we have demonstrated that molecular heterogeneity of glucagon exists, with PG 1-61 being a major additional component. Hyperglucagonemia may therefore, not only reflect hypersecretion of fully processed glucagon, but also of PG 1-61. Moreover, given that PG 1-61 can increase hepatic glucose production and insulin secretion, at least in in vitro and animal studies, it may influence glucose homeostasis in a variety of metabolically related conditions, which are associated with hyperglucagonemia.
Experimental Procedures
Approvals
The clinical studies were conducted according to the latest revision of the Helsinki Declaration, approved by the Scientific-Ethical Committee of the Capital Region of Denmark (H-C-2009-007, H-1-2012-123, H-1-2013-063) and/or the regional ethics committee (KF-01279825) and registered by the Danish Data Protection Agency (2016-41-4892, 2007-58-0015), and at ClinicalTrials.gov (NCT01327378, NCT02372526, NCT02006459, NCT02161666). All participants gave informed written consent. Animal studies were conducted with permission from the Danish Animal Experiments Inspectorate (2013-15-2934-00833) and approved by the local ethical committee (P-15-335, P15-369, P-14-213, and P 17-266).
Study Design
Reserve plasma samples, collected during an oral glucose tolerance test, from individuals with end-stage renal disease and matched, healthy controls were obtained from a comparative, observational study as described previously (Idorn et al., 2013). These samples were used for mass-spectrometry and size-exclusion chromatography and ELISA measurements. Reserve plasma samples from individuals with end-stage renal disease; fasting plasma and during an oral glucose test from 14 individuals, including nine with normal glucose tolerance, were obtained before and after kidney transplantation as part of a prospective, observational, national multicenter study including 54 of 81 (67%) patients, mostly Caucasians, with scheduled living donor kidney transplantation in the period between January 2006 and March 2008, as described previously (Hornum et al., 2010).
Reserve plasma samples from Roux-en-Y gastric bypass-operated subjects, BMI-matched obese individuals (Dirksen et al., 2016; Z.C. Jensen et al., 2016, Diabetes, conference) and subjects with type 2 diabetes (Baranov et al., 2016, Jørgensen et al., 2012) were obtained from previous studies. Participants underwent oral glucose tolerance test or meal stimulation with isocaloric, isovolemic meals of either glucose, fat, or protein (Z.C. Jensen et al., 2016, Diabetes, conference); in addition, we performed L-arginine stimulation tests (Dirksen et al., 2016). Finally, plasma from a previously published study in pancreatectomized patients during an oral glucose tolerance test was analyzed (Lund et al., 2016). Gut biopsies from obese individuals were from a previously published study (Rhee et al., 2015).
Animal Studies
Male Wistar rats (∼250 g, from Taconic Ejby) were housed two per cage under standard conditions for at least 1 week before experiments. Experiments were carried out on non-fasted rats immediately before their nocturnal feeding period (1,700 hr). Rats were divided into three weight-matched treatment groups (glucagon: 265 ± 2 g; PG 1-61: 264 ± 3 g; and D-mannitol: 264 ± 3 g, n = 6/group) and received an intravenous (i.v.) bolus of test substance dissolved in 0.9% NaCl so that the injection volume was 1.5 mL/300 g body weight (w/v, D-mannitol: 20.2%); rats from the same cage received different treatments.
For further details, see Supplemental Experimental Procedures.
Isolated Perfused Rat Pancreas
Cell-Culture Experiments
INS-1E cells were kindly provided by Professor Jens Højriis Nielsen (University of Copenhagen, Denmark). Cells were grown in DMEM (cat. no. 31966-021, GIBCO) containing 5,000 U/mL Pen-Strep (cat. no. 15140-122, GIBCO) and 10% fetal bovine serum (FBS) (cat. no. Sv3016003, Thermo Scientific) before being seeded in 24-well plates (Nunc, Thermo Scientific) at a cell density of 4 × 10⁴ per well. Primary human hepatocytes were obtained using CellStream Isolation Technology (cat. no. HMCS10, lot. no. HUE50-F, Thermo Scientific).
Receptor Studies
qPCR and Small Interfering RNAs
Western Blot Analysis
Peptides and Antibodies
Biochemical Measurements
Glucagon levels were measured using a previously validated sandwich ELISA (Mercodia: cat. no. 10-1281/1271 [Wewer Albrechtsen et al., 2014]) employing an N-terminal anti-glucagon antibody as capture antibody and a C-terminal-specific anti-glucagon antibody as detection antibody. Levels of N-terminally elongated glucagon (PG 1-61) were measured using a sandwich ELISA (Mercodia, presently not commercially available), employing an N-terminal antibody specific for the N-terminal region of the proglucagon molecule (amino acid sequence RSLQDTEE) and the same C-terminal specific anti-glucagon antibody as detection antibody (see above). Insulin levels were measured using a sandwich ELISA from Mercodia (cat. no. 10-1250). cAMP was measured according to manufacturer’s protocol as described above.
Gel Filtration of Human Plasma
Further details are described in Supplemental Experimental Procedures and elsewhere (Challis et al., 2015).
Mass-Spectrometry-Based Detection of Glucagon
Plasma samples were analyzed using a mass-spectrometry-driven platform (Wewer Albrechtsen et al., 2016), with antibody-independent prefractionation steps providing unbiased estimation of the various glucagon forms. See Supplemental Experimental Procedures.
Data and Materials Availability
The accession number for the mass spectrometry proteomics data reported in this paper is ProteomeXchange Consortium via the PRIDE partner repository: PXD005677.
Calculations and Statistics
One-way ANOVA corrected by a post hoc analysis (Sidak) for multiple testing was used for testing differences between more than two groups. Unpaired two-sided t test was used to assess differences between two groups. p < 0.05 was considered significant. Calculations were made using GraphPad Prism version 6.04 for Windows, GraphPad Software, https://www.graphpad.com and STAT14 (SE). For illustrations, the Adobe CC software suite was used. Data are shown as mean ± SD. See Supplemental Experimental Procedures.
Author Contributions
N.J.W.A. and J.J.H. conceptualized and designed of the study; C.Z.J., M.H., C.D., M.S., N.B.J., T.J., A.L., T.V., F.K.K., K.N.B.-M., T.I., B.F.-R., and S.M. provided clinical samples; N.J.W.A., R.E.K., L.S.G., M.N.G., E.B.-M., R.A., M.W.-S., K.D.G., and B.H. performed in vitro, ex vivo, and in vivo studies; N.J.W.A., D.H., F.M., and M.M. performed mass spectrometry-based proteomics; N.J.W.A., R.E.K., C.Z.J., M.H., D.H., C.D., M.S., L.S.G., N.B.J., M.N.G., E.B.-M., R.A., M.W.-S., K.D.G., F.M., T.J., A.L., T.V., F.F.K., K.N.B.-M., T.I., C.F.D., M.M.-R., B.H., B.F.-R., M.M., S.M., and J.J.H. and contributed to the analysis and interpretation of the data; N.J.W.A. drafted the manuscript; R.E.K., C.Z.J., M.H., D.H., C.D., M.S., L.S.G., N.B.J., M.N.G., E.B.-M., R.A., M.W.-S., K.D.G., F.M., T.J., A.L., T.V., F.F.K., K.N.B.-M., T.I., C.F.D., M.M.R., B.H., B.F.-R., M.M., S.M., and J.J.H. critically revised the manuscript for important intellectual content. All authors have provided approval of the final version to be published. J.J.H. and N.J.W.A. are responsible for the integrity of the work as a whole.
Acknowledgments
Mercodia A/S (Uppsala, Sweden), which kindly provided us with reagents for PG 1-61 ELISA, did not have any impact on the study, interpretation of results, or similar. None of the authors will obtain any financial benefits from Mercodia A/S regarding this publication. This work was supported by NNF Center for Basic Metabolic Research, University of Copenhagen, NNF application number: 13563 (Novo Nordisk Foundation, Denmark), EliteForsk Rejsestipendiat (2016), The Danish Council for Independent Research (DFF – 1333-00206A), Augustinus Foundation, Aase og Ejnar Danielsens Fond, Mærsk Fonden, Holger Rabitz fond, Læge Johannes Nicolaj Krogsgaard og hustru Else Krogsgaards minde-legat for medicinsk forskning og medicinske studenter ved Københavns Universitet, European Molecular Biology Organization (EMBO), and the European Foundation for the Study of Diabetes (EFSD).
Published: November 7, 2017
Footnotes
Supplemental Information includes Supplemental Experimental Procedures and five figures and can be found with this article online at https://doi.org/10.1016/j.celrep.2017.10.034.
Supplemental Information
References
- Aebersold R., Mann M. Mass-spectrometric exploration of proteome structure and function. Nature. 2016;537:347–355. doi: 10.1038/nature19949. [DOI] [PubMed] [Google Scholar]
- Baldissera F.G., Holst J.J. Glicentin 1-61 probably represents a major fraction of glucagon-related peptides in plasma of anaesthetized uraemic pigs. Diabetologia. 1986;29:462–467. doi: 10.1007/BF00506540. [DOI] [PubMed] [Google Scholar]
- Baranov O., Kahle M., Deacon C.F., Holst J.J., Nauck M.A. Feedback suppression of meal-induced glucagon-like peptide-1 (GLP-1) secretion mediated through elevations in intact GLP-1 caused by dipeptidyl peptidase-4 inhibition: A randomized, prospective comparison of sitagliptin and vildagliptin treatment. Diabetes Obes. Metab. 2016;18:1100–1109. doi: 10.1111/dom.12706. [DOI] [PubMed] [Google Scholar]
- Challis B.G., Albrechtsen N.J.W., Bansiya V., Burling K., Barker P., Hartmann B., Gribble F., O’Rahilly S., Holst J.J., Simpson H.L. Heterogeneity of glucagonomas due to differential processing of proglucagon-derived peptides. Endocrinol. Diabetes Metab. Case Rep. 2015;2015:150105. doi: 10.1530/EDM-15-0105. [DOI] [PMC free article] [PubMed] [Google Scholar]
- Dirksen C., Eiken A., Bojsen-Møller K.N., Svane M.S., Martinussen C., Jørgensen N.B., Holst J.J., Madsbad S. No islet cell hyperfunction, but altered gut-islet regulation and postprandial hypoglycemia in glucose-tolerant patients 3 years after gastric bypass surgery. Obes. Surg. 2016;26:2263–2267. doi: 10.1007/s11695-016-2197-x. [DOI] [PubMed] [Google Scholar]
- Friis-Hansen L., Lacourse K.A., Samuelson L.C., Holst J.J. Attenuated processing of proglucagon and glucagon-like peptide-1 in carboxypeptidase E-deficient mice. J. Endocrinol. 2001;169:595–602. doi: 10.1677/joe.0.1690595. [DOI] [PubMed] [Google Scholar]
- Gromada J., Franklin I., Wollheim C.B. α-cells of the endocrine pancreas: 35 years of research but the enigma remains. Endocr. Rev. 2007;28:84–116. doi: 10.1210/er.2006-0007. [DOI] [PubMed] [Google Scholar]
- Holst J.J. Molecular heterogeneity of glucagon in normal subjects and in patients with glucagon-producing tumours. Diabetologia. 1983;24:359–365. [PubMed] [Google Scholar]
- Hornum M., Jørgensen K.A., Hansen J.M., Nielsen F.T., Christensen K.B., Mathiesen E.R., Feldt-Rasmussen B. New-onset diabetes mellitus after kidney transplantation in Denmark. Clin. J. Am. Soc. Nephrol. 2010;5:709–716. doi: 10.2215/CJN.05360709. [DOI] [PMC free article] [PubMed] [Google Scholar]
- Idorn T., Knop F.K., Jørgensen M., Holst J.J., Hornum M., Feldt-Rasmussen B. Gastrointestinal factors contribute to glucometabolic disturbances in nondiabetic patients with end-stage renal disease. Kidney Int. 2013;83:915–923. doi: 10.1038/ki.2012.460. [DOI] [PubMed] [Google Scholar]
- Jørgensen N.B., Jacobsen S.H., Dirksen C., Bojsen-Møller K.N., Naver L., Hvolris L., Clausen T.R., Wulff B.S., Worm D., Lindqvist Hansen D. Acute and long-term effects of Roux-en-Y gastric bypass on glucose metabolism in subjects with Type 2 diabetes and normal glucose tolerance. Am. J. Physiol. Endocrinol. Metab. 2012;303:E122–E131. doi: 10.1152/ajpendo.00073.2012. [DOI] [PubMed] [Google Scholar]
- Lund A., Bagger J.I., Wewer Albrechtsen N.J., Christensen M., Grøndahl M., Hartmann B., Mathiesen E.R., Hansen C.P., Storkholm J.H., van Hall G. Evidence of extrapancreatic glucagon secretion in man. Diabetes. 2016;65:585–597. doi: 10.2337/db15-1541. [DOI] [PubMed] [Google Scholar]
- Rhee N.A., Wahlgren C.D., Pedersen J., Mortensen B., Langholz E., Wandall E.P., Friis S.U., Vilmann P., Paulsen S.J., Kristiansen V.B. Effect of Roux-en-Y gastric bypass on the distribution and hormone expression of small-intestinal enteroendocrine cells in obese patients with type 2 diabetes. Diabetologia. 2015;58:2254–2258. doi: 10.1007/s00125-015-3696-3. [DOI] [PubMed] [Google Scholar]
- Rouillé Y., Westermark G., Martin S.K., Steiner D.F. Proglucagon is processed to glucagon by prohormone convertase PC2 in alpha TC1-6 cells. Proc. Natl. Acad. Sci. USA. 1994;91:3242–3246. doi: 10.1073/pnas.91.8.3242. [DOI] [PMC free article] [PubMed] [Google Scholar]
- Unger R.H., Cherrington A.D. Glucagonocentric restructuring of diabetes: A pathophysiologic and therapeutic makeover. J. Clin. Invest. 2012;122:4–12. doi: 10.1172/JCI60016. [DOI] [PMC free article] [PubMed] [Google Scholar]
- Vrang N., Larsen P.J. Preproglucagon derived peptides GLP-1, GLP-2 and oxyntomodulin in the CNS: Role of peripherally secreted and centrally produced peptides. Prog. Neurobiol. 2010;92:442–462. doi: 10.1016/j.pneurobio.2010.07.003. [DOI] [PubMed] [Google Scholar]
- Wewer Albrechtsen N.J., Hartmann B., Veedfald S., Windeløv J.A., Plamboeck A., Bojsen-Møller K.N., Idorn T., Feldt-Rasmussen B., Knop F.K., Vilsbøll T. Hyperglucagonaemia analysed by glucagon sandwich ELISA: Nonspecific interference or truly elevated levels? Diabetologia. 2014;57:1919–1926. doi: 10.1007/s00125-014-3283-z. [DOI] [PubMed] [Google Scholar]
- Wewer Albrechtsen N.J., Bak M.J., Hartmann B., Christensen L.W., Kuhre R.E., Deacon C.F., Holst J.J. Stability of glucagon-like peptide 1 and glucagon in human plasma. Endocr. Connect. 2015;4:50–57. doi: 10.1530/EC-14-0126. [DOI] [PMC free article] [PubMed] [Google Scholar]
- Wewer Albrechtsen N.J., Hornburg D., Albrechtsen R., Svendsen B., Toräng S., Jepsen S.L., Kuhre R.E., Hansen M., Janus C., Floyd A. Oxyntomodulin identified as a marker of type 2 diabetes and gastric bypass surgery by mass-spectrometry based profiling of human plasma. EBioMedicine. 2016;7:112–120. doi: 10.1016/j.ebiom.2016.03.034. [DOI] [PMC free article] [PubMed] [Google Scholar]
Associated Data
This section collects any data citations, data availability statements, or supplementary materials included in this article.