Abstract
Renin lineage cells (RLCs) serve as a progenitor cell reservoir during nephrogenesis and after renal injury. The maintenance mechanisms of the RLC pool are still poorly understood. Since RLCs were also identified as a progenitor cell population in bone marrow we first considered that these may be their source in the kidney. However, transplantation experiments in adult mice demonstrated that bone marrow-derived cells do not give rise to RLCs in the kidney indicating their non-hematopoietic origin. Therefore we tested whether RLCs develop in the kidney through neogenesis (de novo differentiation) from cells that have never expressed renin before. We used a murine model to track neogenesis of RLCs by flow cytometry, histochemistry, and intravital kidney imaging. During nephrogenesis RLCs first appear at e14, form a distinct population at e16, and expand to reach a steady state level of 8–10% of all kidney cells in adulthood. De novo differentiated RLCs persist as a clearly detectable population through embryogenesis until at least eight months after birth. Pharmacologic stimulation of renin production with enalapril or glomerular injury induced the rate of RLC neogenesis in the adult mouse kidney by 14% or more than three-fold, respectively. Thus, the renal RLC niche is constantly filled by local de novo differentiation. This process could be stimulated consequently representing a new potential target to beneficially influence repair and regeneration after kidney injury.
Keywords: renal cell biology, renal development, renal injury, renin-angiotensin system, transgenic mouse
Renin is a limiting enzyme of the circulating endocrine branch of the renin-angiotensin system (RAS).1 The RAS is a key player in the control of arterial blood pressure. In adulthood, renin is produced by juxtaglomerular cells in the afferent arterioles (AAs) of the kidney. A small amount of renin mRNA is also expressed by multiple extrarenal cell populations as a part of the tissue RASs, which are believed to modulate the local effects of the systemic RAS.2
During development, renin is markedly expressed throughout the kidney in precursor cells, which differentiate into mural (vascular smooth muscle cells and pericytes), glomerular, tubular, and interstitial cells.3,4 Collectively, these form the renal renin lineage cell (RLC) pool, and the renin-producing cells (or renin-positive cells) in AAs of the adult kidney comprise only a minor portion of this pool (approximately 0.01% of the total kidney cell mass). The RLC pool is central to nephrogenesis because the inactivating renin mutations in both humans and mice can lead to glomerulosclerosis, arterial thickening, and tubular dysgenesis, consequently resulting in the deterioration of renal function and early death.5,6 The developmental pattern of renin expression is partially recapitulated in adulthood when after chronic stimulation (e.g., angiotensin II antagonism, arterial hypotension, etc.), the renin gene is switched on in vascular smooth muscle cells of the renin lineage within the upstream portions of AAs.1,3 This process is reversible and is known as metaplastic transformation, which is a confusing term implying pathology, when in fact, it is a normal reenactment of the embryonic pattern by cells previously capable of synthesizing renin. Thus, renin expression in the kidney involves spatiotemporal plasticity, which is preserved in adult life. Importantly, pharmacologic RAS inhibition (RASi), which is the first choice of renoprotective therapy,7–9 potently induces the recruitment of reninproducing cells in AAs,1,3 raising the intriguing possibility that the beneficial effects of RAS inhibitors are at least in part because of the increased number of renin-positive RLCs in the kidney.
We recently found that renin-positive RLCs differentiate into renin-negative intraglomerular mesangial cells in a mouse model of mesangial proliferative glomerulonephritis.10 Findings of other studies demonstrated that RLCs are also able to give rise to further glomerular cells after injury, implying that RLCs generally serve as a progenitor cell niche.11,12 Thus, RLCs have important structural and functional roles in the adult kidney, which are not related to classical RAS function (i.e., blood pressure control).
Current experimental evidence clearly demonstrates that at least some RLCs retain their differentiating capacity in adult life. However, whether and how the renal RLC niche is replenished after nephrogenesis remains unknown. Here, we attempted to assess 2 mechanisms that might be responsible for maintaining the adult kidney RLC population, namely recruitment of bone marrow (BM) cells and local neogenesis (referred to as de novo differentiation).
For this assessment, we generated BM chimeric mice and studied double transgenic mice in which RLC neogenesis could be quantified. We found that BM cells do not differentiate into renal RLCs of the adult kidney. Instead, intrarenal neogenesis of RLCs (defined as switching on of the renin gene in a cell that has never before expressed renin) was detected. RLC neogenesis existed at a relatively constant level, beginning early in nephrogenesis and persisting in adulthood. Importantly, the rate of RLC neogenesis could be stimulated by pharmacologic and damaging factors in adulthood, thus underscoring the regenerative capacity of mature mammalian kidneys.
RESULTS
RLCs in adult mouse kidneys
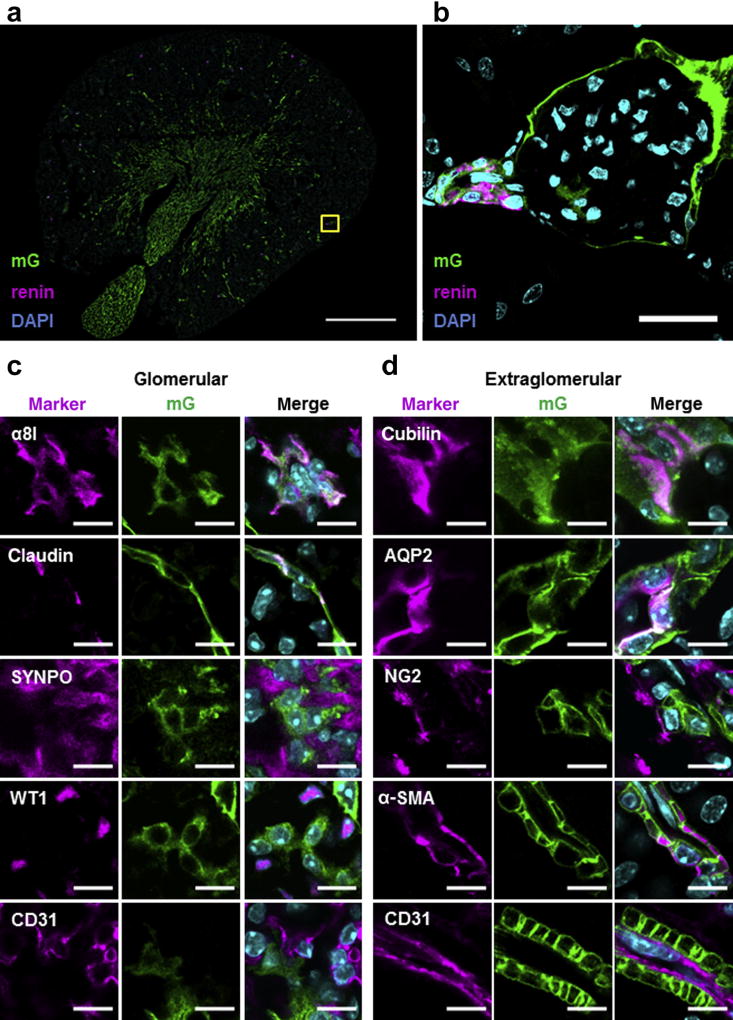
During nephrogenesis, RLCs develop into different cell types of mature kidneys. Double transgenic mice expressing Cre recombinase from the endogenous renin locus (Ren1d) and the mT/mG cassette from the Rosa26 locus (mRenCre-mT/mG) were used to trace RLCs in adult kidneys. The mT/mG construct switches from membrane-directed fluorescent tomato protein (mT, red) to membrane-directed enhanced green fluorescent protein (eGFP; mG) expression after Cre-mediated recombination.13 Because gene expression from the Rosa26 locus is ubiquitous and gene switch is stably transferred to cell progeny, all RLCs are mG positive, while all non-RLCs remain mT positive. Using this mouse model and confocal laser scanning microscopy, we proved that many kidney cell types develop from RLCs. Renin cells in their classical juxtaglomerular position comprise only a small portion of all RLCs in adult mouse kidneys (Figure 1a and b). In addition to renin cells, RLCs (mG+) include glomerular cells such as some mesangial and parietal epithelial cells (Figure 1c), as well as extraglomerular cells (a subset of tubular cells, NG2-positive interstitial cells, and vascular smooth muscle cells) (Figure 1d). Neither podocytes nor endothelial cells appear to be of RLC origin (Figure 1c and d). These findings are in complete agreement with those previously reported.3,14,15
Figure 1. Renin lineage cells (RLCs) give rise to many different cell types in adult mouse kidneys.
(a) Representative overview image of RLCs (mG+) and their renin-positive subpopulation in the kidneys of adult mRenCre-mT/mG mice. Bar = 1 mm. (b) Renin-producing cells at their classical juxtaglomerular position (high-magnification confocal image of the yellow frame area indicated in [a]). The 4′,6-diamidin-2-phenylindol (DAPI); nuclear marker. Bar = 25 µm. (c) Representative confocal images of glomerular cell marker expression in RLCs; α8 integrin (α8I)-mesangial cell marker, claudin-parietal epithelial cell (PEC) marker, synaptopodin (SYNPO), Wilm’s tumor protein 1 (WT1)-podocyte cell markers, and cluster of differentiation (CD)31-endothelial cell marker. Merged images contain 3 fluorescent channels (for the corresponding cell marker, mG, and DAPI). Bar = 10 µm. (d) Representative confocal images of extraglomerular cell marker expression in RLCs; cubilin and aquaporin 2 (AQP2)-tubular cell markers (for the proximal tubule and collecting duct, respectively), NG2-interstitial cell marker, α-smooth muscle actin (α-SMA), and CD31-vascular cell markers (for vascular smooth muscle cells and endothelial cells, respectively). Merged images contain 3 fluorescent channels (for the corresponding cell marker, mG, and DAPI). Bar = 10 µm. To optimize viewing of this image, please see the online version of this article at www.kidney-international.org.
RLCs in BM, blood, and spleen
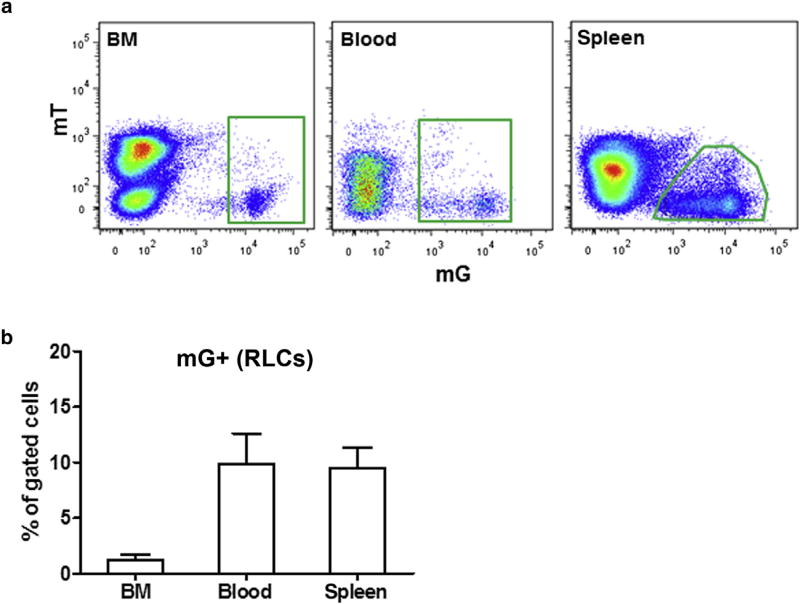
Using the mRenCre-mT/mG strain, we assessed whether BM could be a source of RLCs in adult kidneys. This was a plausible assumption because a pool of renin-positive progenitor RLCs was recently identified in BM of adult mice, and they might have the potential to give rise to renal RLCs.16 According to previous findings, populations of RLCs (mG+) were detected by flow cytometry in BM, peripheral blood, and spleen of mRenCre-mT/mG mice (Figure 2a).16 BM-derived mG+ cells comprised approximately 1% of BM and 10% of blood and spleen cells (Figure 2b). In agreement with earlier data, most BM-derived RLCs (60%–90%) were positive for B-lymphocyte markers (Supplementary Figure S1).16 These findings delineate an existing pool of BM-derived RLCs, which we hypothesized to potentially serve as a reservoir for RLCs in the kidney.
Figure 2. Renin lineage cells (RLCs; mG +) in the bone marrow (BM), blood, and spleen of adult mice.
(a) Representative flow cytometric analyses; (b) quantification of RLCs in the BM, blood, and spleen of adult mice. Data are presented as mean ± SD; n = 5 per group.
BM transplantation from mRenCre-mT/mG into wild-type mice revealed that BM-derived cells did not become RLCs in adult kidneys
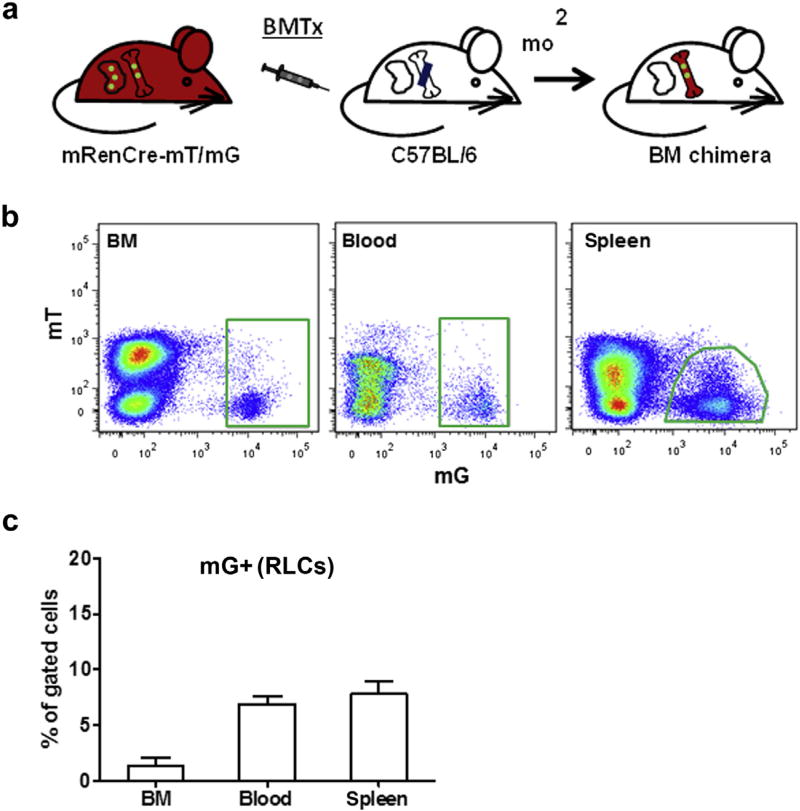
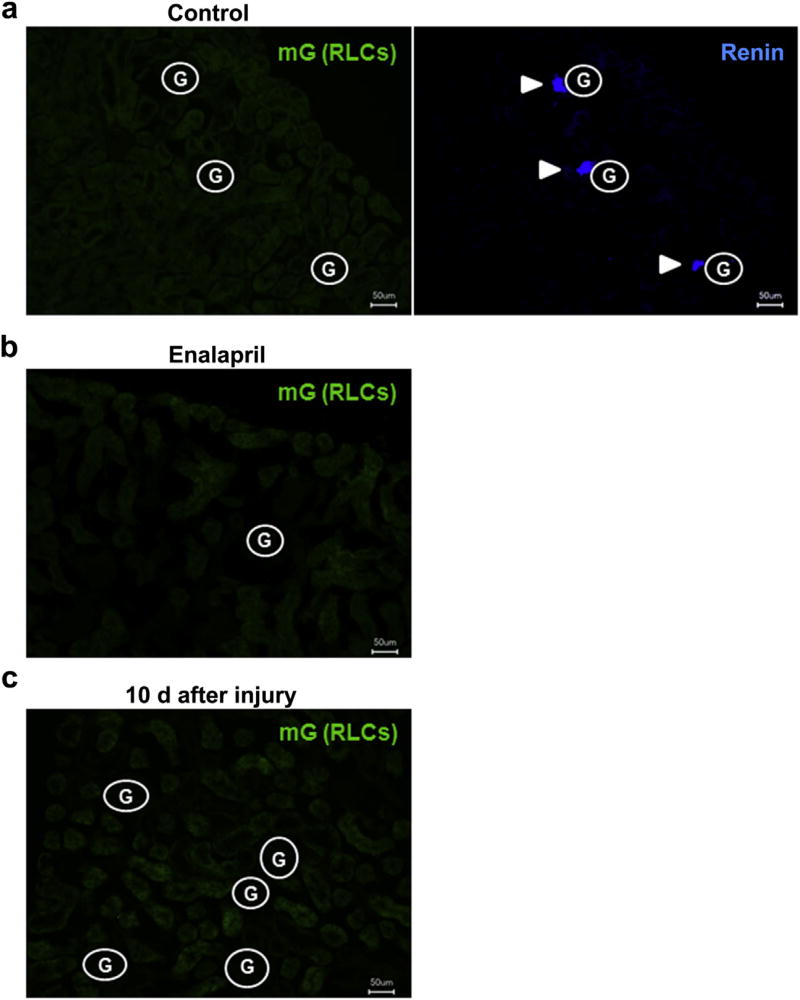
To test whether BM-derived RLCs may give rise to RLCs in adult kidneys, we transplanted BM from mRenCre-mT/mG mice into irradiated wild-type mice with the same genetic background (C57BL/6, Figure 3a). Two months after BM transplantation (BMTx), BM-derived RLCs were clearly identified in BM, blood, and spleen of the recipient mice, thus confirming that BMTx was efficient (Figure 3b and c). Using fluorescence microscopy, we failed to detect BM-derived RLCs in the kidney of recipient mice despite normal distribution of resident renin-positive cells (Figure 4a). These findings were supported by similar findings 6 months after BMTx and were confirmed by flow cytometry that detected only few BM-derived cells in kidneys. However, these cells were entirely positive for the hematopoietic marker cluster of differentiation (CD)45, were not enriched at the vascular glomerular pole, and were stained negative for renin, indicating low level influx of inflammatory cells but no contribution to the renal RLC niche (Supplementary Figure S2).
Figure 3. Bone marrow transplantation (BMTx) from mRenCre-mT/mG mice into wild-type mice.
(a) Scheme of the BMTx protocol. Bone marrow (BM) was isolated from mRenCre-mT/mG mice and transplanted in irradiated wild-type C57BL/6 mice. (b) Renin lineage cells (RLCs; mG+) of mRenCre-mT/mG donor mice in the BM, blood, and spleen of C57BL/6 recipient mice. (c) Quantification of donor RLCs (mG+) in the BM, blood, and spleen of recipient mice. Data are presented as mean ± SD; n = 5 per group.
Figure 4. Bone marrow (BM)–derived renin lineage cells (RLCs) are not detected in kidneys of recipient mice after bone marrow transplantation (BMTx).
(a) No BM-derived RLCs (mG+) in the kidney sections of control untreated recipient mice 2 months after BMTx (left panel), while the typical juxtaglomerular expression pattern of the renin protein was detectable (right panel). (b,c) No BM-derived RLCs (mG+) in the kidney sections of recipient mice 2 months after BMTx and after enalapril treatment (10 mg/kg for 7 days, b) or mesangial cell injury (10 days, c). To optimize viewing of this image, please see the online version of this article at www.kidney-international.org.
Similarly, pharmacologic RASi (treatment with the angiotensin-converting enzyme [ACE] inhibitor enalapril) or induction of reversible mesangiolysis1,10,17 did not lead to engraftment of BM-derived RLCs in the kidney or replacement of resident cells (Figure 4b and c, respectively). Thus, we concluded that RLCs in adult mouse kidneys do not originate from BM cells under physiologic or pharmacologic conditions or after kidney damage.
Intrarenal neogenesis of RLCs during nephrogenesis and in adult kidneys
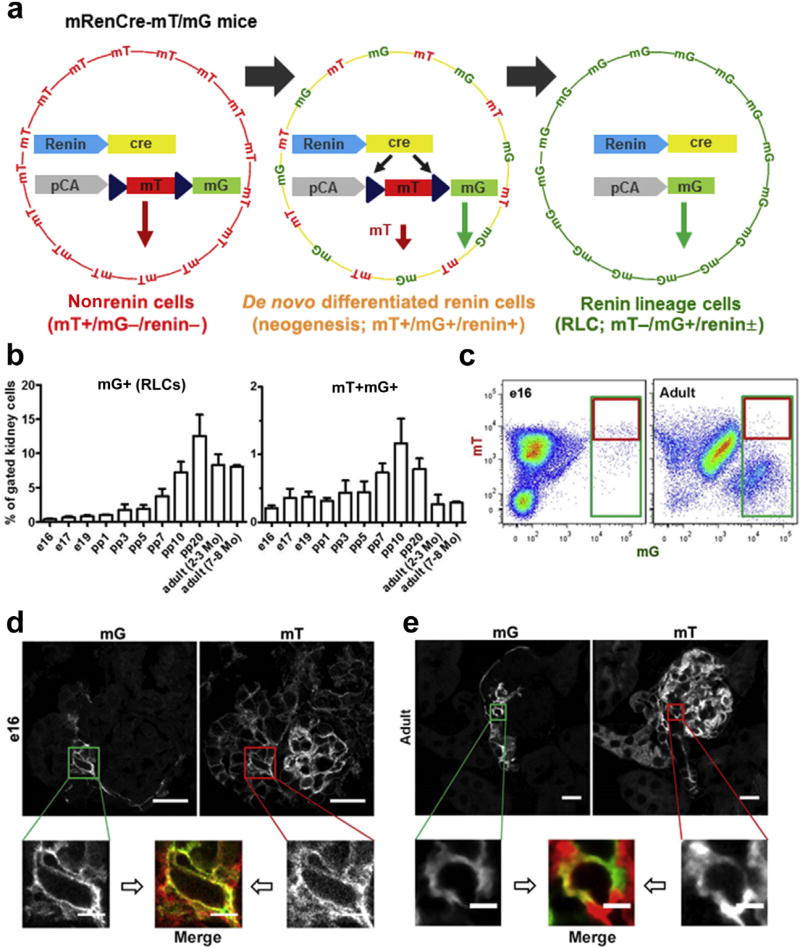
Next, we considered the possibility that RLCs develop through intrarenal neogenesis. For comparison and for maintaining consistency, we sought to address this assumption using the same double transgenic mRenCre-mT/mG mice as used previously (Figure 5a). During the Cre-induced transition from mT to mG expression in mRenCre-mT/mG mice, the onset of mG labeling started within the first day of the transcriptional switch, whereas the mT protein was still detectable for at least 1 to 2 days subsequently (Figure 5a).13,18 Within this period, cells are mT+mG+ double positive and later become only green (mG+). Newly differentiated RLCs, which express renin for the first time, will express both fluorophores (mT+mG+), whereas long-lived RLC and their descendants will be green (mT−mG+). Using quantitative flow cytometry analysis and the gating provided in Supplementary Figure S3, we detected progressive increases in the relative amount of RLCs (mG+) during nephrogenesis (Figure 5b, left panel and c). RLCs were first observed at embryonic day e14, formed a clearly detectable population in flow cytometric analysis at embryonic day e16, and peaked after postpartum day pp10. After the end of nephrogenesis (pp7–pp10 in mice), the percentage of RLCs remained constant at approximately 10% of all kidney cells until 8 months of age. The time course of RLC neogenesis rate during kidney development fluctuated at 0.25% to 0.5% of all kidney cells until pp5 and peaked from pp7 to pp20, reaching above 1% of all kidney cells (Figure 5b, right panel and c). The peak in the de novo differentiation of RLCs around the end of nephrogenesis timely precedes the steepest increase in the percentage of RLCs, indicating that this process mechanistically represents the essential driver of the maximal RLC pool expansion. Unexpectedly, RLC neogenesis continued in the adult kidney at a remarkable rate of approximately 0.2% to 0.3% of all kidney cells. Within the mG+ RLC pool, neogenesis dominated during the embryonic state and gradually decreased after birth, displaying a marked decrease after pp10 because of RLC pool expansion (Supplementary Figure S4). Apparently, persisting RLC neogenesis in the mature kidney is a central mechanism for compensating for apoptotic cell death occurring in RLCs, as demonstrated in Supplementary Figure S5. Using confocal microscopy, we detected mT+mG+ cells at e16 in vessel-like structures of periglomerular areas (Figure 5d), as well as inside glomeruli (Supplementary Figure S6). In adult mice, mT+mG+ cells were observed at the vascular pole of the glomerulus (Figure 5e).
Figure 5. Neogenesis of renin lineage cells (RLCs) in mouse kidneys during nephrogenesis and in adulthood.
(a) Detection principle of de novo differentiated RLCs in the mRenCre-mT/mG mouse model modified from Xiao et al.18 All nonrenin cells are positive for mT (but negative for mG and renin), and de novo differentiated renin cells are positive for both mT and mG (and renin) for a short period, whereas all RLCs (newly differentiated and long lived) are positive for mG, negative for mT, and positive or negative for renin. (b) Quantification of RLCs (mG+, left panel) and de novo differentiated RLCs (mT+mG+, right panel) in the developing and adult kidney. (c) Representative flow cytometric analyses of e16 (left panel) and adult (2–3 months old, right panel) kidneys. (d) Representative confocal images of de novo differentiated RLCs (mT+mG+) in the e16 kidney. (e) Representative confocal images of de novo differentiated RLCs (mT+mG+) in the adult (2–3 months old) kidney. Bar = 20 µm (or 5 µm in zoomed images). Data are presented as mean ± SD; n ≥ 6 per group. To optimize viewing of this image, please see the online version of this article at www.kidney-international.org.
Renin-positive cells and neogenesis of RLCs
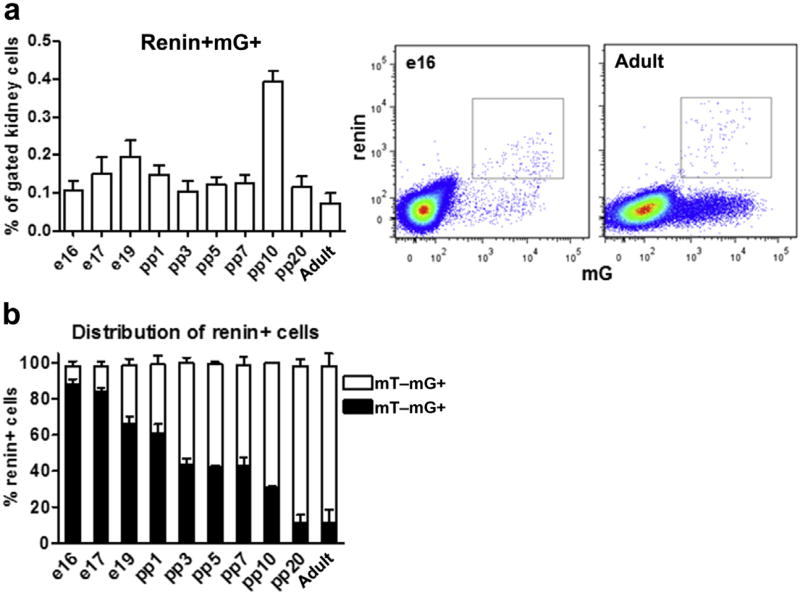
Renin-producing cells in AAs form a distinct subpopulation with established precursor characteristics within the RLC pool.10–12 Therefore, we particularly tracked their neogenesis. Similar to de novo-differentiated RLCs, renin-positive RLCs formed a steady population during nephrogenesis and in adult kidneys, fluctuating at approximately 0.1% to 0.2% of all renal cells with a sole peak on pp10 (0.4% of all renal cells, Figure 6a). Within the mG+ RLC pool, the percentage of renin-positive cells decreased during nephrogenesis (because of RLC pool expansion), and notably, only <1% of all RLCs in adult kidneys remained renin positive (Supplementary Figure S7; Figure 1a). The same percentage of renin-positive RLCs was previously found in BM, blood, and spleen.16 The de novo-differentiated subpopulation (mT+mG+) of renin-positive cells decreased during kidney development (e17-pp10, Figure 6b). While during nephrogenesis, up to 9 of 10 renin-positive cells were newly differentiated, in the mature kidney, 1 of 10 renin-positive cells at a given time point differentiated de novo, indicating a low neogenesis rate. Thus, as expected in adulthood, renin-positive cells in AAs appear to be predominantly long lived (mT−mG+) and approximately 10% of them (mT+mG+) are continuously renewed by neogenesis.
Figure 6. Renin-positive cells in the neogenesis of renin lineage cells (RLCs).
(a) Quantification of renin-positive RLCs (mG+) in developing and adult kidneys (left panel) with representative flow cytometric analyses for e16 and adult (2–3 months of age) kidneys (middle and right panels, respectively); (b) percentage distribution of renin-positive (renin+) cells to de novo differentiated (mT+mG+) and long-lived (mT−mG+) subpopulations of RLCs in developing and adult kidneys. Data are presented as mean ± SD; n ≥ 6 per group.
ACE inhibition stimulated renin production and RLC neogenesis
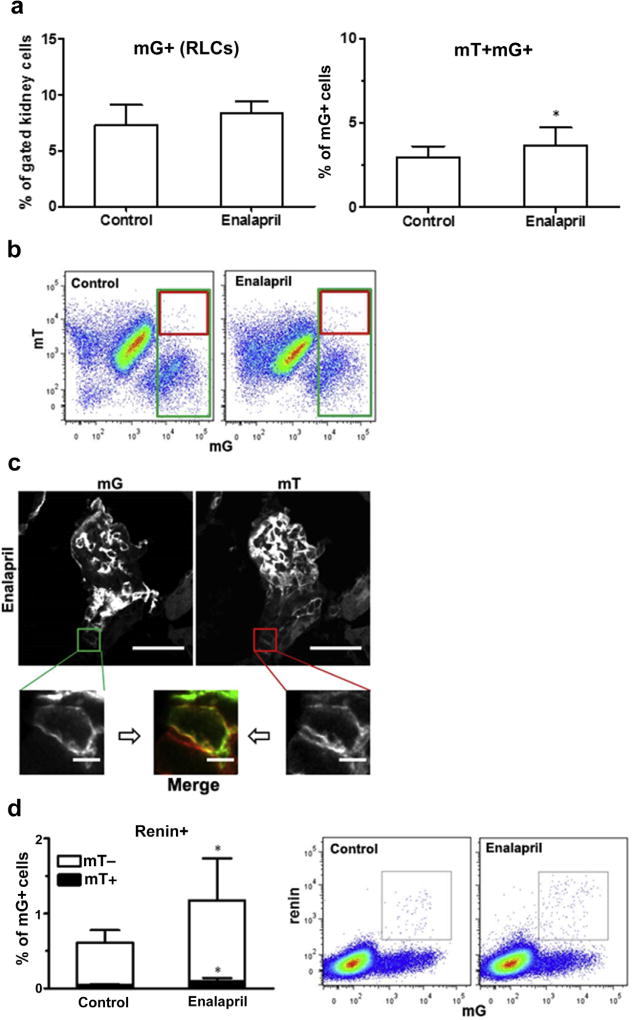
We addressed the possibility that not only renin expression but also RLC neogenesis could be induced in adult life by pharmacologic RASi (treatment with the ACE inhibitor enalapril). While the overall renal RLC pool did not statistically increase after treatment, the fraction of de novo-differentiated RLCs significantly increased (Figure 7a and b). De novo-differentiated cells were observed in AAs of enalapril-treated animals on confocal microscopy (Figure 7c). The renin-producing cell pool is restricted to AAs in adult wild-type mice after enalapril treatment.1 Therefore, we specifically investigated the neogenesis of renin-positive cells because it reflects the changes in RLCs in the AA area. The fraction of renin-positive cells to all RLCs doubled after enalapril treatment, while equivalently, the fraction of newly differentiated RLCs to all RLCs also doubled within the renin-positive cell population (Figure 7d). This indicates that in adults, enalapril mainly expands the renin-positive cell pool in AAs via metaplastic transformation of RLCs that were previously capable of producing renin (at 90%), while 10% of the pool expansion is related to de novo-differentiated RLCs.
Figure 7. Neogenesis of renin lineage cells (RLCs) in the mouse kidney after enalapril treatment.
Mice were treated with the angiotensin-converting enzyme inhibitor enalapril (10 mg/kg for 7 days) to stimulate renin production. (a) Quantification of RLCs (mG+, left panel) and de novo differentiated RLCs (mT+mG+, right panel) in the kidneys of control (untreated) and enalapril-treated mice. (b) Representative flow cytometric analyses of kidneys from control (left panel) and enalapril-treated animals (right panel). (c) Representative confocal images of de novo differentiated RLCs (mT+mG+) in the kidneys of enalapril-treated mice (images from control animals are presented in Figure 5e). (d) Quantification of renin-positive RLCs and their distribution to de novo differentiated (mT+) and long-lived (mT−) subpopulations of RLCs (mG+) in the kidneys of control (untreated) and enalapril-treated mice (left panel), with representative flow cytometric analyses (middle and right panels). Bar = 20 µm (or 5 µm in zoomed images). Data are presented as mean ± SD; n = 14 per group; *P < 0.05 versus controls (Student unpaired t-test). To optimize viewing of this image, please see the online version of this article at www.kidney-international.org.
Glomerular mesangial injury strongly induced RLC neogenesis
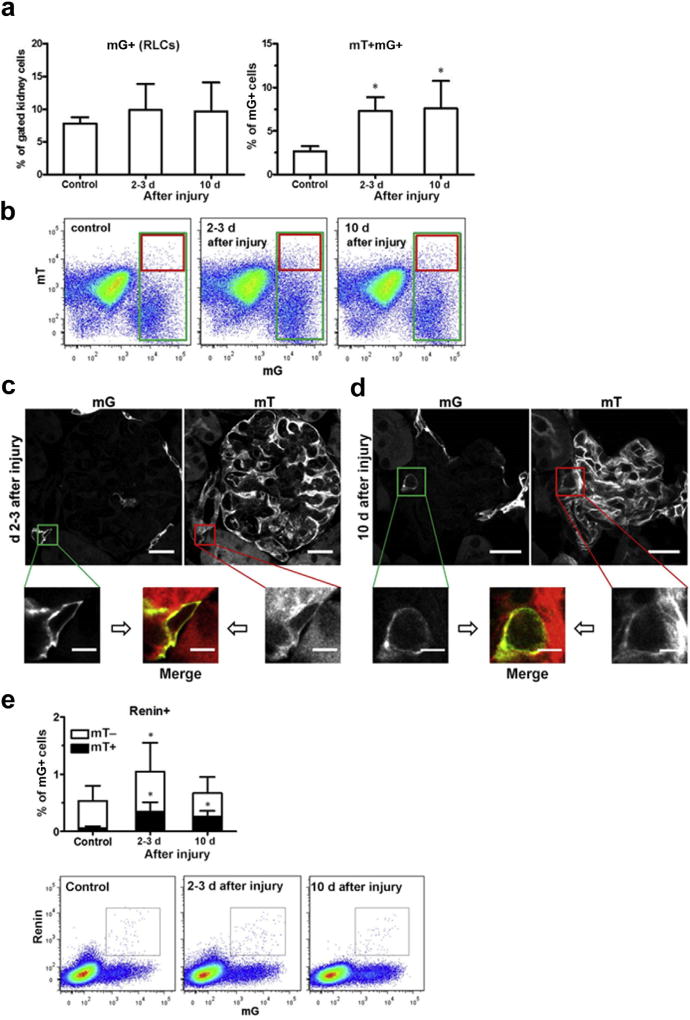
We further studied the impact of reversible mesangial injury on the rate of RLC neogenesis in a model of mesangiolysis and glomerular damage, which peaks 2 to 3 days after injecting an antimesangial cell serum, followed by a regenerative phase at least up to 10 days.10 We previously reported that RLCs repopulate the injured intraglomerular mesangium in the regenerative phase.10 Considering the abovementioned results, we examined the hypothesis that RLC neogenesis is stimulated to fill up the RLC pool after injury induction. Flow cytometry demonstrated that the total number of RLCs in the kidney did not significantly increase at 2 to 3 days and 10 days after injury (Figure 8a, left panel and b). In contrast, de novo-differentiated mT+mG+ RLCs increased by 3-fold at 2 to 3 days and remained significantly elevated until 10 days after injury (Figure 8a, right panel and b). Three and 10 days after injury, mT+mG+ cells were detected using confocal microscopy, predominantly at the vascular pole of the glomerulus (Figure 8c and d). Some double-positive cells were also detected within the glomerulus during the regenerative stage after mesangial injury (day 10, Supplementary Figure S8). Renin positivity in adult mice is restricted to AAs and is used to label extraglomerular renin-positive RLCs before disease induction.10 Furthermore, renin expression in repopulating RLCs has not been reported to occur at intraglomerular locations.10 Therefore, we investigated the time course of neo-genesis of the renin-positive cell fraction of RLCs, which solely reflects the regulation of the renin-positive precursor cell niche in AAs at the vascular pole of the glomerulus. Compared with healthy controls, the fraction of renin-positive cells to RLCs markedly increased in the early injury phase (days 2–3) and was almost indistinguishable from the normal level at the end of the reparative mesangial proliferative phase (10 days; Figure 8e). In contrast, neogenesis of renin-positive cells (mT+mG+) markedly increased (5-fold) on day 2 to 3 and persisted almost at that level up to day 10 (Figure 8e). Thus, during the repair phase of mesangial cell injury, every third renin-positive cell freshly differentiated, demonstrating a shift in the distribution of renin-positive cells from long-lived to de novo-differentiated cells during mesangial regeneration.
Figure 8. Neogenesis of renin lineage cells (RLCs) in mouse kidneys after mesangial cell injury.
In this model, the damage phase peaks at 2 to 3 days, and the mesangial proliferative regenerative phase peaks at day 10 after injecting an antimesangial antibody. (a) Quantification of RLCs (mG+, left panel) and de novo differentiated RLCs (mT+mG+, right panel) in the kidneys of healthy control and diseased mice (days 2–3 and day 10). (b) Representative flow cytometric analyses of the kidneys from healthy control (left panel) and diseased mice (days 2–3 and day 10, middle and right panels, respectively). (c) Representative confocal images of de novo differentiated RLCs (mT+mG+) in the kidney of diseased mice (days 2–3). (d) Representative confocal images of de novo differentiated RLCs (mT+mG+) in the kidney of diseased mice (day 10). Images from control animals are presented in Figure 5e. (e) Quantification of renin-positive RLCs and their distribution to de novo differentiated (mT+) and long-lived (mT−) subpopulations of RLCs (mG+) in the kidneys of healthy control and diseased mice (days 2–3 and day 10, upper panel) with representative flow cytometric analyses (lower panels). Bar = 20 µm (or 5 µm in zoomed images). Data are presented as mean ± SD; n = 9 to 10 per group; *P < 0.05 versus control (1-way analysis of variance). To optimize viewing of this image, please see the online version of this article at www.kidney-international.org.
Intravital imaging of RLC neogenesis in healthy and diseased kidneys
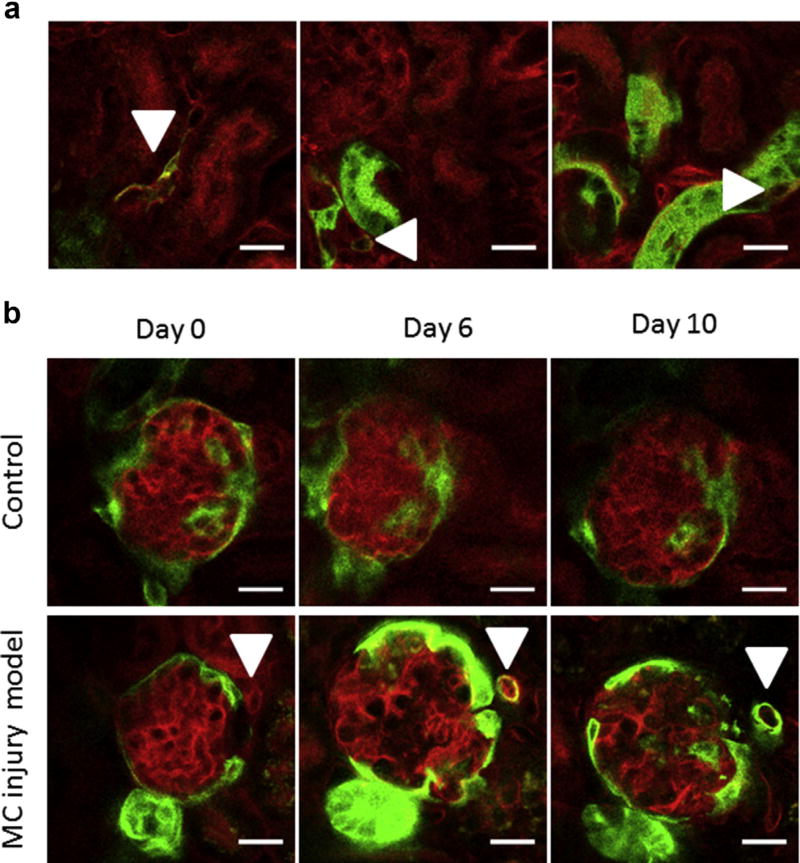
To further validate our findings in living organisms, we performed intravital microscopy of the mouse kidney cortex by modifying the protocol of Hackl et al.19 for upright microscopy. Using this technique, we identified double-positive mT+mG+ de novo-differentiated RLCs in the vascular wall of small cortical arteries (Figure 9a, left panel, arrowhead). Z-stack imaging revealed that the vessel shown in the left panel of Figure 9a was preglomerular because it branched before ending at the vascular pole of a deep glomerulus (Z-stack image sequence movie in Supplementary Movie S1). Peritubular de novo-differentiated mT+mG+ double-positive (thus appearing yellow) RLCs were repeatedly observed, although these were difficult to discriminate. These cells were frequently located next to mG+ tubular segments (Figure 9a, middle and right panels, arrowheads). We also monitored single glomeruli for 10 days in healthy and diseased mice using longitudinal intravital microscopy (Figure 9b). There were no marked changes in the glomerular architecture of healthy controls over time (Figure 9b, upper panels). During disease, we observed severe glomerular alterations, including hypertrophy and dilated capillaries, on day 6 (corresponding to the early regeneration phase after the damage peak), which were largely reversed on day 10 (Figure 9b, lower panels). With the ability to repeatedly visualize the very same areas, we could trace cells undergoing transition from mT+mG- (non-RLC, red) over mT+mG+ (de novo-differentiated RLC, yellow) to mT−mG+ (RLC, green) in living animals during mesangial cell injury progression (Figure 9b, lower panels, arrowheads from left to right). We found frequent RLC neogenesis in the walls of afferent and efferent arterioles, as confirmed by Z-stack serial imaging (Figure 9b, lower panels and Supplementary Movies S2 and S3), although it was a generally rare event in diseased mice.
Figure 9. Intravital kidney imaging of renin lineage cell (RLC) neogenesis.
(a) Intravital imaging of de novo differentiated RLCs (arrowheads, mT+mG+, appearing yellow) in the kidneys of healthy adult mice (2–3 months old). (b) Longitudinal intravital imaging of the de novo differentiation of RLCs in the course of mesangial cell (MC) injury. In this model, the kidney damage phase peaks at 2 to 3 days, and the mesangial proliferative regenerative phase peaks at 10 days after injecting an antimesangial antibody. Upper panels: a glomerulus of a healthy mouse is repetitively imaged at the indicated time points as a control. Lower panels: a single cell in the juxtaglomerular position (marked with an arrowhead at each time point) is mT+ at day 0 (red, non-RLC), switches to mT+mG+ double positive (appearing yellow, de novo differentiated RLC) at day 6, and finally converts to mG+ (green, RLC) at day 10. Bar = 20 µm. To optimize viewing of this image, please see the online version of this article at www.kidney-international.org.
DISCUSSION
RLCs are attracting increasing interest for their role as a progenitor cell niche in the kidney. RLCs act as a precursor pool during nephrogenesis.3 Studies in recent years demonstrated that renin-positive RLCs retain their ability to differentiate and contribute to glomerular repair after injury in adult life. We recently found that RLCs replaced damaged mesangial cells in a mouse model of reversible mesangial injury.10 Other researchers have reported that RLCs might give rise to glomerular epithelial cells such as parietal epithelial cells and podocytes, following the induction of experimental FSGS in mice.12,20 These findings were intriguing because unlike mesangial cells or parietal epithelial cells, podocytes do not belong to the RLC population in the healthy adult mouse kidney (Figure 1). All these findings led us to question whether the RLC pool in the kidney is continuously maintained.
We first considered the possibility that BM-derived cells fill up the renal RLC population because BM functions as a master stem cell reservoir and RLCs have been identified in BM.16 RLCs in BM are important for B-lymphocyte maturation because interference with their transcriptional process leads to highly penetrant B-cell leukemia.16 However, the physiologic role of BM-derived RLCs remained elusive. We confirmed the presence of RLCs in BM, peripheral blood, and spleen. In addition, we could efficiently transplant them to create chimeric mice with labeled BM-derived RLCs. However, our current experiments clearly demonstrate that renal RLCs do not originate from BM cells at least in adult mice. Nonetheless, it is important to note that our assessments did not exclude interactions of BM progenitor cells as a part of the patho-physiologic repair process after renal injury.21 These cells may rather serve as a source of immunomodulatory and paracrine factors, orchestrating the rebuilding of a damaged kidney. In agreement, previous studies performed by us and other groups strongly suggested that after different modes of kidney injury, regenerating renal cells are not related to BM but originate from resident cells, including vascular, tubular, and interstitial progenitor subpopulations.22–27
We next hypothesized that neogenesis, also termed de novo differentiation (from other cell types), is involved in the maintenance of the RLC population in the kidney. The common feature delineating RLCs as a distinct cell pool is the transcriptionally active renin gene either in their predecessors during development or at any stage of their lifespan. Thus, RLCs are marked by renin gene expression without necessarily producing large amounts of renin during their life. Accordingly, the RLC pool in the adult kidney comprises renin-positive cells (the classical renin-producing juxtaglomerular cells in AAs) and plenty of renin-negative cell types with various phenotypes (e.g., vascular smooth muscle cells, glomerular cells, tubular cells, and interstitial cells; Figure 1).3 Because the only decisive predestination step for a single cell to become a cell of the renin lineage is the triggering of renin gene expression, we defined neogenesis/de novo differentiation of RLCs as the first switch-on of the renin gene in any non-RLCs. In this regard, it is important to delineate RLC neogenesis as a completely independent mechanism from metaplastic transformation, which is a reversible phenotype change within the RLC pool, and from proliferation of already existing RLCs.
To track neogenesis in vivo, we used an approach that has been effectively validated in a study on de novo differentiation of insulin-producing cells in the pancreas.18 This approach is based on a bigenic mouse model that combines cell-specific constitutive Cre recombinase with a double-fluorescent reporter that expresses a membrane-targeted red fluorescent protein (tomato, mT) prior to Cre-mediated excision and a membrane-targeted eGFP (mG) after excision.13 The original study reporting the generation of bigenic mT/mG mice addressed the issue of how mT disappears in mG-positive cells after recombination.13 While dilution by cell division could not be completely ruled out (particularly during morphogenesis), the central underlying mechanism of mT protein disappearance and replacement by mG is degradation by proteolysis. In our mice, all cells were mT positive, except for renin-producing cells and their progeny (together comprising the RLC population), which were mG positive.18 When non-RLCs start to express renin for the first time, they appear double positive for a short period because they still contain decreasing amounts of mT but already express mG.18 This time window allowed us to detect and quantify newly differentiating RLCs during kidney development, stimulation of renin production by RASi (enalapril treatment), and regeneration after mesangiolysis. We obtained conforming results by 3 independent readout methods, namely flow cytometry, confocal microscopy, and intravital imaging, thus underscoring the validity of our findings. In nephrogenesis, single RLCs were first observed at e14, which is in agreement with previous reports.28–32 RLCs forming a discernible cell population were detected by flow cytometry in all studied embryonic kidneys not earlier than e16, which is also consistent with current knowledge.1,31 During embryo-genesis, (e16 to pp1), the percentage of RLCs doubled. In the same period, the newly differentiated cells accounted for approximately half of all RLCs. Thus, it could be extrapolated that neogenesis is a major mechanism by which the RLC pool expands in embryonic mouse kidneys. This process continues during renal development until pp10, which marks the end of nephrogenesis in mice. At this time point, the RLC pool reaches approximately 8% to 10% of all kidney cells, whereas the fraction of newly differentiated RLCs still accounts for almost 20% of all renal RLCs. In the adult mouse kidney, almost 10% of all cells are RLCs, highlighting their important structural role. Moreover, de novo differentiation of RLCs persists at a clearly detectable, constant rate, which could be followed up for at least 8 months. The finding that RLC neogenesis persists in adult kidneys is essential because it indicates that the RLC pool is continuously filled up by freshly differentiated cells to compensate for dying RLCs (Figure 5 and Supplementary Figure S5).
Furthermore, we demonstrated that de novo differentiation of RLCs is primed by pharmacologic ACE inhibition. This maneuver increases the number of renin-producing cells in AA mainly by reversible metaplastic transformation and limited proliferation within the RLC population.1,17,20 Although recruitment of RLCs capable of reexpressing renin is the predominant mechanism, our current data indicate neogenesis to be an additional process.
We also found that RLC neogenesis is strongly increased in a mouse model of reversible mesangiolysis. Mesangial cell injury and unbalanced mesangial cell turnover are hallmarks of chronic mesangial proliferative glomerulonephritis (IgA nephropathy), which is the most common primary glomerulopathy in humans.33,34 While the injury mechanism of our mesangial proliferative mouse model is different from IgA nephropathy in humans, the glomerular responses to injury between humans and mice have been shown to be similar (proliferation, cell death, matrix expansion, cellular activation, etc.) in various studies.35,36 We already reported that after injury, RLCs from AAs serve as mesangial precursors that repopulate the injured mesangium within 10 days after disease induction.10 Our current data and previous findings are strongly consistent with a scenario wherein renin-positive RLCs in AAs form a specific precursor cell niche, which is tightly regulated and maintained by neogenesis as part of a coordinated response to injury. Therein, immediately after mesangiolysis (days 2–3), both the total number and the percentage of de novo-differentiated renin-positive RLCs increase to apparently enlarge the precursor cell pool for recruitment to repair the injured mesangium. Later, at the end of mesangial repopulation by RLCs (day 10 of the model), the number of renin-positive RLCs normalizes but neogenesis remains upregulated, and this most likely reflects the refilling of the renin-positive precursor cell pool (Figure 8e). This interpretation is supported by longitudinal intravital microscopy during mesangial cell injury that shows how a cell in juxtaglomerular position, which is non-RLC (red) before model induction, transiently turns yellow with coexpression of red and green fluorescent markers (RLC neogenesis), and later becomes green (RLC). Tracing de novo-differentiating cells using serial kidney imaging of a living animal together with coherent flow cytometry and confocal microscopy data is non-plus-ultra evidence for RLC neogenesis. Our current findings show that RLC neogenesis is involved in replenishing mesangial cells after acute mesangiolysis. It is plausible to assume that after injury, further glomerular epithelial cells types could be replenished through a similar process because RLCs appear to have the potential to differentiate into parietal epithelial cells and podocytes after FSGS.12,20
Neogenesis is the first identified mechanism that plays a role in the physiologic maintenance of the RLC niche in kidneys, and that can be induced upon RASi or by renal injury. The recently described RLC proliferation was observed only after RASi (with or without additional renal injury) and was absent in the adult kidney under basal conditions.20 It should also be noted that reversible metaplastic transformation is not related to the filling up of the RLC niche because it represents a phenotype switch within the RLC pool.
We are aware that although this study provides the first experimental evidence for persistent developmental and physiologic RLC neogenesis, which could be regulated in response to both injury and pharmacologic intervention, the mechanistic role and possible distinct reservoir for this cell niche remain to be addressed in future experiments. Previous reports already suggested a role of renal stromal FoxD1 lineage cells as a source for RLCs in kidneys.15 The contribution of other mesenchymal stem cell-like cells remains to be determined.37
In summary, this study showed that the RLC progenitor cell niche is continuously filled up by de novo differentiation in kidneys but not by BM cells. RLC neogenesis is pharmacologically inducible and is clearly regulated in a coordinated manner after mesangial cell injury. Thus, we provide further support to the concept that the mammalian kidney possesses considerable regenerative potential that may be efficiently targeted by future therapeutic strategies.
METHODS
Animals
We generated transgenic mRenCre-mT/mG mice by crossing previously described mRenCre (Ren1d–Cre) and ROSA mT/mG mice (purchased from The Jackson Laboratory, Bar Harbor, ME).3,13 Both strains have a C57BL/6 background. Only mice that were heterozygous for renin (mRenCre) and mT/mG alleles were used for experiments. All animal studies were conducted according to the German Law of Welfare of Animals and approved by the local authorities.
Experimental protocols
BMTx was performed using 2- to 3-month-old mRenCre-mT/mG mice as donors and C57BL/6 mice as recipients. BM was isolated from the femurs by flushing with Roswell Park Memorial Institute medium (without rhodamine, ThermoFisher; Langenselbold, Germany). Cells were filtered through 40-µm cell strainers (BD Bio-sciences; Heidelberg, Germany), and erythrocytes were lysed using BD Pharm Lyse. Two hours after irradiation of recipients (7.6 Gray for 7 minutes), at least 1.5 million BM donor cells (in Hanks balanced salt solution, ThermoFisher) were injected into the lateral tail vein. Mice were housed under sterile conditions and received antibiotic treatment with ofloxacin for 4 weeks. The efficacy of BMTx was examined by flow cytometric analysis of 50 µl of blood at approximately 5 to 6 weeks after BMTx.
Enalapril (10 mg/kg body weight per day, Sigma-Aldrich; Darmstadt, Germany) was administered to adult (2–3 months old) mRenCre-mT/mG mice for 7 days via drinking water.
To induce reversible mesangial cell injury in adult mRenCre-mT/mG mice (2–3 months old), we used a modification of previously described protocols.10,38 In this study, the animals received a single dose of i.p. lipopolysaccharide (1 mg/kg body weight, Sigma-Aldrich). After 2 hours, heat-inactivated sheep antimouse mesangial cell serum was administered at a dose of 5 µl/g body weight via i.v. tail injection twice in a 24-hour interval. To examine the efficiency of model induction, a kidney survival biopsy was taken on 2 or 3 days after the last serum administration. At the end of the experiment on day 10, a second kidney biopsy was taken. Renal tissues were used for flow cytometry and histochemistry.
Flow cytometry
Blood, BM, spleen, and kidney cells were quantitatively analyzed by flow cytometry. After blood sampling during final biopsy, organs were perfused to remove blood cells. The kidney digestion protocol for flow cytometry has been described in detail elsewhere.26 In brief, kidneys were cut into small pieces; digested in phosphate-buffered saline containing 1% fetal calf serum (ThermoFisher), collagenase type IA (0.25 mg/ml, Sigma-Aldrich), and DNase I (0.25 mg/ml, Sigma-Aldrich); and incubated for 40 minutes at 37°C. The cells were then filtered twice through 40-µm cell strainers (BD Biosciences), and erythrocytes were lysed using BD Pharm Lyse. Spleens were squashed and flushed through 100-µm mesh filters, and red blood cells were lysed. BM was isolated from femurs and filtered through 100-µm cell strainers. After erythrocytes were lysed with BD FACS Lysing Solution, 50 µl of blood was analyzed. Nonspecific staining was prevented using antimouse CD16-CD32. Single-cell suspensions from different organs were incubated with antibodies for 30 minutes at room temperature. Anti-CD19 APC-Cy7 and anti-B220 APC were used to detect B lymphocytes. Intracellular staining of renin was performed using the FIX&PERM Kit (Biozol; Eching, Germany). Renin antibodies were labeled using the Alexa Fluor 647 Monoclonal Antibody Labeling Kit (ThermoFisher). The antibodies were obtained from BD Biosciences, eBioscience (San Diego, CA), and R&D Systems (Minneapolis, MN). For analysis of cell death, kidney homogenates were incubated with 7-aminoactinomycin D (BD Biosciences) and Annexin V BV421 (Bio-Legend; Fell, Germany) for 15 minutes at room temperature. For flow cytometric analysis, BD FACSCanto II (BD Biosciences; Heidelberg, Germany) was used. Data were further analyzed using the FlowJo Software (Tree Star Inc.; Ashland, OR). To exclude doublets, the parameters forward scatter height and forward scatter area were used. To set the gates mT+, mG+, and mT+mG+, a mixture of kidney cells from either tomato-only- or eGFP-only-expressing mice were used (Rosa mT/mG and Tie2-GFP, respectively). These settings were further verified by analyzing kidney cells from mRenCre-mT/mG fetuses in which mG+ cells first appeared, and thus, were mT+mG+ double positive.
Tissue sample preparation for immunohistochemistry and fluorescent microscopy
To preserve the fluorescence of tomato and eGFP, renal tissues were fixed in 4% formaldehyde solution for 24 hours (4°C) and subsequently incubated in 30% sucrose overnight (4°C). Kidneys were embedded in Tissue-Tek (ThermoFisher), frozen on dry ice, and sliced into 6-µm-thick sections. After fixation with acetone (10 minutes, on ice), nonspecific protein binding was blocked by incubation with 5% normal donkey serum in 1% bovine serum albumin-Tris buffered saline for 30 minutes. The complete list of the antibodies used is provided in Supplementary Table S1. Fluorescent images were taken using the Keyence BZ-9000 Generation II microscope (Keyence Deutschland; Neu Isenburg, Germany) at 200× and 400× magnifications.
Confocal microscopy
Confocal images were acquired using an inverted Leica SP5 CLSM (Leica Microsystems; Wetzlar, Germany) equipped with AOBS and HCX PL APO lambda blue 63.0 × 1.40 oil immersion objective. The pinhole size corresponded to 1 arbitrary unit, resulting in an optical 0.773-µm-thick section and lateral pixel size of 100 nm. eGFP (excitation, 488 nm; detection, 495–540 nm) and tomato (excitation, 543 nm; detection, 550–700 nm) fluorescence signals were sampled with sequential excitation-detection to avoid signal crosstalk.
Intravital imaging
Serial intravital kidney imaging was performed using a modified protocol according to Hackl et al.19 A Leica SP8 upright confocal microscope (Leica Microsystems, Wetzlar; Germany) equipped with a Coherent Chameleon 2-photon laser, a resonant scanner, and non-descanned HyD detectors was used. To enable serial imaging, a custom-made kidney holder was employed, and viscous eye gel with a refractive index comparable with that of water was used to immerse a HC FLUOTAR L 25×/0.95 W VISIR objective (Leica Microsystems). Animals were anesthetized using isoflurane, endotracheally intubated, and mechanically ventilated over the whole imaging time. Buprenorphine analgesia was applied before surgery, and animals were placed on a digitally controlled heating plate. An incision in the left flank was performed, and the left kidney was mobilized, fixed in a holder, and covered with immersion liquid. Image acquisition was coupled to animal ventilation via an electronic trigger signal. After imaging, the kidney was repositioned in the abdomen, and the flank was sutured. The excitation wavelength was 910 nm, and eGFP and tdTomato fluorescence were simultaneously imaged using 350 to 474/655 to 780 nm MBS and detector bandpass filters of 525/50 nm and 617/73 nm, respectively.
Statistics
The significance levels were determined using one-way analysis of variance or Student’s unpaired t-test. A P value of <0.05 was considered to be significant. All results are presented as mean ± SD.
Supplementary Material
Most of the bone marrow (BM)-derived renin lineage cells (RLCs) are B lymphocytes. Data are presented as mean ± SD.
Z-stack movie featuring de novo differentiated mT+mG+ RLC in the vascular wall of an afferent arteriole of healthy mRenCre-mT/mG mouse.
Z-stack movie featuring de novo differentiated mT+mG+ RLC in the vascular wall of diseased mRenCre-mT/mG mouse (6 days after induction of reversible mesangial injury).
Z-stack movie featuring de novo differentiated mT+mG+ RLC in the vascular wall of an afferent arteriole of diseased mRenCre-mT/mG mouse (6 days after induction of reversible mesangial injury).
Bone marrow (BM)-derived and labeled renin lineage cells (RLCs) did not become kidney cells 6 months after transplantation. (A) Few BM-derived RLCs are present in the kidney 6 months after bone marrow transplantation (BMTx). (B) BM-derived RLCs in the kidney are positive for the hematopoietic marker cluster of differentiation (CD)45 and are negative for renin. Data are presented as mean ± SD.
Gating of kidney cells for flow cytometry. (A) Representative kidney gate. (B) Necrotic cells (7-aminoactinomycin D; 7-AAD+) comprise 14.5% of the kidney gate (left). Exclusion of the 7-AAD+ necrotic cells does not quantitatively affect the distribution of renin lineage cells (RLCs) (middle) or the rate of neogenesis (right). These findings rule out the possibility that the results are influenced by cell death during the homogenization of kidney tissues to a single-cell suspension for sorting. Data are presented as mean ± SD; n = 11 per group.
Within the mG+ renin lineage cell (RLC) pool, neogenesis declines during kidney development. Data are presented as mean ± SD.
Apoptotic cell death of renin lineage cells (RLCs) in adult mouse kidneys. Considering the persisting neogenesis of RLCs and their constant number in mature kidneys, the question of why RLCs do not increase with age arises (see Figure 5b and c). To address this issue, we screened RLCs for apoptosis using terminal deoxynucleotidyltransferase–mediated dUTP nick end-labeling (TUNEL) staining, followed by confocal microscopy. Kidney slices were costained with Click-iT TUNEL Alexa Fluor 647 Imaging Assay (ThermoFischer, C10247), GFP Tag Polyclonal Antibody (ThermoFischer A-11122) visualized using IgG (H+L) secondary antibody, Alexa Fluor 488 (ThermoFischer A-21206), and 4′,6-diamidin-2-phenylindol (DAPI, nuclear marker). Two representative micrographs of TUNEL-positive RLCs are shown (arrowheads). Bar = 10 µm.
Confocal images of intraglomerular mT+mG+ cells at e16. Bar = 20 µm (or 5 µm in zoomed images).
Within the mG+ renin lineage cell (RLC) pool, the percentage of renin-positive cells declines during kidney development. Data are presented as mean ± SD.
Confocal images of intraglomerular mT+mG+ cells at day 10 after mesangial damage. Bar = 20 µm (or 5 µm in zoomed images).
Antibodies for immunohistochemistry Supplementary material is linked to the online version of the paper at www.kidney-international.org.
Acknowledgments
This work was supported by Deutsche Forschungsgemeinschaft grants TO 679/1–1 and TO 679/2–1 (to VTT) and HU-600/6–1 and HU-600/8–1 (to CH), as well as by Felicitas und Jürgen Grupe Stiftung grant (to CH). The competent technical assistance of Anika Lüdemann and Kathleen Fischer is gratefully acknowledged. We cordially thank Dr. Anja Walther and Silke Tulok from the Core Facility Cellular Imaging (CFCI) at the Medical Faculty Carl Gustav Carus for technical assistance, support, and the use of the facility instruments. We also thank Andreas Linkermann and Florian Gembardt for helpful discussions.
Footnotes
DISCLOSURES
All the authors declared no competing interests.
References
- 1.Castrop H, Hocherl K, Kurtz A, et al. Physiology of kidney renin. Physiol Rev. 2010;90:607–673. doi: 10.1152/physrev.00011.2009. [DOI] [PubMed] [Google Scholar]
- 2.Paul M, Poyan Mehr A, Kreutz R. Physiology of local renin-angiotensin systems. Physiol Rev. 2006;86:747–803. doi: 10.1152/physrev.00036.2005. [DOI] [PubMed] [Google Scholar]
- 3.Sequeira Lopez ML, Pentz ES, Nomasa T, et al. Renin cells are precursors for multiple cell types that switch to the renin phenotype when homeostasis is threatened. Dev Cell. 2004;6:719–728. doi: 10.1016/s1534-5807(04)00134-0. [DOI] [PubMed] [Google Scholar]
- 4.Gomez RA, Chevalier RL, Sturgill B, et al. Maturation of the intrarenal renin distribution in WistarKyoto rats. J Hypertens. 1986;4:S31–S33. [Google Scholar]
- 5.Gribouval O, Gonzales M, Neuhaus T, et al. Mutations in genes in the renin-angiotensin system are associated with autosomal recessive renal tubular dysgenesis. Nat Genet. 2005;37:964–968. doi: 10.1038/ng1623. [DOI] [PubMed] [Google Scholar]
- 6.Takahashi N, Lopez ML, Cowhig JE, Jr, et al. Ren1c homozygous null mice are hypotensive and polyuric, but heterozygotes are indistinguishable from wild-type. J Am Soc Nephrol. 2005;16:125–132. doi: 10.1681/ASN.2004060490. [DOI] [PubMed] [Google Scholar]
- 7.Ruggenenti P, Cravedi P, Remuzzi G. Mechanisms and treatment of CKD. J Am Soc Nephrol. 2012;23:1917–1928. doi: 10.1681/ASN.2012040390. [DOI] [PubMed] [Google Scholar]
- 8.Turner JM, Bauer C, Abramowitz MK, et al. Treatment of chronic kidney disease. Kidney Int. 2012;81:351–362. doi: 10.1038/ki.2011.380. [DOI] [PubMed] [Google Scholar]
- 9.Wuhl E, Schaefer F. Managing kidney disease with blood-pressure control. Nat Rev Nephrol. 2011;7:434–444. doi: 10.1038/nrneph.2011.73. [DOI] [PubMed] [Google Scholar]
- 10.Starke C, Betz H, Hickmann L, et al. Renin lineage cells repopulate the glomerular mesangium after injury. J Am Soc Nephrol. 2015;26:48–54. doi: 10.1681/ASN.2014030265. [DOI] [PMC free article] [PubMed] [Google Scholar]
- 11.Pippin JW, Kaverina NV, Eng DG, et al. Cells of renin lineage are adult pluripotent progenitors in experimental glomerular disease. Am J Physiol Renal Physiol. 2015;309:F341–F358. doi: 10.1152/ajprenal.00438.2014. [DOI] [PMC free article] [PubMed] [Google Scholar]
- 12.Pippin JW, Sparks MA, Glenn ST, et al. Cells of renin lineage are progenitors of podocytes and parietal epithelial cells in experimental glomerular disease. Am J Pathol. 2013;183:542–557. doi: 10.1016/j.ajpath.2013.04.024. [DOI] [PMC free article] [PubMed] [Google Scholar]
- 13.Muzumdar MD, Tasic B, Miyamichi K, et al. A global double-fluorescent Cre reporter mouse. Genesis. 2007;45:593–605. doi: 10.1002/dvg.20335. [DOI] [PubMed] [Google Scholar]
- 14.Hu Y, Li M, Gothert JR, et al. Hemovascular Progenitors in the Kidney Require Sphingosine-1-Phosphate Receptor 1 for Vascular Development. J Am Soc Nephrol. 2016;27:1984–1995. doi: 10.1681/ASN.2015060610. [DOI] [PMC free article] [PubMed] [Google Scholar]
- 15.Sequeira-Lopez ML, Nagalakshmi VK, Li M, et al. Vascular versus tubular renin: role in kidney development. Am J Physiol Regul Integr Comp Physiol. 2015;309:R650–R657. doi: 10.1152/ajpregu.00313.2015. [DOI] [PMC free article] [PubMed] [Google Scholar]
- 16.Belyea BC, Xu F, Pentz ES, et al. Identification of renin progenitors in the mouse bone marrow that give rise to B-cell leukaemia. Nat Commun. 2014;5:3273. doi: 10.1038/ncomms4273. [DOI] [PMC free article] [PubMed] [Google Scholar]
- 17.Desch M, Harlander S, Neubauer B, et al. cAMP target sequences enhCRE and CNRE sense low-salt intake to increase human renin gene expression in vivo. Pflugers Arch. 2011;461:567–577. doi: 10.1007/s00424-011-0956-z. [DOI] [PubMed] [Google Scholar]
- 18.Xiao X, Chen Z, Shiota C, et al. No evidence for beta cell neogenesis in murine adult pancreas. J Clin Invest. 2013;123:2207–2217. doi: 10.1172/JCI66323. [DOI] [PMC free article] [PubMed] [Google Scholar]
- 19.Hackl MJ, Burford JL, Villanueva K, et al. Tracking the fate of glomerular epithelial cells in vivo using serial multiphoton imaging in new mouse models with fluorescent lineage tags. Nat Med. 2013;19:1661–1666. doi: 10.1038/nm.3405. [DOI] [PMC free article] [PubMed] [Google Scholar]
- 20.Lichtnekert J, Kaverina NV, Eng DG, et al. Renin-angiotensin-aldosterone system inhibition increases podocyte derivation from cells of renin lineage. J Am Soc Nephrol. 2016;27:3611–3627. doi: 10.1681/ASN.2015080877. [DOI] [PMC free article] [PubMed] [Google Scholar]
- 21.Little MH, Kairath P. Regenerative medicine in kidney disease. Kidney Int. 2016;90:289–299. doi: 10.1016/j.kint.2016.03.030. [DOI] [PubMed] [Google Scholar]
- 22.Duffield JS, Park KM, Hsiao LL, et al. Restoration of tubular epithelial cells during repair of the postischemic kidney occurs independently of bone marrow-derived stem cells. J Clin Invest. 2005;115:1743–1755. doi: 10.1172/JCI22593. [DOI] [PMC free article] [PubMed] [Google Scholar]
- 23.Kusaba T, Humphreys BD. Controversies on the origin of proliferating epithelial cells after kidney injury. Pediatr Nephrol. 2014;29:673–679. doi: 10.1007/s00467-013-2669-3. [DOI] [PMC free article] [PubMed] [Google Scholar]
- 24.Perry TE, Song M, Despres DJ, et al. Bone marrow-derived cells do not repair endothelium in a mouse model of chronic endothelial cell dysfunction. Cardiovasc Res. 2009;84:317–325. doi: 10.1093/cvr/cvp215. [DOI] [PMC free article] [PubMed] [Google Scholar]
- 25.Schirutschke H, Vogelbacher R, Stief A, et al. Injured kidney endothelium is only marginally repopulated by cells of extrarenal origin. Am J Physiol Renal Physiol. 2013;305:F1042–F1052. doi: 10.1152/ajprenal.00653.2012. [DOI] [PubMed] [Google Scholar]
- 26.Sradnick J, Rong S, Luedemann A, et al. Extrarenal Progenitor Cells Do Not Contribute to Renal Endothelial Repair. J Am Soc Nephrol. 2016;27:1714–1726. doi: 10.1681/ASN.2015030321. [DOI] [PMC free article] [PubMed] [Google Scholar]
- 27.Meyer-Schwesinger C. The role of renal progenitors in renal regeneration. Nephron. 2016;132:101–109. doi: 10.1159/000442180. [DOI] [PubMed] [Google Scholar]
- 28.Gomez RA, Lynch KR, Sturgill BC, et al. Distribution of renin mRNA and its protein in the developing kidney. Am J Physiol. 1989;257:F850–F858. doi: 10.1152/ajprenal.1989.257.5.F850. [DOI] [PubMed] [Google Scholar]
- 29.Jones CA, Sigmund CD, McGowan RA, et al. Expression of murine renin genes during fetal development. Mol Endocrinol. 1990;4:375–383. doi: 10.1210/mend-4-3-375. [DOI] [PubMed] [Google Scholar]
- 30.Kon Y, Hashimoto Y, Kitagawa H, Kudo N. An immunohistochemical study on the embryonic development of renin-containing cells in the mouse and pig. Anat Histol Embryol. 1989;18:14–26. doi: 10.1111/j.1439-0264.1989.tb00576.x. [DOI] [PubMed] [Google Scholar]
- 31.Sauter A, Machura K, Neubauer B, et al. Development of renin expression in the mouse kidney. Kidney Int. 2008;73:43–51. doi: 10.1038/sj.ki.5002571. [DOI] [PubMed] [Google Scholar]
- 32.Sequeira Lopez ML, Pentz ES, Robert B, et al. Embryonic origin and lineage of juxtaglomerular cells. Am J Physiol Renal Physiol. 2001;281:F345–F356. doi: 10.1152/ajprenal.2001.281.2.F345. [DOI] [PubMed] [Google Scholar]
- 33.Barratt J, Feehally J. IgA nephropathy. J Am Soc Nephrol. 2005;16:2088–2097. doi: 10.1681/ASN.2005020134. [DOI] [PubMed] [Google Scholar]
- 34.Morita T, Churg J. Mesangiolysis. Kidney Int. 1983;24:1–9. doi: 10.1038/ki.1983.119. [DOI] [PubMed] [Google Scholar]
- 35.Schlondorff D, Banas B. The mesangial cell revisited: no cell is an island. J Am Soc Nephrol. 2009;20:1179–1187. doi: 10.1681/ASN.2008050549. [DOI] [PubMed] [Google Scholar]
- 36.Johnson RJ, Floege J, Yoshimura A, et al. The activated mesangial cell: a glomerular “myofibroblast”? J Am Soc Nephrol. 1992;2:S190–S197. doi: 10.1681/ASN.V210s190. [DOI] [PubMed] [Google Scholar]
- 37.Wang H, Gomez JA, Klein S, et al. Adult renal mesenchymal stem cell-like cells contribute to juxtaglomerular cell recruitment. J Am Soc Nephrol. 2013;24:1263–1273. doi: 10.1681/ASN.2012060596. [DOI] [PMC free article] [PubMed] [Google Scholar]
- 38.Yo Y, Braun MC, Barisoni L, et al. Anti-mouse mesangial cell serum induces acute glomerulonephropathy in mice. Nephron Exp Nephrol. 2003;93:e92–e106. doi: 10.1159/000069551. [DOI] [PubMed] [Google Scholar]
Associated Data
This section collects any data citations, data availability statements, or supplementary materials included in this article.
Supplementary Materials
Most of the bone marrow (BM)-derived renin lineage cells (RLCs) are B lymphocytes. Data are presented as mean ± SD.
Z-stack movie featuring de novo differentiated mT+mG+ RLC in the vascular wall of an afferent arteriole of healthy mRenCre-mT/mG mouse.
Z-stack movie featuring de novo differentiated mT+mG+ RLC in the vascular wall of diseased mRenCre-mT/mG mouse (6 days after induction of reversible mesangial injury).
Z-stack movie featuring de novo differentiated mT+mG+ RLC in the vascular wall of an afferent arteriole of diseased mRenCre-mT/mG mouse (6 days after induction of reversible mesangial injury).
Bone marrow (BM)-derived and labeled renin lineage cells (RLCs) did not become kidney cells 6 months after transplantation. (A) Few BM-derived RLCs are present in the kidney 6 months after bone marrow transplantation (BMTx). (B) BM-derived RLCs in the kidney are positive for the hematopoietic marker cluster of differentiation (CD)45 and are negative for renin. Data are presented as mean ± SD.
Gating of kidney cells for flow cytometry. (A) Representative kidney gate. (B) Necrotic cells (7-aminoactinomycin D; 7-AAD+) comprise 14.5% of the kidney gate (left). Exclusion of the 7-AAD+ necrotic cells does not quantitatively affect the distribution of renin lineage cells (RLCs) (middle) or the rate of neogenesis (right). These findings rule out the possibility that the results are influenced by cell death during the homogenization of kidney tissues to a single-cell suspension for sorting. Data are presented as mean ± SD; n = 11 per group.
Within the mG+ renin lineage cell (RLC) pool, neogenesis declines during kidney development. Data are presented as mean ± SD.
Apoptotic cell death of renin lineage cells (RLCs) in adult mouse kidneys. Considering the persisting neogenesis of RLCs and their constant number in mature kidneys, the question of why RLCs do not increase with age arises (see Figure 5b and c). To address this issue, we screened RLCs for apoptosis using terminal deoxynucleotidyltransferase–mediated dUTP nick end-labeling (TUNEL) staining, followed by confocal microscopy. Kidney slices were costained with Click-iT TUNEL Alexa Fluor 647 Imaging Assay (ThermoFischer, C10247), GFP Tag Polyclonal Antibody (ThermoFischer A-11122) visualized using IgG (H+L) secondary antibody, Alexa Fluor 488 (ThermoFischer A-21206), and 4′,6-diamidin-2-phenylindol (DAPI, nuclear marker). Two representative micrographs of TUNEL-positive RLCs are shown (arrowheads). Bar = 10 µm.
Confocal images of intraglomerular mT+mG+ cells at e16. Bar = 20 µm (or 5 µm in zoomed images).
Within the mG+ renin lineage cell (RLC) pool, the percentage of renin-positive cells declines during kidney development. Data are presented as mean ± SD.
Confocal images of intraglomerular mT+mG+ cells at day 10 after mesangial damage. Bar = 20 µm (or 5 µm in zoomed images).
Antibodies for immunohistochemistry Supplementary material is linked to the online version of the paper at www.kidney-international.org.


