Abstract
The extent to which the resolution varies within a three-dimensional (3-D) reconstruction, when the diameter of an object is large, is investigated computationally. Numerical simulation is used to model ideal three-dimensional point-spread functions at different radial positions within an object. It is shown that reconstructed density maps are affected less than might have been expected when particles are larger than the depth of field. This favorable outcome is attributed mainly to the fact that a point which lies outside the depth of field relative to the center, for some orientations of the object, will also lie within the depth of field for other orientations. We find, as a result, that the diameter of a particle can be as much as four times the depth of field (as defined by a 90° phase-error criterion) before curvature of the Ewald sphere becomes a limiting factor in determining the resolution that can be achieved.
1. Introduction
High-resolution electron microscopy of unstained biological macromolecules (single-particle cryo-EM for short) has recently made significant advances (Nogales, 2016). Three-dimensional density maps of large macromolecules are now being obtained with a resolution in the range from 3 Å to 4 Å, and in a few cases the resolution has already exceeded 2.5 Å (Banerjee et al., 2016; Bartesaghi et al., 2015; Merk et al., 2016). A fundamental approximation used in this method is that the image intensity is linear in the projected Coulomb potential of the specimen – see, for example, Chapter 4 of (Glaeser et al., 2007). Equivalently, when referring to Fourier space rather than real space, the corresponding approximation is that curvature of the Ewald sphere (DeRosier, 2000) can be neglected.
Validity of the assumed “projection” approximation requires, among other things, that all portions of the specimen are imaged with the same amount of defocus. This only happens, of course, if the size of the object (i.e. its thickness) is much less than the optical depth of field. As a result, the fundamental approximation, i.e. that the image is a projection of the object, is not expected to be useful if the size of the object is similar to, or much greater than, the depth of field.
This issue has been raised in the past, both in the context of very large virus particles (Jensen and Kornberg, 2000; Zhou, 2008) and in the context of smaller particles that are randomly distributed within a certain range of Z-heights, which is determined by the overall ice thickness (Jensen, 2001). It seemed to be paradoxical, for example, that high-resolution, three-dimensional reconstructions were obtained from images of icosahedral virus particles whose diameters are larger than the corresponding depth of field (Grant and Grigorieff, 2015; Liu et al., 2010; Zhang et al., 2010). An often-mentioned resolution of this paradox is that a large number of (symmetry-related) subunits are located at the same Z-height as is the middle of the virus particle. At the same time, it is suggested – reasonably so – that estimation of the defocus value for the image of a virus particle is biased towards the middle, i.e. its center of mass. Thus, if the contrast-transfer-function (CTF) correction for the region near to the middle of a large virus particle is done correctly, a significant amount of signal may be produced from the many subunits whose images have been properly corrected. The suggestion is that this signal can overwhelm the (high-resolution) “noise” contributed by other subunits that lie at Z-heights that are outside the depth of field. Because of this argument, it seemed plausible that the depth of field might be a greater limitation for asymmetric particles than it is for icosahedral virus particles. It thus remains inconclusive that no improvement in the quality of density maps was obtained when computational algorithms were used to compensate for violation of the projection approximation for images of large, icosahedral virus particles (Leong et al., 2010; Wolf et al., 2006).
We now reopen the question by using computational simulations to better understand what limitations to expect when the size of a particle approaches, and even exceeds, the depth of field for a given resolution. The approach that we have taken is to first calculate noise-free, three-dimensional (3-D) reconstructions of “single points” that are located at different distances from the center of an object. The resulting 3-D point-spread functions are then convoluted with high-resolution density maps for atomic models of two peptide structures found in tubulin, the sizes of which are both much smaller than the depth of field for 300 keV electrons at a resolution of 2 Å. In the case of the larger polypeptide structure, the Fourier shell correlation (FSC) function is then calculated between two versions of the map, one located at the center of a particle and the other located at a given distance from the center, designated by the radius, R. The resolution at which this FSC function falls to the commonly used value 0.143 is used as a quantitative measure of the extent to which the resolution of a single-particle cryo-EM structure will be limited solely because of the depth of field.
The results of these simulations suggest that the limitations imposed by the depth of field – ignoring all other factors – are essentially identical to those estimated previously by DeRosier (DeRosier, 2000) when considering the effect of curvature of the Ewald sphere. These limitations are much less severe than might have been expected on the basis of commonly used expressions for the depth of field. As an example, density maps obtained after 3-D reconstruction remain similar to the original object for particles whose diameter is four times the expression for the depth of field used in Equation 2, below. We identify two factors that may contribute to this favorable outcome. (1) It is true that errors are introduced when applying a CTF correction that is appropriate only at the center of a particle. Even so, phase-flipping compensation still produces the right correction at many spatial frequencies where it might not have been recognized to do so. (2) More importantly, because the object has to be viewed in different orientations, every point within a particle must lie, in many of the views, at more or less the same Z-height as does the center of the particle. In other words, every sub-region of a particle will be defocused by the amount specified during CTF correction, for at least some of the images. We propose that both of these effects may serve to mitigate the expected consequences when the diameter of the particle is as much as four times the depth of field.
2. Theory
The resolution at which the Fourier transform of an image remains similar to that of a projection of the object depends upon the object size and the electron wavelength, λ. More specifically, equation 2 in (DeRosier, 2000) states that the square of the resolution, expressed as a spatial frequency, is inversely proportional to the product of λ and the difference in Z-height from top to bottom, t in his notation and δZ in ours. The constant of proportionality,2p in DeRosier’s notation, “depends upon the amount of error one is able to tolerate.” Using the criterion that the average phase error should not exceed 66 degrees, the value of p was found to vary between 0.60 and 0.79 for spheres and cylinders 600 Å in diameter, with lower values being found for thin-walled, hollow objects than for filled ones. Using a value of p ≅ 0.7, for example, a periodic feature of size “d” is expected to be imaged within acceptable error over a range of Z-heights – i.e. a depth of field – equal to
| (1) |
According to equation 1, a resolution limit of d ≅ 3.8Å might be expected for a particle as large at 1000 Å in diameter.
The reason that this estimate seems paradoxical is that it greatly exceeds another estimate of the depth of field, given by
| (2) |
Equation 2 corresponds to the condition that points located at different Z-heights, lying within the range δZ from top to bottom, are imaged with a phase shift (i.e. a wave aberration referred to the Fourier transform of the object) that is 90 degrees or less. According to equation 2, a resolution limit of d ≅ 3.8Å might be expected only for particles smaller than 360 Å in diameter.
3. Methods
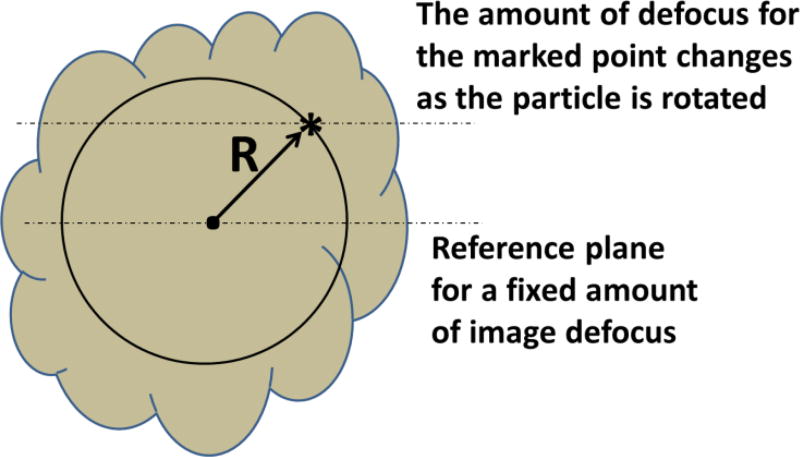
Individual, three-dimensional (3-D) reconstructions were calculated from simulated images of single voxels located at different positions within an extended object. The schematic drawing in Figure 1 uses an asterisk to indicate the position of one such voxel, imagined to be located a distance R from the center of the object. For each such voxel, a single-axis, tomographic series of images was calculated with an evenly spaced angular step of 1 degree between each image. The axis of rotation in this drawing is perpendicular to the page and passes through the center of the object. All images were assumed to be recorded with the center of the object at the same value of defocus, ΔZ. As a result, the actual defocus values for a given voxel in the simulation varied from (ΔZ − R) to (ΔZ + R) as the object was rotated by 360°. Tomographic volumes were calculated for points at radial positions ranging from 0.0 nm to 100 nm. These individual volumes represent different examples of the 3-D point-spread function at various distances from the center of an extended object.
Fig. 1.
Schematic drawing that shows how points within an object are imaged with a constantly changing value of defocus as the object is rotated. It is assumed that the center of the object is the only exception, i.e. the central point is always imaged with the same amount of defocus. An asterisk indicates the position of one such voxel, located a distance R from the center of the object. Faint, dotted lines indicate the Z-height locations of the voxel in question and the center of the object, for a given radial position of the voxel and a given rotation of the object.
Scripts, written in DigitalMicrograph (Gatan, Inc.), were used to simulate how images of a single voxel change as the entire object is rotated about a single axis. The voxel size was taken to be 0.05 nm, as was the corresponding pixel size in the images. The parameters used to model the contrast transfer function (CTF) were ΔZ = 500 nm and λ = 2 pm. In addition, an envelope function was included in these simulations to model the many factors that can be expected to limit the signal beyond a resolution of ~2 Å. For the purposes of what we are interested to learn from the simulations, we assumed that this envelope did not change with the changes in defocus that occur between the top and the bottom of a particle.
The Fourier transforms of all images in a given tomographic series were then modified by “phase flipping”, i.e. multiplying the Fourier transform by −1 at all spatial frequencies where the CTF (contrast transfer function) is negative for a defocus value of ΔZ = 500 nm. This step simulates the usual operation of “CTF correction” that would be made, assuming that it is possible to accurately estimate the value of defocus that corresponds to the center of a particle. The error that is made when performing this “correction”, for images of a given voxel, depends on the radial position of the voxel and the rotation angle for a given image.
Using the simulated, “CTF corrected” images just described, tomographic 3-D reconstructions were computed with the filtered back-projection algorithm provided in Tomo 3-D (Agulleiro and Fernandez, 2011). As indicated previously, the resulting volumes represent 3-D point-spread functions for those portions of a structure that are located at a radius “R”.
4. Results
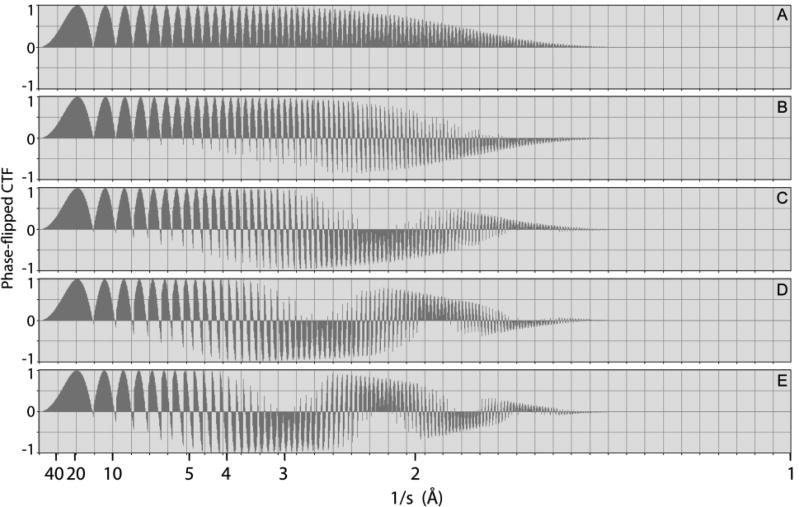
Figure 2 shows how the CTF correction becomes progressively inappropriate as the Z-height of a given point increases relative to the center of an object. CTF correction performed by phase flipping, used here, is perfect (as is shown in panel A) for a point located at the center of the object. When R is 250 Å, however, CTF correction remains valid – in the worst case – only to a resolution of about 3 Å, as is seen in panel B. As R increases further, phase flipping introduces a phase error of 180 degrees over more and more of the Fourier spectrum, as is shown in panel C. For values of R greater than 250 Å, this phase error even begins to affect Fourier components at a resolution as low as 4 Å to 5 Å, but at higher resolution (approaching 2 Å) a new band develops within which the CTF correction is again appropriate, as is seen in panels D, and E. The bands of spatial frequencies at which errors occur are characterized by a slowly oscillating envelope, which depends upon the Z-height within the object. The envelopes seen in the CTFs shown in Figures S1 and S2 of the supplemental material, which are calculated for different defocus conditions, are complementary to the phase-flipped CTF curves shown in Figure 2. The magnitude of the envelope provides a direct representation of the fraction of spatial frequencies for which the sign of the structure factor is, or is not correct after CTF “correction”.
Fig. 2.
Worst-case examples to show how applying a CTF correction with an inappropriate value of defocus results in corruption of the Fourier transform. Shown here are the results of applying a “phase flipping” CTF correction, appropriate for a defocus of 5000 Å, to the Fourier transforms of images recorded with defocus values ranging from 5000 Å to 5500 Å. The radial locations for the respective points within the particle were (A) R = 0 Å, (B) R = 125 Å, (C) R = 250 Å, (D) R = 375 Å, and (E) R = 500 Å. The Nyquist limit in this simulation was at a resolution of 1 Å.
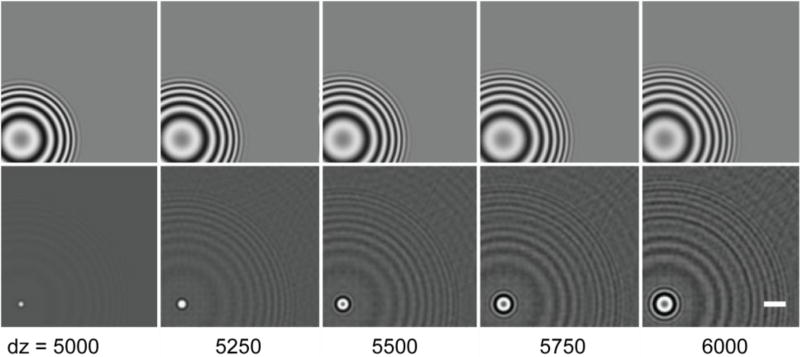
What is important, of course, is what effect such inappropriate CTF corrections, when they do occur, have on the images in a tomographic series. This question is addressed in Figure 3. The top row shows the simulated images obtained at different values of Z-height relative to the center of an object. Because there is already a fairly large amount of defocus for a point at the center of an object, not much difference is seen when the defocus is changed by relatively small, additional amounts. Nevertheless, two effects become immediately apparent when a CTF correction, which is appropriate for a point at the center of the object, is applied to images for points at different Z heights. The width of the intense peak in an image, which is centered on the projected position of the voxel, begins to grow, and the delocalization of the signal – which is so apparent in the raw images, shown in the top row – is no longer restored as effectively to the central peak.
Fig. 3.
Examples to show that making a CTF correction with an inappropriate value of defocus results in imperfect restoration of the image. Upper row: images of a point (i.e. a single-voxel) that were simulated for values of defocus that are specified by the numbers below each column. Lower row: corresponding images obtained after applying the CTF correction that is appropriate for a defocus value of 5000 Å. Scale bar = 10 Å.
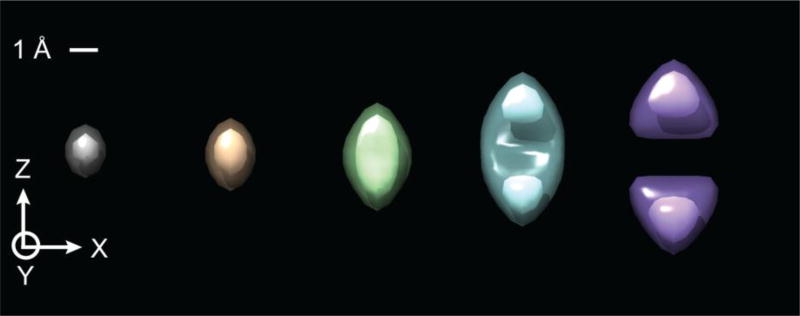
The unavoidable error that is made when applying a single CTF correction to images of points at different Z-heights, is necessarily propagated to the tomographic volume that is reconstructed from those images. As is shown in Figure 4, the 3-D volume reconstructed for a single voxel – in effect, a 3-D point-spread function (PSF) – is increasingly elongated in the Z direction, for points located at an increasing distance, R, from the axis of rotation. In addition, the density at the location of the voxel pinches off and eventually becomes negative, and the PSF becomes dominated by two lobes on either side of the central voxel. This is perhaps not surprising, since the CTF “correction” applied to many of the images, as is seen in Figure 3, introduces one or more (depending upon the amount of defocus) annular zones with many erroneous, negative values at high spatial frequencies.
Fig. 4.
Surface-rendered images of the 3-D point-spread functions that are located at increasing distances from the center of a particle. The examples shown here are for radial distances of 0, 125, 250, 500, and 750 Å, going from left to right, respectively. The outer, semitransparent surface is drawn at 1/3 the peak value, and the inner, solid surface is drawn at 2/3 the peak value.
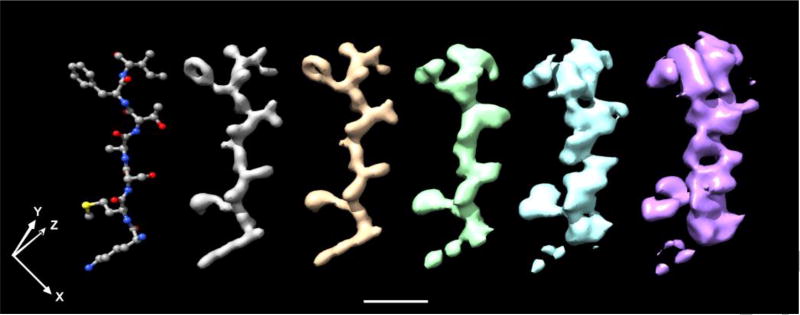
The elongated point-spread functions that are shown in Figure 4 cause a progressive corruption of the 3-D reconstructions of those portions of an object that lie at larger distances, R, from the axis of rotation. As an example, Figure 5 shows the maps produced when the density of a short oligopeptide is convoluted with 5 different point-spread functions that were obtained for different points in an object, corresponding to radial positions up to 750 Å. These are presented only to give a qualitative sense of how the resolution of a map is bound to decrease, but the interpretability less so, the farther a point is from the center. It is worth emphasizing that this example represents the best possible case, in which the defocus value at the center of a particle is known very accurately, and there is no confounding effect from the long tails of the point spread function when it is centered on adjacent atoms other than those of the oligopeptide in question. Figure S3 in the supplemental material shows the maps produced when the density of a much larger portion of the tubulin molecule (PDB ID; 1JFF) is convoluted with the same five point-spread functions. This example is shown only for completeness, to document that the complexity of such a large map makes it difficult to draw quantitative conclusions just by visual inspection.
Fig. 5.
Examples illustrating the progressive degradation of the density map that occurs when it is convoluted with the 3-D point-spread functions shown in Figure 4. The structure of a small portion of the polypeptide chain of tubulin (PDB ID: 1JFF), consisting of the sequence Lys-Met- Ser-Ala-Thr-Phe-Ile, is shown on the left-hand side of this figure. Density maps produced for the same portion of the structure after it has been convoluted with the point-spread functions for points located at radial distances of 0, 125, 250, 500, and 750 Å, going from left to right.
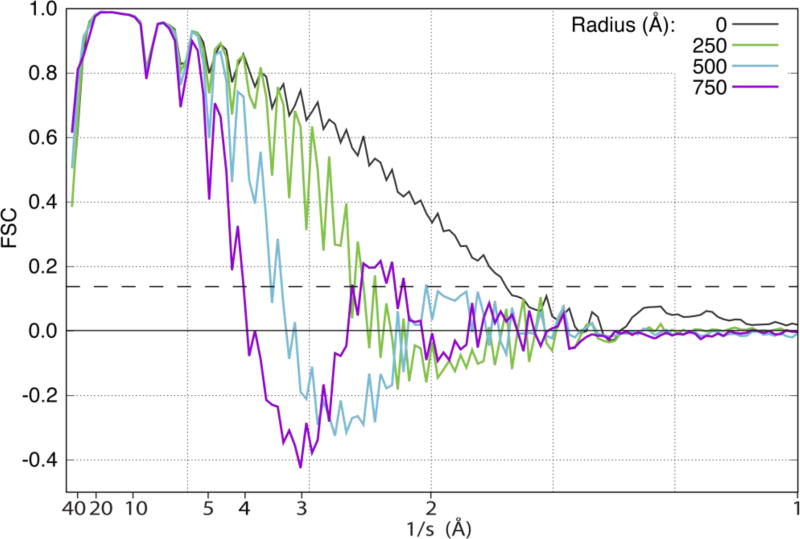
We have thus quantified the progressive corruption of the density for this larger portion of the structure of tubulin by computing the Fourier Shell Correlation (FSC) for maps obtained after convolution with various point-spread functions. The resulting FSC curves are shown in Figure 6. The FSC curve for a protein located at R = 0 falls off with resolution because of the envelope that was intentionally included in the image simulations. In addition, this FSC curve shows ripples due to zeros in the CTF, an effect that is of no interest for this investigation. Apart from an amplification of these ripples, the FSC changes very little when R = 125 Å, corresponding to a particle size (diameter) which is more than twice the value of the depth of field for a resolution of 2 Å. The FSC curve for R = 500 Å falls off more rapidly, however. It now reaches a resolution of only ~3.5 Å at the point where it falls to a value of 0.143, and soon thereafter it becomes negative, indicating an anticorrelation with the correct map at higher spatial frequencies. In addition, the oscillations in the CTF continue to grow, which must be due to the unwanted oscillation in sign that is made when “correcting” the CTF, see Figure 2. When R = 750 Å, the CTF falls to a value of 0.143 at a resolution of ~4 Å, and takes on increasingly negative values, which now become of some concern.
Fig. 6.
FSC curves for simulations that compare the maps for (1) a larger portion of the structure of tubulin located at different values of the radius, R, with (2) the density calculated directly from the coordinates in PDB ID: 1JFF. Results shown here are for maps located at radii of 0, 250, 500, and 750 Å. The dashed horizontal line is drawn at FSC = 0.143.
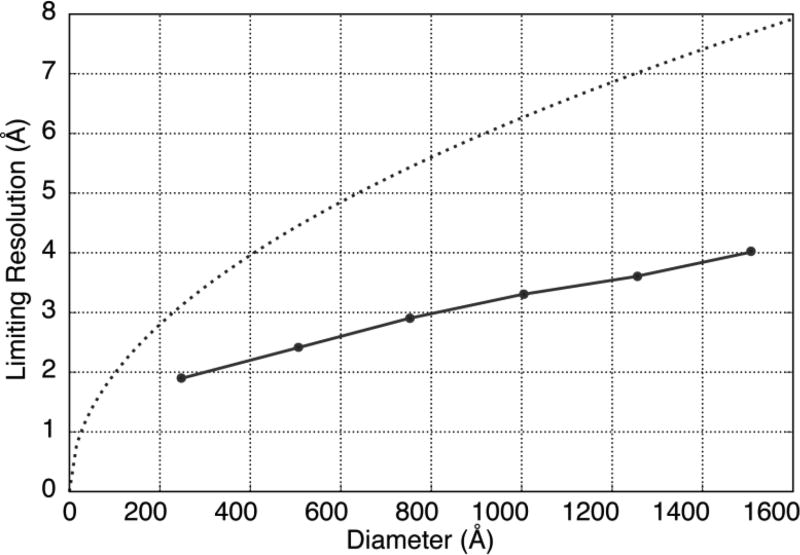
The extent to which the depth of field limits the resolution is summarized in Figure 7, which shows the resolution at which FSC = 0.143, as a function of the radial position within an extended object. For comparison, a curve is shown in Figure 7 for the resolution vs depth of field calculated from equation 1, where δZ was taken to be the diameter, i.e. 2R. This comparison emphasizes that the limit of resolution due to the depth of field is actually much less severe than would be estimated by simply using the value calculated from equation 1. We also point out here that the resolution at which FSC = 0.143 in our simulations is perhaps too pessimistic when the particle radius is 125 Å. That is because the fall-off in FSC then becomes limited by the envelope function that we included in the simulations. We are less interested in this detail, however, than in what happens for larger particles.
Fig. 7.
Two different estimates for the expected resolution limit due to the finite depth of field for 300 keV electrons. The solid line shows values of the resolution at which the local mean-values of the FSC curves, shown in Figure 6, fall to 0.143. For comparison, the dotted curve shows the value of the resolution given by the expression , where λ is the electron wavelength and d is the resolution at which all points within a slab of thickness equal to twice the radius, R, can be considered to be focused to the same degree.
5. Discussion
Our simulations assume that the value of defocus is known at the center of an object, for all images in a data set. In practice, there will be experimental error in estimating this defocus value. In addition, real images are very noisy, and our simulations have not attempted to model that. Finally, it is widely known that other factors, such as errors in the determination of angular orientation as well as increased flexibility of outer features can cause the resolution to decrease with increasing radial position within a structure. As a result, the simulations are presented as a best-case estimate of how well the density map of an object can be recovered from real data. In other words, these simulations are meant only to represent when, and by how much, the recovery of a density map is fundamentally limited by the size of a particle, due to the resolution-dependent depth of field.
Perhaps the most interesting result to emerge from these simulations is that the 3-D density maps shown in Figure 5 and Figure S3 remain “interpretable”, in terms of fitting a polypeptide chain into the density, even when the particle radius, R, is as large as 75 nm. The corresponding diameter of 150 nm is approximately the depth of field, according to the criterion expressed in equation 2, for a resolution of 7.8 Å. In fact, referring to Figure 7, our simulations show that the value of the FSC remains >0.143 to a resolution of ~4.0 Å for the portion of the tomographic volume located at a radius of 75 nm, which is consistent with that part of the map remaining interpretable in terms of fitting the polypeptide chain.
The results of our simulations thus contradict the expectation that an object must be smaller than the value of the depth of field, defined as in equation 2, in order for a 3-D reconstruction to be recovered at a corresponding resolution, d. One factor that no doubt contributes to this favorable result is that CTF correction, when the value of defocus is somewhat different from the correct one, continues to produce correct phase flipping at some spatial frequencies, even though errors are made with increasing frequency. This point is best shown in Figure 2 and the companion figures, Figures S1 and S2.
More importantly, even those points that lie outside the depth of field (as defined in equation 2) with respect to the center of the particle must lie within the depth of field for some other orientations of the object. Put in another way, no point in an object is ALWAYS “out of focus”, with respect to the center of the particle, within the entire data set. We believe that this aspect, inherent to the requirement for a uniform distribution of Euler angles during 3-D data collection, was also reflected in the simulations for cylindrical and spherical objects reported by (DeRosier, 2000). In these numerical calculations, a given point thought to be outside the depth of field, for example one at the top or bottom of the object, was accompanied by other points at the same radius, but at a different vector locations, for example ones lying in planes near the middle of the object. As a result, there can be many structurally equivalent points within a large object, but only a relatively small subset of them will contribute to a phase error, as calculated by DeRosier, due to curvature of the Ewald sphere. The same consideration applies when performing 3-D reconstructions for virus particles, in which icosahedral symmetry is enforced, or for asymmetric reconstructions from data sets of particles with a uniform distribution of views.
The fact that points located at larger radii are “out of focus” with respect to the center of a particle, in at least some of the views, still does have important consequences, of course. These are reflected in a broadening of the point-spread function as the radial position increases, and in a corresponding loss of density at the center of the point-spread function, as is shown in Figure 4. As a result, the achievable resolution decreases at larger radius, as is shown in Figure 7.
Even though the entire map in our simulation remains “interpretable” for an object as large as 150 nm in diameter, the resolution achieved in different parts of the map does deteriorate significantly with increasing radius, as is shown by the curve of FSC vs R in Figure 7. Thus, unless something is done to compensate for curvature of the Ewald sphere at high resolution, the corresponding finite value of the depth of field is expected to limit the resolution (but less so the interpretability) achievable as the particle size increases. As has been mentioned in the Introduction, it has been proposed that computational methods might further compensate for curvature of the Ewald sphere (Leong et al., 2010; Wolf et al., 2006). Nevertheless, it is always better to start with the best possible experimental data, and to rely as little as possible on computational correction of systematic errors.
Two experimental options have, in fact, been proposed to collect data that are not limited by curvature of the Ewald sphere. One option is to use an aperture that blocks one half of the scattered electron wave (Agard et al., 2014), thereby avoiding that structure factors for opposite values of the spatial frequency, but which are not related to one another by Friedel symmetry, get combined to form a single Fourier component of the image intensity. A different option is to further increase the electron energy (Cohen et al., 1984), for example to 3 MeV rather than 300 keV, in order to decrease the curvature of the Ewald sphere and thereby maintain Friedel symmetry at all spatial frequencies. mmc1.docx
Highlights.
Numerical simulation is used to understand the effect depth of field on the resolution of 3-D reconstructions.
Density maps of objects larger than the depth of field are shown to be affected much less than might have been expected.
Surprisingly, the diameter of a particle can be as much as four times the depth of field before curvature of the Ewald sphere becomes a limiting factor for the 3-D density map.
This favorable outcome is partly attributed to the fact that points within an object are not always outside the depth of field relative to the center, depending upon the pose (orientation) of the object.
Acknowledgments
This work was supported in part by NIH grant GM051487-21
Footnotes
Publisher's Disclaimer: This is a PDF file of an unedited manuscript that has been accepted for publication. As a service to our customers we are providing this early version of the manuscript. The manuscript will undergo copyediting, typesetting, and review of the resulting proof before it is published in its final citable form. Please note that during the production process errors may be discovered which could affect the content, and all legal disclaimers that apply to the journal pertain.
References
- Agard D, Cheng YF, Glaeser RM, Subramaniam S. Single-Particle Cryo-Electron Microscopy (Cryo-EM): Progress, Challenges, and Perspectives for Further Improvement. In: Hawkes PW, editor. Advances in Imaging and Electron Physics. Vol. 185. 2014. pp. 113–137. Vol. 185, pp. 113–137. [Google Scholar]
- Agulleiro JI, Fernandez JJ. Fast tomographic reconstruction on multicore computers. Bioinformatics. 2011;27:582–583. doi: 10.1093/bioinformatics/btq692. [DOI] [PubMed] [Google Scholar]
- Banerjee S, Bartesaghi A, Merk A, Rao P, Bulfer SL, Yan Y, Green N, Mroczkowski B, Neitz RJ, Wipf P, Falconieri V, Deshaies RJ, Milne JLS, Huryn D, Arkin M, Subramaniam S. 2.3 angstrom resolution cryo-EM structure of human p97 and mechanism of allosteric inhibition. Science. 2016;351:871–875. doi: 10.1126/science.aad7974. [DOI] [PMC free article] [PubMed] [Google Scholar]
- Bartesaghi A, Merk A, Banerjee S, Matthies D, Wu X, Milne JLS, Subramaniam S. 2.2 Å resolution cryo-EM structure of β-galactosidase in complex with a cell-permeant inhibitor. Science. 2015;348:1147–1151. doi: 10.1126/science.aab1576. [DOI] [PMC free article] [PubMed] [Google Scholar]
- Cohen HA, Schmid MF, Chiu W. Estimates of validity of projection approximation for 3-dimensional reconstructions at high resolution. Ultramicroscopy. 1984;14:219–226. doi: 10.1016/0304-3991(84)90090-1. [DOI] [PubMed] [Google Scholar]
- DeRosier DJ. Correction of high-resolution data for curvature of the Ewald sphere. Ultramicroscopy. 2000;81:83–98. doi: 10.1016/s0304-3991(99)00120-5. [DOI] [PubMed] [Google Scholar]
- Glaeser RM, Downing K, DeRosier D, Chiu W, Frank J. Electron crystallography of biological macromolecules. Oxford University Press; 2007. [Google Scholar]
- Grant T, Grigorieff N. Measuring the optimal exposure for single particle cryo-EM using a 2.6 Å reconstruction of rotavirus VP6. Elife. 2015;4:e06980. doi: 10.7554/eLife.06980. [DOI] [PMC free article] [PubMed] [Google Scholar]
- Jensen GJ. Alignment error envelopes for single particle analysis. Journal of Structural Biology. 2001;133:143–155. doi: 10.1006/jsbi.2001.4334. [DOI] [PubMed] [Google Scholar]
- Jensen GJ, Kornberg RD. Defocus-gradient corrected back-projection. Ultramicroscopy. 2000;84:57–64. doi: 10.1016/s0304-3991(00)00005-x. [DOI] [PubMed] [Google Scholar]
- Leong PA, Yu XK, Zhou ZH, Jensen GJ. Correcting for the Ewald sphere in high-resoluiton single-particle reconstructions. In: Jensen GJ, editor. Methods in Enzymology, Vol 482: Cryo-Em, Part B: 3-D Reconstruction. Vol. 482. 2010. pp. 369–380. pp. 369–380. [DOI] [PMC free article] [PubMed] [Google Scholar]
- Liu HR, Jin L, Koh SBS, Atanasov I, Schein S, Wu L, Zhou ZH. Atomic structure of human adenovirus by cryo-EM reveals interactions among protein networks. Science. 2010;329:1038–1043. doi: 10.1126/science.1187433. [DOI] [PMC free article] [PubMed] [Google Scholar]
- Merk A, Bartesaghi A, Banerjee S, Falconieri V, Rao P, Davis MI, Pragani R, Boxer MB, Earl Lesley A, Milne Jacqueline LS, Subramaniam S. Breaking Cryo-EM Resolution Barriers to Facilitate Drug Discovery. Cell. 2016;165:1698–1707. doi: 10.1016/j.cell.2016.05.040. [DOI] [PMC free article] [PubMed] [Google Scholar]
- Nogales E. The development of cryo-EM into a mainstream structural biology technique. Nat Meth. 2016;13:24–27. doi: 10.1038/nmeth.3694. [DOI] [PMC free article] [PubMed] [Google Scholar]
- Wolf M, DeRosier DJ, Grigorieff N. Ewald sphere correction for single-particle electron microscopy. Ultramicroscopy. 2006;106:376–382. doi: 10.1016/j.ultramic.2005.11.001. [DOI] [PubMed] [Google Scholar]
- Zhang X, Jin L, Fang Q, Hui WH, Zhou ZH. 3.3 Angstrom cryo-EM structure of a nonenveloped virus reveals a priming mechanism for cell entry. Cell. 2010;141:472–482. doi: 10.1016/j.cell.2010.03.041. [DOI] [PMC free article] [PubMed] [Google Scholar]
- Zhou ZH. Towards atomic resolution structural determination by single-particle cryo-electron microscopy. Current Opinion in Structural Biology. 2008;18:218–228. doi: 10.1016/j.sbi.2008.03.004. [DOI] [PMC free article] [PubMed] [Google Scholar]


