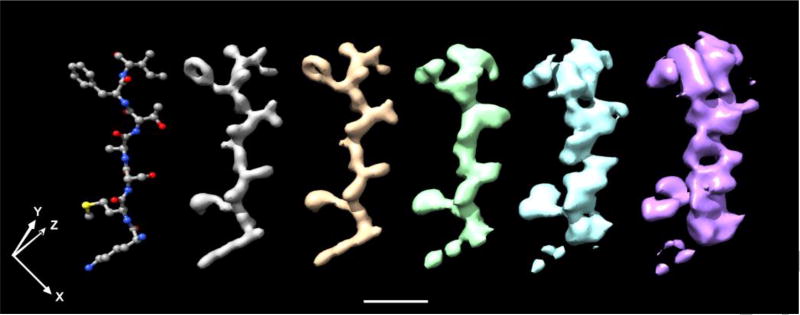
Fig. 5.
Examples illustrating the progressive degradation of the density map that occurs when it is convoluted with the 3-D point-spread functions shown in Figure 4. The structure of a small portion of the polypeptide chain of tubulin (PDB ID: 1JFF), consisting of the sequence Lys-Met- Ser-Ala-Thr-Phe-Ile, is shown on the left-hand side of this figure. Density maps produced for the same portion of the structure after it has been convoluted with the point-spread functions for points located at radial distances of 0, 125, 250, 500, and 750 Å, going from left to right.

