

Abstract
Fetal alcohol spectrum disorder (FASD), caused by gestational ethanol (EtOH) exposure, is one of the most common causes of non-heritable and life-long mental disability worldwide, with no standard treatment or therapy available. While EtOH exposure can alter the function of both neurons and glia, it is still unclear how EtOH influences brain development to cause deficits in sensory and cognitive processing later in life. Microglia play an important role in shaping synaptic function and plasticity during neural circuit development and have been shown to mount an acute immunological response to EtOH exposure in certain brain regions. Therefore, we hypothesized that microglial roles in the healthy brain could be permanently altered by early EtOH exposure leading to deficits in experience-dependent plasticity. We used a mouse model of human third trimester high binge EtOH exposure, administering EtOH twice daily by subcutaneous injections from postnatal day 4 through postnatal day 9 (P4–:P9). Using a monocular deprivation model to assess ocular dominance plasticity, we found an EtOH-induced deficit in this type of visually driven experience-dependent plasticity. However, using a combination of immunohistochemistry, confocal microscopy, and in vivo two-photon microscopy to assay microglial morphology and dynamics, as well as fluorescence activated cell sorting (FACS) and RNA-seq to examine the microglial transcriptome, we found no evidence of microglial dysfunction in early adolescence. We also found no evidence of microglial activation in visual cortex acutely after early ethanol exposure, possibly because we also did not observe EtOH-induced neuronal cell death in this brain region. We conclude that early EtOH exposure caused a deficit in experience-dependent synaptic plasticity in the visual cortex that was independent of changes in microglial phenotype or function. This demonstrates that neural plasticity can remain impaired by developmental ethanol exposure even in a brain region where microglia do not acutely assume nor maintain an activated phenotype.
Keywords: microglia, ethanol, fetal alcohol spectrum disorder, mouse model, synaptic plasticity, in vivo two-photon microscopy, transcriptome
Introduction
1.1 Alcohol and pregnancy: visual system deficits in offspring
Fetal alcohol spectrum disorder (FASD) is one of the leading non-heritable causes of life-long mental disability, affecting 2–5% of babies born in the United States alone (May et al., 2014). Currently, no pharmacological treatments for FASD exist. While no amount of ethanol (EtOH) exposure during gestation is considered safe, the extent and timing of exposure are known to influence the severity of symptoms (Sokol et al., 2003). Many FASD patients struggle with a range of critical skills, from attention, learning and memory, and impulse control, to motor coordination and other sensory functions, including hearing and vision processing (Doney et al., 2016; Mattson et al., 1999; Mattson and Riley, 1999; Stephen et al., 2012; Streissguth et al., 1994). Early EtOH exposure can cause vision deficits by two broad mechanisms: 1) damaging eye morphology itself so that visual information cannot be received properly and/or 2) altering how regions within the brain, such as the visual cortex, are able to process the visual information received. For example, it is known that developmental EtOH exposure can lead to optic nerve hypoplasia, a morphological abnormality in the structure of the eye that can underlie refractive errors in vision such as far-sightedness (Pang et al., 2015; Stromland, 1987, 2004). FASD patients can also have other difficulties with visual perception, including poor visual acuity, amblyopia-like (‘lazy eye’) deficits, and reduced sensitivity to contrast, which are thought to be related to some abnormality in the cortical architecture within the brain (Doney et al., 2016; Vernescu et al., 2012).
This current study began by exploring potential deficits in visual system function after early EtOH exposure in the context of ocular dominance plasticity (ODP). Scientists have an in depth understanding of factors underlying ODP in many mammalian models, knowledge that has informed treatment of amblyopia in humans. First discovered by Hubel and Wiesel (Wiesel and Hubel, 1963), ODP is a model of experience-dependent plasticity that occurs within the binocular visual cortex, a region of visual cortex where neurons receive inputs from both eyes. In the absence of experimental manipulation to alter visual experience in the mouse, binocular neurons have an ocular dominance preference, responding more strongly to stimulation of the contralateral eye compared to stimulation of the ipsilateral eye. However, this ocular dominance can be shifted away from contralateral eye dominance by reducing that eye’s visual experience. During the visual critical period in the mouse (which peaks at postnatal day 28 (P28)), monocular deprivation (MD) of the contralateral eye results in a shift away from contralateral eye dominance toward ipsilateral eye dominance that occurs in two phases. 1–4 days of MD (the first, early phase) normally results in a loss of neuronal responses to the closed eye (contralateral) via a long term depression (LTD) mechanism (Frenkel and Bear, 2004). 4–7 days of MD (the second, late phase) promotes increased neuronal responsiveness to the open eye (ipsilateral) via either a long term potentiation (LTP) (Frenkel and Bear, 2004) or homeostatic mechanisms (Mrsic-Flogel et al., 2007). In wildtype mice, 7 days of MD is sufficient to induce maximal ocular dominance shifts (Frenkel and Bear, 2004). By investigating how developmental EtOH exposure may impair ODP after different durations of deprivation, we can better understand how EtOH interferes with plasticity. 1.2 Shifting focus to ethanol’s effects on microglia.
Extensive literature has shown that EtOH can cause neurons in particular brain regions to undergo rapid apoptotic cell death (Idrus and Napper, 2012; Ieraci and Herrera, 2006; Ikonomidou et al., 2000; Olney et al., 2002a; Olney et al., 2002b; Wozniak et al., 2004). More recently, focus has shifted onto the potential impacts of developmental EtOH exposure on glial cells, including astrocytes, oligodendrocytes, and microglia. In general, it is hypothesized that with extensive EtOH-induced neuronal damage, glial cell functions may be derailed both short-term and permanently, resulting in a brain environment that is not adequately protective of neuronal health, network communication, and plasticity throughout life.
We chose to focus on microglial functions after developmental EtOH exposure because of the many diverse and complex roles that these cells play, from being ‘immune sentinels’ that can detect and resolve insults in the diseased brain to also being ‘gardeners’ that can selectively prune synaptic connections and support neuronal health under physiological conditions (as reviewed by (Hughes, 2012; Rohan Walker and Yirmiya, 2016; Tremblay et al., 2011; Wong et al., 2017). Currently, a body of work suggests that microglial immune functions may be triggered by high binge levels of EtOH exposure. These studies are diverse in their timing of EtOH exposure, and include rodent models of high binge EtOH exposure during the human third trimester equivalent (Ahlers et al., 2015; Boschen et al., 2016; Drew et al., 2015; Kane et al., 2011) or adolescence (McClain et al., 2011), as well as post mortem examination of human brain tissue after a lifetime of alcoholism (He and Crews, 2008). Some signs of microglial immune-activation that have been reported in these studies include thickening and shortening of microglial processes, increasing cell body size, increasing prevalence of microglia with amoeboid morphology, higher expression of phagocytic proteins within microglia, and clustering of microglia specifically in areas were cell death has occurred. Notably, while the effects on developmental EtOH exposure on acute changes to the immune functions of microglia have been a primary research focus, fewer studies have investigated the impacts of early EtOH exposure on microglia long-term, and to our knowledge, have not specifically designed studies to determine whether and to what extent the dynamic and physiological functions of microglia may be perturbed.
1.3 Study hypothesis and summary
There are several key reasons behind our hypothesis that lasting changes to both immune and physiological functions of microglia in the visual cortex could underlie deficits in visually-driven experience-dependent ocular dominance plasticity. First, the ability of microglia to rapidly respond to cellular damage makes it likely that microglia react, either directly to EtOH exposure, or indirectly to EtOH-induced neuronal injury (Ahlers et al., 2015). Second, microglia are long-lived cells that migrate into the central nervous system (CNS) early in embryonic development, and which are replenished at very low rates from local populations within the CNS (Ginhoux et al., 2010). This implies that the microglia exposed to EtOH developmentally are likely many of the same microglia present later in life. Third, in the healthy mouse brain, microglia contact synapses, affecting the trajectory of synapse development (Miyamoto et al., 2016) and neural network remodeling throughout life (Paolicelli et al., 2011; Tremblay et al., 2010; Wake et al., 2009). Fourth, microglia are critical for normal ODP, as inhibiting the function of a receptor specifically expressed by microglia in the brain (P2RY12) either genetically or pharmacologically, prevents ODP (Sipe et al., 2016). In sum, these characteristics suggest that microglia may be susceptible to EtOH and that EtOH-driven microglial dysfunction may contribute to long-term deficits in plasticity.
In this study, we used a mouse model of developmental EtOH exposure that resulted in reductions in ODP in early adolescence (Lantz et al., 2015; Lantz et al., 2012). To understand whether microglia contribute to this ODP defect, we conducted an extensive analysis of microglial phenotypes in early adolescent animals after developmental EtOH exposure. We found that microglial density, distribution, morphology, dynamic in vivo motility, phagocytic protein expression, and whole transcriptome level gene expression, all surprisingly showed no detectable effect of prior developmental EtOH exposure. Rather, there was a trend toward a difference in the pathological response of microglia to tissue injury, suggesting that a secondary challenge could uncover subtle alterations in microglial immune function. Our results suggest that microglia in the visual cortex are relatively resilient to developmental EtOH at exposure levels that induce deficits in experience-dependent plasticity, and therefore such plasticity impairment can exist in the absence of gross alterations in microglial behavior.
Materials and Methods
2.1 Animals
All studies were performed in strict accordance with the University of Rochester Committee on Animal Resources and abided by National Institutes of Health Guidelines. All mice were bred in-house on a C57BL/6 background and exposed to 12 hours of light and 12 hours of dark (6AM lights on). Chow and water were provided ad libitum. Breeding pairs were checked daily for the birth of pups, considered postnatal day 0 (P0). The male was separated from the dam and pups on P0. Litters smaller than n=4 pups were excluded.
On P4, littermates were toe-clipped for identification and semi-randomly assigned to one of three groups: separation control (SEP), saline injected control (SAL), or ethanol treated (EtOH). In some cases, two or more pups from each litter were allocated to the same experimental condition, but efforts were made to achieve an even male/female balance, with consistent initial mean weight of pups in each group. In the RNA-seq experiment, only male mice were included. Animals were weighed once just before dosing and treated daily from P4–P9 with two subcutaneous (s.c.) injections of 1.8g/kg EtOH (Fig. 1A), delivered in 20% v/v 200 proof ethanol in saline (0.9% NaCl). S.c. administration was chosen for several reasons: 1) it is well tolerated by early postnatal pups relative to oral gavage/intubation methods (Dursun et al., 2013) 2) it allows for littermate controls not exposed to EtOH and 3) dams were not exposed to EtOH, as would have been necessary using a vapor exposure method (Morton et al., 2014). The two daily s.c. injections were separated by a two hour interval in order to achieve blood and brain EtOH concentrations ≥ 250mg/dL 90 minutes after the second injection on both P4 and P9. SAL pups were injected with a volume of saline equal to the volume of a 1.8g/kg EtOH dose at the two dosing time points per day. SEP pups were weighed and removed from the parent cage for the same amount of time at the same dosing intervals as the SAL and EtOH pups, but were not injected. For NeuN experiments only, two s.c. injections of 2.5g/kg EtOH (20% v/v in saline) were given two hours apart daily from P4–P9, resulting in blood and brain EtOH concentrations ≥ 400mg/dL 90 minutes after the second injection on P4 and P9. For all studies, each pup was only separated from the dam and the rest of the litter for the time needed for injection (no more than 2 minutes per animal). Animals from at least 3 unique litters were included in each experimental group for each experiment. All data collection and analysis was done blind to exposure group.
Fig 1.
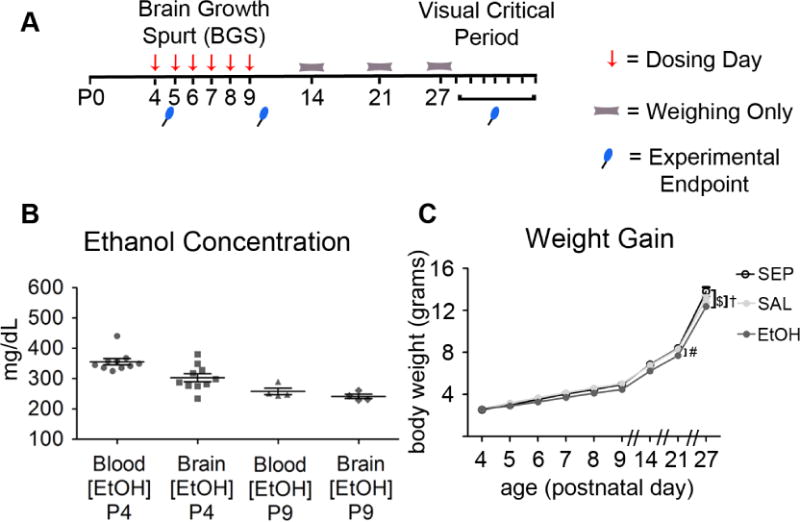
Evaluation of the BGS EtOH exposure mouse model. (A) Timeline of dosing and experimental endpoints. (B) Blood and brain EtOH concentrations were measured 90 minutes after the second 1.8g/kg s.c. dose on postnatal day 4 (P4) (n=10) and P9 (n=4), the first and last days of EtOH exposure. Individual dots indicate individual animals, with both blood and brain EtOH concentrations measured from each animal. In rodent models, blood EtOH concentrations at or above 250mg/dL are indicative of high binge level exposure. (C) Body weights of SEP, SAL, and EtOH male and female C57BL/6 mice at different ages, were compiled from a subset of experimental animals (n= 12 SEP, n= 26 SAL, n= 34 EtOH). There was a main effect of exposure group on body weight over time (two-way ANOVA repeated measures, F(2,69)= 6.09, p= 0.0037). Bonferroni post-hoc comparisons showed significant differences in weight only on P21 (SAL vs. EtOH #= p<0.05) and P27 (SAL vs. EtOH †= p<0.01; SEP vs. EtOH $= p<0.001). Graphs show mean ± SEM.
To assess the level and consistency of blood and brain alcohol concentrations achieved, 90 minutes after the second injection on P4 or P9, a subset of EtOH pups were sacrificed by decapitation. Whole trunk blood (minimum of 25μL) and brain were collected, immediately frozen on dry ice and stored at −80°C until analysis by gas chromatography (Hewlett Packard 5890 series II, Wilmington, DE) as described in (Ramirez et al., 2011).
2.2 Monocular deprivation (MD)
SEP, SAL, or EtOH animals were separated into non-deprived (ND), 4 day monocularly deprived (4D MD) or 7D MD groups upon weaning on P21. On P28 ± 2 days, mice from the MD groups were anesthetized using isofluorane (5% induction, 3% maintenance) and the top and bottom eyelids of the right eye were cut. TobraDex ointment (tobramycin 0.3%) was applied to both eyes to prevent drying and infection. The right eyelid was sealed using two mattress sutures (Ethicon J303H Guaynabo, Puerto Rico) (Sipe et al., 2016). Deprivations were done blinded to EtOH exposure status.
2.3 Intrinsic optical signal (iOS) imaging
Animals were anesthetized with isoflurane (5% induction, 3% maintenance) and temperature was maintained at 37°C using the TC-1000 temperature controller system (MEAS, Dayton, OH). Eyes were inspected and sutures were removed from 4D MD or 7D MD animals to reopen the right eye. Mice were excluded from the experiment if any damage to either eye was detected or the suturing failed to keep the right eye completely closed. Silicone oil (Sigma 378429) was applied repeatedly throughout surgery to keep both right and left eyes moist. The skull over contralateral (left) visual cortex was exposed, a custom made rectangular metal head plate was glued onto the midline suture, and an approximately square area encompassing binocular visual cortex was filled with 0.5% agarose and sealed with a coverslip. The muscle relaxant chlorprothixene hydrochloride (11 mg/kg, i.p.; Sigma C1671) was administered ~15 minutes prior to the start of iOS imaging. The total length of this surgery was kept to ≤35 minutes.
iOS imaging was completed as previously described (Lowery et al., 2017; Sipe et al., 2016). A white horizontal square-wave bar grating moving upward (90°) or downward (270°) on a black background was presented 30 cm in front of the animal’s eyes. The skull was illuminated with 550nm light to identify vasculature and a region of interest (ROI) containing binocular visual cortex was selected. A DALSA 2M30 CCD camera was used to collect reflected 700nm light during stimulus presentation to each eye separately in continuous cycles for 6 minutes. Ocular dominance indices (ODI) were computed offline in Matlab, using the amplitude of the fast Fourier transform component of the intrinsic signal. ODI = (average contralateral response – average ipsilateral response)/(average contralateral response + average ipsilateral response).
2.4 Histology
Animals were euthanized with an overdose of sodium pentobarbital (Euthasol, Virbac, St. Louis, MO) and transcardially perfused with 0.1M phosphate buffer saline (PBS pH 7.4) at room temperature (RT) followed by ice cold 4% paraformaldehyde (PFA made in 0.1M PB pH 7.4). (A subset of brains from P28 mice were used for blinded measurement of whole brain weight, done directly after perfusion, once olfactory bulb and brainstem were removed). Following a 4–5 hour post-fix in 4% PFA at 4°C, brains were cyroprotected in a 10% sucrose 0.2M PB solution for 24 hours at 4°C, and then a 30% sucrose 0.2M PB solution at 4°C for an average of 20 days prior to tissue sectioning. 50μm coronal sections were cut using a freezing microtome (Microm; Global Medical Instrumentation, Ramsey, MN) and stored in cryoprotectant (25% 0.2M PB, 25% glycerol, 30% ethylene glycol, 20% ddH2O) at 4°C until immunohistochemistry was performed.
In brief, at RT, sections were rinsed in 0.1M PBS and incubated in a methanol/hydrogen peroxide block and bovine serum albumen (BSA) block. Sections of visual cortex containing V1b (binocular primary visual cortex) were incubated in primary antibody solution for 48 hours at 4 C° on a shaker in a humidified chamber (anti-IBA-1 1:2500, Wako 019-19741; anti-CD68 1:800, Abcam ab31630l, antiNeuN, 1:250, Millipore MAB377; anti-parvalbumin 1:10,000, Swant PV-28), followed by 3 washes in 0.1M PBS at RT and 4 hour RT shaking incubation in secondary antibody solution (Alexa-Fluor 488 or 594, 1:500, Invitrogen, A21206 or A21203 respectively). Sections were mounted and coverslipped using prolong gold mounting media (Molecular Probes P36934). IBA-1 (ionized calcium-binding adaptor molecule 1) is a microglial specific marker in the CNS and is also known as AIF-1 (allograft inflammatory factor 1). CD68 is a marker of phagocytic activity known to be expressed by activated microglia (as reviewed by (Fu et al., 2014)). NeuN antibody labels adult neuron cell bodies, while parvalbumin antibody labels a subset of GABAergic inhibitory interneurons.
2.5 Fixed tissue imaging and analysis
Imaging and analysis were performed blind to treatment. In all experiments, layer II/III of V1b was identified and imaged using a Zeiss LSM 510 confocal microscope (Carl Zeiss, Thornwood, NY) unless otherwise specified. C57BL/6 mice were used, unless otherwise specified. Only microglia with processes falling entirely within the imaged area were included. Random selection of microglia for morphology analyses was performed by numbering all the microglia and using a random number generator to pick a subset for analysis.
2.5.1 Microglia density and distribution
Z stacks of P10 or P28 tissue were collected at 20× at a step size of 3μm from 2 slices per animal. For analysis done offline in ImageJ and Matlab, 8 z planes were compressed into a maximum intensity projection. The total number of microglia per image was counted. The Nearest Neighbor index (NN) was calculated as NN= (mean distance)2(density) where mean distance was the average distance in mm of the nearest microglial cell body for all microglia in the image (Lowery et al., 2017).
2.5.2 Cortical thickness
V1b-containing cortical sections from the same cohort of animals in 2.5.1 were used for P10 and P28 cortical thickness measurements. For this analysis, 4× brightfield images were taken using an Olympus BX51 microscope integrated with a Spot Pursuit digital camera and Spot Advanced software (Sony), to capture all cortical layers in one image. In ImageJ, cortical thickness was measured at three random locations per image using the line tool and measure functions. Lengths from each section were averaged and two sections per animal were analyzed to generate a single cortical thickness value for each animal.
2.5.3 Microglial process arbor area and circularity
The same sections as in 2.5.1 were imaged at 40× using a 1μm step size. In ImageJ, 20 z planes were compressed into a maximum intensity projection. 5 randomly selected microglia were outlined using the ‘polygon’ tool, connecting the distal process tips to measure the area within as the Arbor Area. A Circularity Index (CI) was calculated as (Process Long − Process Short) / (Process Long + Process Short), with Process Long defined as the longest axis of the microglial arbor and Process Short defined as the axis perpendicular to Process Long. Both axes were drawn through the center of the cell body. The more circular the microglia, the closer the CI was to 0. Similar methods of quantifying microglial arbor area and circularity have been reported by our laboratory (Lowery et al., 2017; Tremblay et al., 2012).
2.5.4 Microglial branching complexity
Sholl Analysis was used to determine the number of microglial process intersections with concentric circles drawn at increasing distances from the cell body center (Lowery et al., 2017; Sipe et al., 2016). 40× Z stacks were collected using a 1μm step size. 16 Z planes were projected into a maximum intensity image. One ROI each from 3 slices per animal were imaged and results averaged. In ImageJ, 5 randomly selected microglia per image were thresholded, binarized, and analyzed by an automated Sholl Analysis plugin (developed by the Anirvan Ghosh laboratory http://labs.biology.ucsd.edu/ghosh/software/). A separate cohort of animals was used for this experiment as compared to experiments described in 2.5.1, 2.5.2, 2.5.3, and 2.5.5.
2.5.5 CD68 expression
Analysis at P10 and P28 was completed on images of the same ROIs as 2.5.1, as sections were co-labeled with IBA-1 (Alexa Fluor 488) and CD68 (Alexa Fluor 594). 20× Z stacks of both channels were taken with a 3μm step size from two V1b slices per animal. In order to quantify the percentage of IBA-1 positive area (area within microglia) that also contained any positive level of CD68 expression, the same 4 z planes were compressed into maximum intensity projections for each channel in ImageJ. The IBA-1 and CD68 maximum intensity projections were both thresholded and binarized. We then calculated the percentage of microglial area occupied by CD68 staining for each ROI. Values for each animal were an average of percentages quantified for two slices per animal.
2.5.6 P5 microglial density
Cx3cr1-Heterozygous eGFP mice were dosed according to the 1.8g/kg × 2 paradigm only on P4 and transcardially perfused on P5, 24 hours after second EtOH exposure on P4. After coronal sectioning and mounting of sections containing V1b using ProLong Gold + DAPI (Molecular probes P36931), 10× epifluorescent images containing all layers of cortex were collected (microglia (green) and nuclei (blue)) using an Olympus BX51 microscope integrated with a Spot Pursuit digital camera and Spot Advanced software (Sony). One ROI per slice from 3 slices per animal were analyzed for cortical layer specific microglial density. Using the DAPI as a guide, layers II/II, IV, and VI were outlined in ImageJ using the polygon tool, and encompassed area was measured. The paintbrush tool was used to mark each microglial cell body. Density per region was calculated as # microglia/area in mm2.
2.5.7 Neuronal Density
20× Z stacks of NeuN staining were collected at a 3μm step size. 2 slices per animal were imaged. In ImageJ, 9 z planes were compressed into a maximum intensity projection. The ‘polygon’ tool was used to outline layer II/III of V1b on the max intensity projection image and NeuN cell bodies within this area were counted for density analysis.
2.5.8 Parvalbumin positive (PV+) inhibitory interneuron density
20× Z stacks of the PV and NeuN channels were collected at a 3μm step size from 2 slices of V1b per animal. In ImageJ, 4 z planes were compressed into maximum intensity projections. Using the NeuN max projection image, an ROI encompassing layers II through VI was selected and the number of PV+ cell bodies was counted within this ROI for density calculation.
2.6 In vivo imaging using two-photon microscopy
Cx3cr1-Heterozygous eGFP mice (Jung et al., 2000) in which microglia express GFP, were used for in vivo imaging as in (Lowery et al., 2017; Sipe et al., 2016). A custom two-photon laser-scanning microscope (Ti:Sapphire, Mai-Tai, Spectraphysics; modified Fluoview confocal scan head, 20× lens, 0.95 numerical aperture, Olympus) was used. Two-photon excitation was accomplished with 100- femtosecond pulses (80 Mhz) at 920nm using 40mW of power measured at the sample after the objective lens. A 580/180 filter was used to capture GFP emission. Early adolescent mice (range P27–P35) were anesthetized with an i.p. injection of fentanyl cocktail, containing 0.05 mg/kg fentanyl, 5.0 mg/kg midazolam, and 0.5 mg/kg dexmetatomadin. Throughout surgery and imaging, body temperature was maintained at 37°C and TobraDex ointment was applied to the eyes to prevent drying. The skull over the left visual cortex was exposed and attached to a metal head plate. A fine dental drill was used to thin the skull over visual cortex, as previously described (Kelly and Majewska, 2010). Imaging in layer I/II of V1 was done at 4× digital zoom and 1μm step size using an 800 × 600 pixel frame size in Fluoview v5.0 software (Olympus). Images were collected every 5 minutes for 55 minutes to assess baseline microglial motility. Tissue injury was induced by performing a 9 second point scan at 780nm, setting power to 900mW (at the periscope) over the center of a microglial cell body positioned in the center of the frame. Time-lapse imaging resumed at 920nm 1 minute after the end of the point scan and Z stacks at 4× digital zoom and 1μm step size were collected every 5 minutes for 55 minutes.
2.7 Analysis of microglial dynamics
For motility analyses (Lowery et al., 2017; Sipe et al., 2016), shown in Fig. 5, 10μm in the center of each collected Z stack were maximally projected in ImageJ for each of the 12 time points from 0 to 55 minutes. Motion artifact in the X and Y directions was corrected using the StackReg and TurboReg functions (http://bigwww.epfl.ch/thevenaz/stackreg/). After thresholding and binarizing of the maximum intensity projections from all time points together, RGB overlays of consecutive time points (0–5 minutes, 5–10 minutes, etc.) were made so that red pixels represented retraction, green pixels represented extension, and yellow pixels represented stability. A custom Matlab algorithm was used to calculate the number of red, green, and yellow pixels in each of the RGB overlays and the following indices were calculated for each RGB overlay from the imaging session and then averaged to generate a single value of each of the indices for each animal. Motility index (MI) = (# red pixels + # green pixels)/(# yellow pixels), extension index (EI) = (# red pixels)/(# yellow pixels), and retraction index (RI) = (# green pixels)/(# yellow pixels).
Fig 5.
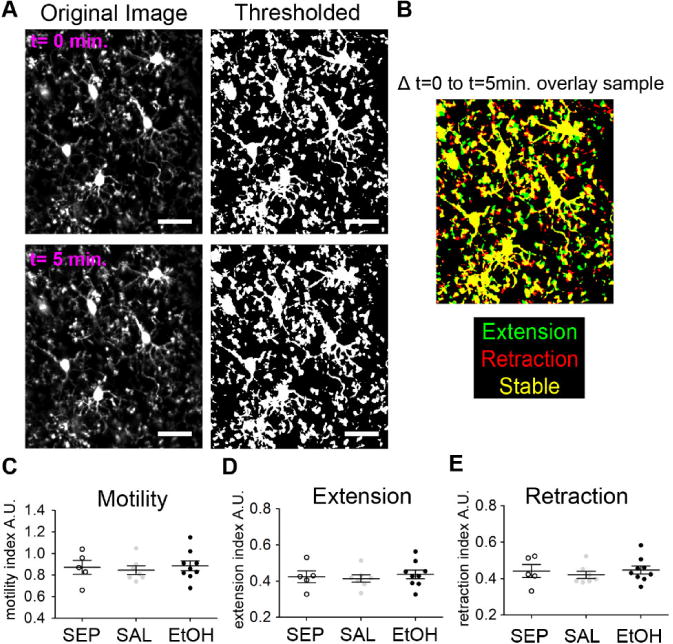
Basal microglial motility in early adolescent visual cortex is not altered by developmental EtOH exposure. (A) Sample processing of in vivo two-photon images of microglia in P28 visual cortex to assess microglial motility. Time-lapse images were taken every five minutes for one hour. Thresholded and binarized consecutive images were then overlaid to generate images shown in (B) where yellow = stable regions, green = extension, and red = retraction. (C) Motility index (MI) for each animal was calculated as the average MI = green pixels + red pixels/yellow pixels for each of the consecutive overlaid images across the hour of imaging. (D)– (E) For the same animals, an extension index (EI) and a retraction index (RI) were calculated as EI = green pixels/ yellow pixels and RI = red pixels/ yellow pixels, respectively. Microglial motility, proportion extension, and proportion reaction were not significantly different among early adolescent SEP, SAL, and EtOH mice (one-way ANOVA). Dots represent individual animals with n=5 SEP, n=7 SAL, and n=9 EtOH animals included in this study. Scale bar = 25μm. Graphs show mean ± SEM.
For laser ablation analysis (Fig. 6D), the initial steps through thresholding of the maximum projection Z stacks together were done as described above, using Z stacks (1μm step) collected every 5 minutes for 55 minutes, starting one minute after injury induction. Circles with diameters exactly 1.75× and 3.0× the diameter of the injury core were drawn centered around the core center. Ablation response over time is R(t) = (Rx(t) − Rx(0))/Ry(0) (Davalos et al., 2005; Lowery et al., 2017; Sipe et al., 2016). Rx(t) was calculated at each time point as the number of pixels containing microglial processes in the inner donut created by the 1.75× circle with the ablation core removed. Ry(0) was calculated as the number of pixels containing microglia at the first time point in the outer donut created by the 1.75× circle being removed from the 3.0× circle.
Fig 6.
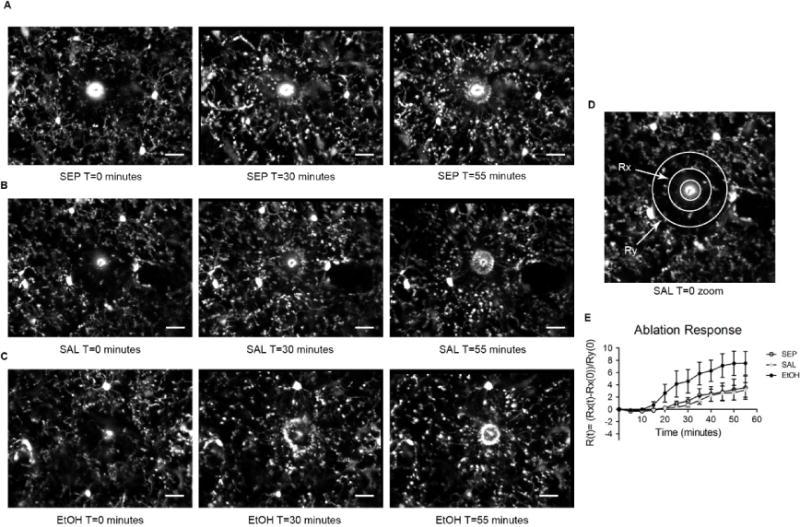
Early adolescent microglia may have more robust responses to tissue injury after BGS EtOH exposure. Representative in vivo two-photon images of P28 visual cortex microglia in (A) SEP (B) SAL, and (C) EtOH animals responding to a focal tissue injury (bright circular core), induced by laser ablation 1 minute prior to the T=0 minute time point. Processes from surrounding microglia hone to the injury site over time. (D) Schematic showing example Rx (inner) and Ry (outer) diameters around the injury core used for quantitative calculation of the ablation response R(t). (E) Quantification of microglia process movement toward the injury core shows that the responses of microglia in SEP and SAL animals are very similar and both less robust than the response of microglia in EtOH animals. The difference between the EtOH response and either the SEP or SAL response is not statistically significant at any time point. (Two-way ANOVA). SEP n=4, SAL n= 6, EtOH n=10 animals. Scale bar = 20 μm. Graph shows a mean ± SEM at each time point.
2.8 Microglial isolation by fluorescence activated cell sorting (FACS) for subsequent RNA-seq analysis
SAL or EtOH male C57BL/6 mice ranging in age from P30 to P36, were euthanized by i.p. sodium pentobarbital (Euthasol, Virbac, St. Louis, MO) and transcardially perfused with ice cold 0.15M PB. Each brain was removed and bilateral visual cortex was immediately dissected in ice cold, degassed FACS buffer = 0.5% BSA (Sigma A2153) in 1X PBS (Invitrogen 20012-027 pH 7.2). Tissue was kept on ice throughout. After dounce homogenization, the tissue with passed through a 70μm filter and centrifuged (1200 RPM, 7 min. 4°C). Supernatant was aspirated from pellets, which were prepared for magnetic labeling with Myelin Removal Beads II (Miltenyi 130-0960733) according to the manufacturer’s instructions. Magnetic columns (Miltenyi 130-096-733) were primed with FACS buffer and samples applied to the columns through a clean 70μm filter. After centrifugation of column flow-through and gentle supernatant removal, myelin depleted samples were incubated in Fc block (BioLegend 101320) for 15 minutes at 4°C.
Cells were incubated with CD11b-AlexaFluor 488 (BD Pharmingen 557672) and CD45-APC (BD Pharmingen 561018) for 30 minutes in the dark at 4°C. On each experimental day, the following compensation controls were also prepared fresh in conjunction with experimental samples: 488 bead control, APC bead control (eBiosciences 01-111-42), unstained cells, and triton-X treated cells (propidium iodide (PI) dead cell control). An extra non-experimental fully stained cell sample was included to check voltage settings prior to running experimental samples on an 18 color FACS Aria II flow cytometer. Prior to sorting, all samples and controls were re-suspended in a final FACS buffer volume of 300μL. PI was added to the samples and appropriate controls 1 hour prior to cell sorting.
For immediate cell lysis and preservation of RNA, microglia (CD11b+, CD45 low) were sorted directly into 1.5mL microcentrifuge tubes (Axygen 311-08-051) containing 600μL Buffer RLT PLUS (Qiagen, 1053393) and 6μL β-mercaptoethanol at 4°C, prepared just prior to sorting. Gates were kept consistent across all days and for three additional non-experimental samples that were used for post-sort analysis. Post-sorting revealed that our sorting accuracy into the CD11b+ CD45 low ‘microglia gate’ was 98.8 ± 0.78%, while cell viability after one pass through the flow cytometer was 83.0 ± 2.8%. Experimental samples were not pooled: individual samples represent microglia from bilateral visual cortex from one animal. See Fig. 7 for a procedure diagram and representative gating scheme.
Fig 7.
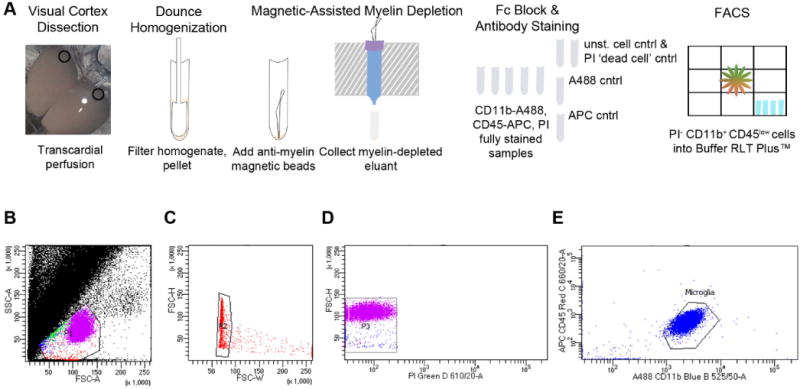
Flow cytometry for isolation of microglia from early adolescent mouse visual cortex. (A) Schematic illustrating the use of fluorescence-activated cell sorting (FACS) to isolate microglia from P28 bilateral V1b. Gating scheme that was used for all samples shows (B) selection of the population containing cells, including microglia; (C) selection of singlets; (D) selection of the propidium iodide (PI) negative population representing live cells; and (E) selection of CD11b+ CD45low microglia that were collected directly into Buffer RLT Plus™ prior to RNA extraction.
2.9 RNA isolation and RNA-sequencing
Total RNA was isolated using the RNeasy Micro Kit (Qiagen). RNA Integrity Number (RIN) was 9.53 ± 0.13 and RNA concentration was 220 ± 17 pg/μL across the 9 samples. 1ng of total RNA was preamplified with the SMARTer Ultra Low Input kit v2 (Clontech). cDNA quality was determined using a Qubit Flourometer (Life Technologies) and Agilent 2200 TapeStation. Illumina compatible sequencing libraries were generated from 5ng cDNA with the NexteraXT library prep kit (Illumina). Libraries were hybridized to the Illumina single-end flow cell and amplified using the cBot (Illumina) at 8pM per lane. Single-end reads of 100nts were generated. Data analysis included adapter removal by Trimmomatic v.032 “SLIDINGWINDOW:4:20 TRAILING:13 LEADING:13 ILLUMINACLIP:adapters.fasta:2:30:10 MINLEN:15” (Bolger et al., 2014). Mapping to the mouse reference genome (GRCm38.p4) with done using STAR 2.4.2a “–twopassMode Basic –runMode alignReads –genomeDir ${GENOME} − readFilesIn ${SAMPLE} –outSAMtype BAM SortedByCoordinate –outSAMstrandField intronMotif – outFilterIntronMotifs RemoveNoncanonical” (Dobin et al., 2013). Read quantification was accomplished with HTSeq-count v0.6.1 “-q -f bam -s no -r pos -i gene_name,” and identification of differentially expressed genes was completed using DeSeq2-1.10.1 [81, 82].
21,660 genes had at least one read count in at least one sample and were processed for differential expression analysis using the regularized logs of normalized gene counts derived from DESeq2 (DSrlogNGCs). These DSrlogNGCs for each detected gene were also used to generate the scatter plots in Fig. 8B–D. For the heatmap in Fig. 8A, the DSrlogNGCs for a subset of genes of interest were used for hierarchical clustering via Euclidean distance with average linkage clustering, which groups samples by transcript level relatedness. The heatmap diagram was produced using MeV® (http://mev.tm4.org/#/welcome), while the scatter plots were generated using GraphPad Prism5® (La Jolla, CA). The sample-to-sample distance matrix shown in S3 Fig. was generated by calculating the pair-wise Euclidean distance between each sample for all 21,660 genes using the dist() function from the stats R package (http://www.R-project.org) and then visualizing the values using the pheatmap R package with hierarchical clustering of the rows and columns. All data generated from this RNA-seq study is publically available on the GEO repository (GEO: GSE97464).
Fig 8.
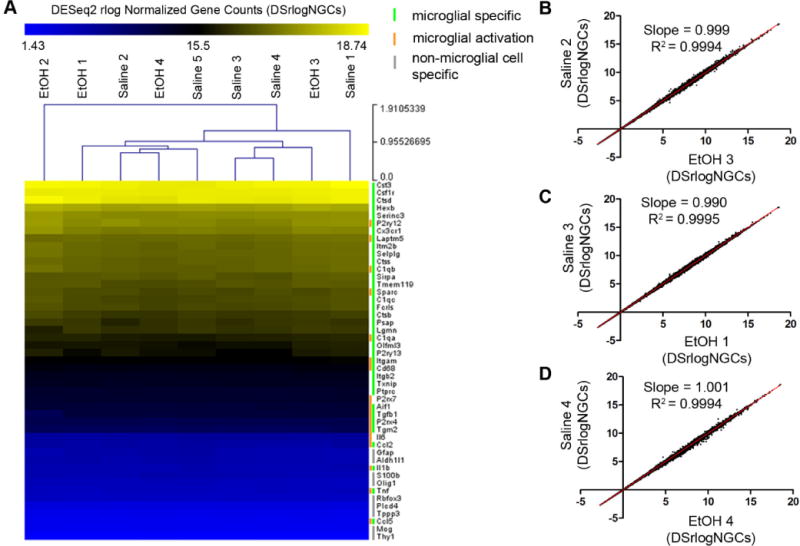
BGS EtOH does not change the transcriptome of microglia in P28 visual cortex. (A) To generate the heatmap shown, a subset of genes were selected based on the following three categories: 1) genes previously reported to be most highly expressed in microglia as opposed to other cell types in the CNS (green bar) 2) genes reported to change in expression depending on microglial activation state (orange bar) 3) genes reported to be expressed specifically in non-microglial cell types in the CNS (grey bar). Hierarchical clustering via Euclidean distance with average linkage clustering of the regularized logs of the normalized counts derived from DESeq2 (DSrlogNGCs) were used to generate the heatmap. The heatmap shows that microglial specific genes were highly expressed compared to genes specific to astroctytes, oligodendrocytes, and neurons. Moreover, the level of expression for each listed gene across all 5 SAL and all 4 EtOH animal samples was strikingly uniform. (B)–(D) Correlation of the expression of 21,660 genes detected in our RNA-seq experiment between different samples chosen at random. Each black dot plotted in the three graphs represents an individual gene whose expression was nearly identical in each randomly chosen EtOH sample (x axis) compared to each randomly chosen SAL sample (y axis). A best fit line was drawn in each case. Slopes were very close to 1 and R2 values were all > 0.99 indicating that across the entire range of genes detected, from lowest expressed to highest expressed genes, the levels of transcript for each gene were close to equivalent between SAL and EtOH animals.
2.10 Code availability
Matlab code for Nearest Neighbors analysis or microglial motility analysis is available upon request.
2.11 Statistics
GraphPad Prism5® (La Jolla, CA) was used throughout for graphing and statistics. n-values correspond to individual animals. In all cases, error bars represent mean ± SEM. and α = 0.05. The Grubbs Outlier test (http://graphpad.com/quickcalcs/Grubbs1.cfm) was used to check for statistical outliers and whole animals were excluded on this basis. Either one-way ANOVAs, two-way ANOVAs, or repeated measures two-way ANOVAs, all with Bonferroni post hoc comparisons were used where appropriate to evaluate statistical significance.
Results
3.1 Mouse model of third trimester high binge alcohol exposure
In order to understand the impact of early alcohol exposure on neural network plasticity and microglial phenotype, we used a mouse model that would mimic high binge ethanol (EtOH) exposure during the human third trimester. The human third trimester marks the start of the brain growth spurt (BGS), a period of rapid synaptogenesis when neural networks are just forming (Dobbing and Sands, 1979). In mice, the BGS begins upon birth (postnatal day 0 (P0)) and ends at approximately P14. (Olney et al., 2002a). Rodent studies administering EtOH during P4–P9 are common, with this age range considered to be the peak of the BGS (Kane et al., 2011; Sakata-Haga et al., 2006; Whitcher and Klintsova, 2008).
We chose an EtOH dosing paradigm (referred to as ‘developmental EtOH exposure’ or ‘BGS EtOH exposure’) that would achieve high binge levels of EtOH exposure in C57BL/6 mice throughout postnatal day 4 through 9 (P4–P9), while keeping weight gain differences among EtOH exposed and control groups to a minimum (Fig. 1). Rodent EtOH studies have generally defined an EtOH concentration in blood of 250mg/dL to be the threshold for high binge exposure (Whitcher and Klintsova, 2008). Fig. 1A illustrates the dosing paradigm for our study in which littermates with only the dam in the cage were pseudo-randomly assigned to one of three groups on P4 to achieve an even male/female distribution and equally distribute pups by weight at P4 across three groups. Pups assigned to the EtOH group (EtOH) received a daily total dose between P4 and P9 of 3.6g/kg EtOH, administered across two dorsal s.c. injections of 1.8g/kg EtOH separated by a two-hour interval. Saline control littermates (SAL) received s.c. saline injections of equal volume during the same dosing schedule as the EtOH mice. Note that pups were only separated from dam and littermates during the time it took to administer the injections, but that we also included a handling only or ‘separation’ control group (SEP) to account for the confounds of maternal and pup stress caused by repeated handling from P4–P9. All litters contained pups belonging to all three groups, SEP, SAL, and EtOH.
To measure blood ethanol concentrations (BECs) and brain ethanol concentrations (BrECs) achieved, a subset of EtOH animals were sacrificed 90 minutes after the second dose on either P4 or P9 (Fig. 1B). BECs and BrECs met or exceeded the 250mg/dL threshold for rodent high binge EtOH exposure on both the first and last day of dosing (Fig. 1B). Fig. 1C shows body weights of six representative C57BL/6 litters of both male and female mice from P4 to P27. Based on a repeated measures two-way ANOVA, there was a main effect of exposure group on body weight over time (F(2,69)= 6.09, p= 0.0037). Bonferroni post-hoc comparisons showed that on P21, EtOH mice were slightly but significantly smaller than SAL mice (#= p<0.05), while P27 EtOH mice were smaller than both SAL (†= p<0.01) and SEP ($= p<0.0001) mice (Fig. 1C). When body weights from males and females were graphed and analyzed separately by repeated measures two-way ANOVAs, we found a nearly significant main effect of exposure for females and a significant main effect of exposure for males (females F(2,32)= 2.95, p=0.067 and males: F(2, 34)= 4.41, p=0.02). Bonferroni post-hoc comparisons revealed significant differences in body weight only at P27 (males: EtOH vs. SAL #p<0.05; EtOH vs. SEP $<0.0001 and females: EtOH vs. SAL †= p<0.01) (S1 Fig. A–B). The difference in EtOH animal weight compared to controls only at P27 was also observed when data from males and females were graphed separately (S1 Fig. A–B).
3.2 Developmental exposure to high binge levels of EtOH causes a deficit in experience-dependent plasticity in early adolescent mice
To test whether early EtOH exposure in our model could lead to long-term deficits in experience-dependent plasticity, we focused on assessing whether changes in visual experience during early adolescence could cause shifts in ocular dominance that normally occur after experimentally-induced monocular deprivation (MD). We used intrinsic optical signal (iOS) imaging (Kalatsky and Stryker, 2003) of the contralateral binocular visual cortex (V1b) to assess ocular dominance in early adolescent SEP, SAL, and EtOH mice (Fig. 2A) after no deprivation (ND), 4 days of monocular deprivation (4D MD), or 7 days of monocular deprivation (7D MD). We determined the ocular dominance index (ODI) for each animal by comparing the intensity of the visual response to stimulation of each eye separately according to the following equation: ODI = (contra − ipsi)/(contra + ipsi). A positive, zero, or negative ODI indicates a contralateral eye bias, equal input from either eye, or an ipsilateral eye bias respectively.
Fig 2.
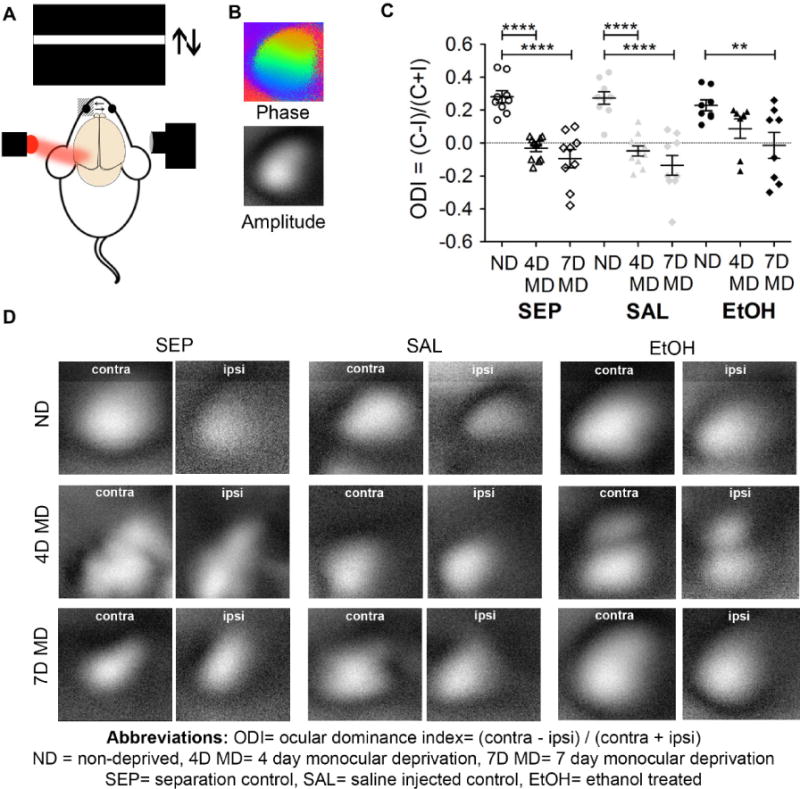
BGS high binge EtOH exposure impairs ocular dominance plasticity. (A) Schematic of intrinsic optical signal (iOS) imaging. Visual stimulation causes changes in neuronal activity in V1b that can be monitored via changes in the reflectivity of 700nm red light. (B) Sample phase (retinotopy) and amplitude (strength of cortical response) maps. (C) Ocular dominance indices (ODIs) in ND and MD animals from each exposure group. Each dot represents an individual animal, with n=7 to n=11 animals in each group. Results indicate normal contralateral eye biases in ND SEP (n=9), SAL (n=9), and EtOH (n=8) animals, significant ocular dominance shifts in 4D MD SEP (n=11) and SAL (n=10) as well as 7D MD SEP (n=9) and SAL (n=9) animals, but lack of a significant ocular dominance shift in 4D MD EtOH (n=7) animals. 7D MD EtOH (n=8) animals did exhibit a significant ocular dominance shift compared to ND EtOH animals. Overall, results indicate a plasticity deficit specific to the EtOH exposed group that could be detected after 4 days of monocular deprivation, but was overcome after a longer deprivation period (two-way ANOVA, Bonferroni post-hocs, where **= p< 0.01, ****= p<0.0001, and no asterisk= p> 0.05; significant main effect of deprivation F(2)= 42.78, p<0.0001 but not significant main effect of exposure group F(2)= 1.678, p= 0.19). Graph shows means ± SEMs. (D) Representative amplitude maps collected from animals belonging to each exposure group and deprivation condition.
As expected, SEP and SAL ND mice exhibited a normal contralateral eye bias of 0.28 ± 0.04 and 0.27 ± 0.04 respectively (Fig. 2C, 2D). EtOH ND mice also had a contralateral eye bias of 0.23 ± 0.03, not significantly different from SEP ND or SAL ND animals, indicating that early development of visual networks remains unaltered by BGS EtOH exposure in our model. Also as expected, 4D MD SEP and SAL animals both exhibited a significant shift away from a contralateral eye bias with ODIs of −0.03 ± 0.02 and −0.05 ± 0.03 respectively (****=p<0.0001 for both ND SEP vs. 4D MD SEP and ND SAL vs 4D MD SAL, two-way ANOVA, Bonferroni post-hocs). 4D MD EtOH animals did not show a significant ocular dominance shift, maintaining a contralateral eye bias of 0.09 ± 0.06 after contralateral deprivation (p>0.05 for ND EtOH vs. 4D MD EtOH, two-way ANOVA, Bonferroni post-hocs). These results indicate that BGS EtOH exposure impairs the early LTD-mediated loss of response to inputs from the closed eye, while SEP or SAL treatment did not affect this process.
We further assessed whether BGS EtOH affects the second phase of ODP in which responses to open eye inputs potentiate (Fig. 2C, 2D). As expected, 7D MD SEP and SAL animals also showed a significant shift away from contralateral bias with ODIs of −0.09 ± 0.06 and −0.14 ± 0.06 respectively (****=p< 0.0001 for both SEP ND vs. SEP 7D MD and SAL ND vs. SAL 7D MD, two-way ANOVA, Bonferroni post-hocs). Compared to ND EtOH animals, 7D MD EtOH animals also showed a significant shift away from contralateral eye bias, with an ODI of −0.01 ± 0.08, suggesting that in our model of BGS EtOH exposure, longer MD durations could elicit ODP (**= p<0.01 for EtOH ND vs. EtOH 7D MD, two-way ANOVA, Bonferroni post-hocs). For both the 4D MD EtOH and 7D MD EtOH cohorts, graphing of individual data points is suggestive of a biphasic response: animals either shifted (had negative ODI) or did not shift (had positive ODI) in response to deprivation (Fig. 2C). We conclude that BGS EtOH exposure reduces the capacity of visual cortex to undergo experience-dependent plasticity. Further details on all Bonferroni post-hoc results can be found in S1 Table.
3.3 Developmental exposure to high binge levels of EtOH does not cause long-term deficits in microglial morphology and dynamics in visual cortex
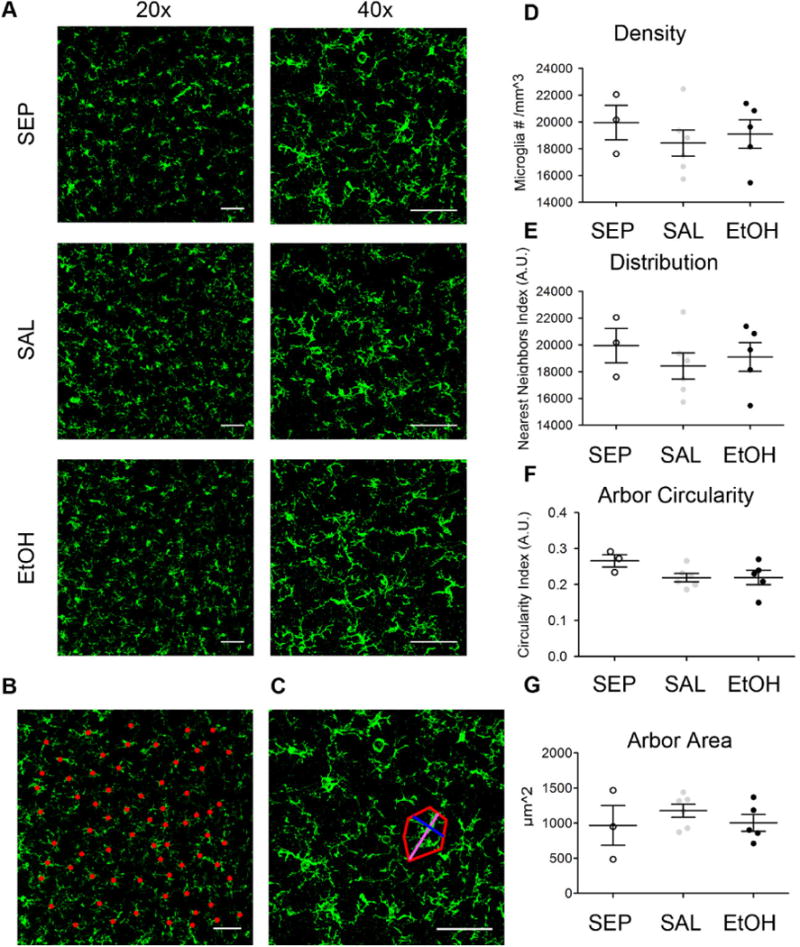
Recently, microglia have been highlighted as critical players in ODP (Sipe et al., 2016). Since a diverse literature describes changes in microglia indicative of immune activation after EtOH exposure (Ahlers et al., 2015; Boyadjieva and Sarkar, 2013; Drew et al., 2015; He and Crews, 2008; Kane et al., 2011; McClain et al., 2011), we wondered whether the deficits we observed in ODP could be due in part to long-term changes in microglial function after BGS EtOH exposure. Thus, we investigated whether microglia showed structural changes during adolescence that might be indicative of long-term activation or alteration in function. First, we assayed microglial morphology in layer II/III of V1b at P28 in SEP, SAL or EtOH non-deprived mice, (Fig. 3). We focused on layer II/III because the neurons in these layers form the networks that undergo remodeling during ODP (Mataga et al., 2004; Trachtenberg et al., 2000). We posited that after BGS EtOH exposure, early adolescent microglia would likely not be fully activated, but may show residual signs of prior activation from the earlier environmental insult. We used confocal microscopy to image fixed coronal sections of V1b in P28 C57BL/6 mice in which microglia had been specifically labeled using ionized calcium-binding adapter molecule 1 (IBA-1) immunohistochemistry (Figs. 3A–C). Surprisingly, one-way ANOVAs demonstrated no main effect of exposure group on microglial density (F(2)=2.35, p= 0.128), distribution (F(2)=0.0451, p= 0.96), arbor circularity (F(2)=0.418, p=0.67), or arbor area (F(2)= 2.67, p= 0.010) among SEP, SAL, and EtOH early adolescent mice, nor any significant differences by Bonferroni post-hoc comparisons (Fig. 3 D–G). This suggests that microglia in layer II/III binocular visual cortex at P28 are structurally similar regardless of prior BGS EtOH exposure and do not show signs of long-term activation.
Fig 3.
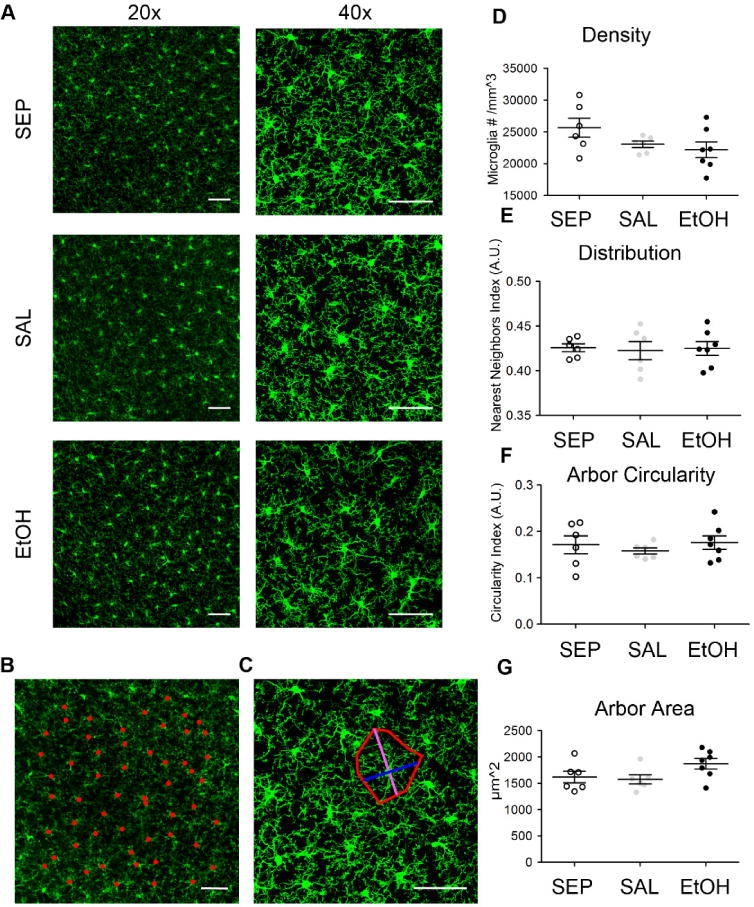
Microglial morphology in P28 V1b is unaffected by BGS EtOH exposure. (A) Sample confocal images of IBA-1 immunohistochemistry in fixed sections of layer II/III V1b were used to assess microglial density and distribution (20×) as well as microglial arbor circularity and arbor area (40×). (B) The example 20× image shows microglial cell bodies (red dots) used to quantify density and record coordinate locations of each microglia for distribution analysis. (C) The example 40× image shows process long (magenta) and process short (blue) measurements used for arbor circularity calculation, and the area quantified for arbor area analysis (red outline) for one sample microglia. (D)–(G) No significant differences in (D) microglial density, (E) distribution, (F) arbor circularity, or (G) arbor area were found among SEP (n=6), SAL (n=6), and EtOH (n=7) mice at P28 after P4–P9 high binge EtOH exposure (one-way ANOVAs, no main effect of treatment for any measure, Bonferroni post-hoc tests all p>0.05). Scale bars = 50μm. Graphs show mean ± SEM.
To ensure that our analysis did not miss subtle changes in microglial branching patterns, in a second cohort of SAL and EtOH C57BL/6 mice, we assessed the branching complexity of P28 layer II/III V1b microglia using Sholl Analysis (Fig. 4A–B). We found that branching complexity of SAL and EtOH microglia was very similar, with no main effect of exposure (F(1)= 1.988, p=0.196, repeated measures two-way ANOVA). Bonferroni post-hoc comparisons revealed that there were slightly fewer process intersections in SAL microglia compared to EtOH microglia at one distance, 16μm away from the soma center (*= p<0.05), though it is unlikely that this small difference in branching is biologically relevant. Overall, these results support the conclusion that early EtOH exposure does not cause long-term structural changes in V1b microglia (Fig. 4C).
Fig 4.
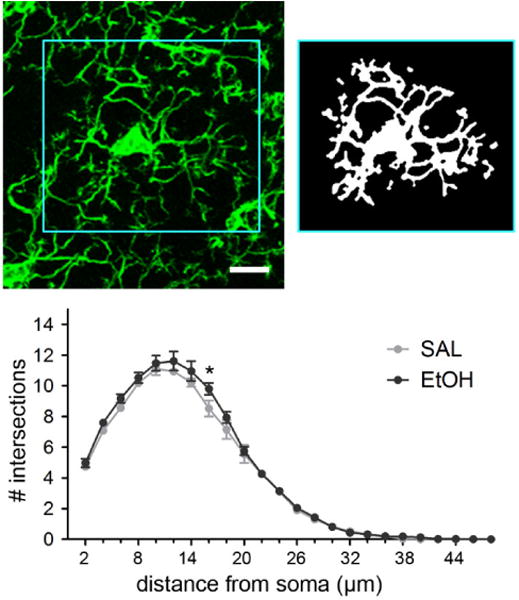
Microglial process complexity in P28 V1b is unaffected by BGS EtOH exposure. Example image of an individual microglia from a confocal maximum intensity Z projection (top left). Each microglia was carefully outlined to encompass the entire process territory while excluding processes from surrounding microglia. Images were then thresholded and binarized (top right) prior to Sholl analysis, which quantified the number of intersections that processes made with concentric circles drawn at set distances away from the soma center. For each animal, a total of 15 randomly selected microglia, 5 each from 3 different slices of V1b, were analyzed and the values averaged. Therefore, the means ± SEMs graphed represent whole animals as n, not individual microglia as the n (SAL n=5, EtOH n=5). There was no main effect of treatment on process ramification (F(1)= 1.988, p=0.1962), but Bonferroni post-hoc comparisons showed significantly less branching in SAL microglia compared to EtOH microglia only at 16μm away from the soma center (two-way ANOVA repeated measures). Scale bar = 10μm.
To verify our structural results, we also quantified CD68 positive areas within P28 layer II/II V1b microglia, since expression of this phagocytic marker is associated with microglial response to immune insult. We found very low percentages of microglial positive area occupied by CD68 staining, and no significant differences in this measure among SEP, SAL, and EtOH animals at P28 (no main effect of exposure F(2)= 2.305, p=0.134, Bonferroni post-hoc comparisons all p>0.05) (S2 Fig. B and D). All together, these results support the conclusion that adolescent visual cortical microglia are in a physiological, non-activated state after BGS EtOH exposure in our model.
Microglial cells are highly motile in the intact brain and it is posited that this motility is critical to their physiological functions (Davalos et al., 2005; Miyamoto et al., 2016; Nimmerjahn et al., 2005; Tremblay et al., 2010; Wake et al., 2009). Therefore, to assess microglial dynamics in visual cortex at P28 after BGS EtOH exposure, we employed in vivo two-photon microscopy (Fig. 5). In order to visualize microglia in the intact living brain, we used a thin skull preparation that limits perturbation to the brain parenchyma (Kelly and Majewska, 2010) and Cx3cr1-Heterozygous eGFP transgenic mice in which microglia express green fluorescent protein (GFP) (Jung et al., 2000). We evaluated microglial motility in SEP, SAL, and EtOH animals by imaging the same microglia in each animal repeatedly, every 5 minutes for 55 minutes. From the chronically collected images, we calculated a motility index (MI), which is an overall measure of microglial dynamics defined as an average of (extended + retracted)/(stable) areas across the 12 collected time points. By one-way ANOVA, we found no main effect of exposure on motility index (F(1)= 0.191, p=0.828) or significant differences among the three groups by Bonferroni post-hoc comparisons. To evaluate process extension and retraction separately, we also calculated an Extension Index (EI) (extended/stable) and Retraction Index (RI) (retracted/stable) across SEP, SAL, and EtOH animals. We also found that prior EtOH exposure did not affect the EI (F(2)= 0.253, p=0.779) or RI (F(2)= 0.332, p=0.722), and that overall, process extension and retraction each contributed approximately equally to the overall amount of microglial motility observed (compare Fig. 5C to Figs. 5D and 5E). These findings are consistent with the conclusion that microglial physiological functions remain intact after BGS EtOH exposure.
3.4 Developmental exposure to high binge levels of EtOH may affect microglial response to injury
We sought to understand whether the immune functions of microglia remain altered in adolescence after early EtOH exposure by measuring the microglial response to a focal tissue injury in adolescent visual cortex, induced by the heat of a laser applied to the skull surface through the thin skull window preparation. After such an injury, microglia rapidly extend their processes to the ablation core. Ablation core diameter for all experimental animals included was 22.6 ± 1.8μm and not significantly different among the SEP, SAL and EtOH treatment groups (F(2)= 2.085, p=0.155, one-way ANOVA). We found that while microglia in all three groups responded to the tissue injury by extending their processes toward the injury location, microglia from EtOH treated animals tended to have a faster and more robust response to the injury (Fig. 6A–C, E). Supplemental videos show the dynamic response of microglia to tissue injury in the same SEP (S1 Video), SAL (S2 Video), and EtOH (S3 Video) representative animals shown in Fig. 6A–C. However, it is important to note that the differences between EtOH and either the SEP or SAL groups were not statistically significant (Fig. 6E), due in large part to the higher variability in the response among EtOH animals compared to either SAL or SEP animals. While there was a highly significant main effect of time on ablation response as expected (F(11)= 10.43, p<0.0001), there was no main effect of treatment by two-way ANOVA (F(2)= 2.078, p= 0.156), nor did Bonferroni post-hoc comparisons show a significant difference in ablation response at any time point. Overall, determining whether microglia may be more responsive to injury long-term after BGS EtOH exposure deserves further exploration in future studies.
3.5 Developmental exposure to high binge levels of EtOH does not cause long-term changes in the microglial transcriptome
To determine how BGS EtOH exposure might alter microglia in the long-term, leaving them more sensitive to secondary immune challenge, we decided to examine potential subtle changes in gene expression within early adolescent visual cortex microglia with or without prior EtOH exposure. We used fluorescence-activated cell sorting (FACS) to isolate microglia from early adolescent animals (Fig. 7) and RNA-sequencing to assess the transcriptome of these microglia (Fig. 8, S3 Fig., GEO: GSE97464). For simplicity, and because we did not observe differences between SAL and SEP mice in any of our other experiments, this study only involved male SAL and EtOH C57BL/6 mice.
Fig. 7A details our flow cytometry tissue preparation protocol for microglia isolation from bilateral visual cortex. We successfully sorted and collected live microglia directly into cell lysing/RNA preserving buffer, as shown in the representative flow cytometry dot plots with a substantial propidium iodide negative (PI-) CD11b+ CD45low population. Consistent with the conclusions from Figs. 3–5 that microglial phenotype is physiological at P28 after BGS EtOH exposure, no CD45high CD11b+ cells were detected (Fig. 7B). If such cells were detected in a second grouped population, it might have suggested infiltration of the brain tissue with CD45high CD11b+ peripheral immune cells (Pino and Cardona, 2011), or a change in a subset of microglia to an immune-activated phenotype (Melief et al., 2013). Post-sorting of microglia isolated from three additional non-experimental cortical tissue samples of early adolescent C57BL/6 mice showed that microglial cell viability immediately after migrating through the flow cytometer was 83.0 ± 2.8%.
RNA from the sorted microglia was isolated and high RNA quality was confirmed prior to RNA-sequencing. The sequencing procedure required 1ng of RNA and selected for mature mRNA based on the presence of a polyA tail. FastQC™ analyses were conducted for all samples individually in order to assess sequencing quality (see GEO: GSE97464). For each sample, at least 94.7% of cDNA fragments 100nts (nucleotides) in length mapped to a unique location on the mouse genome GRCm38.p4. Fig. 8A shows the relative transcript expression levels of a subset of genes of interest belonging to three separate groups delineated by published work as follows: Group 1) genes expressed specifically by microglia in the CNS (green bar) (Zhang et al., 2014; Zhang et al., 2016), Group 2) genes expressed differentially in the CNS when microglia are immunologically activated (orange bar), Group 3) non-microglial genes, for example those expressed specifically by neurons, astrocytes, and oligodendrocytes (grey bar). This analysis confirms the success of our microglial specific isolation, since expression of non-microglial specific genes was consistently low (in blue) while microglial specific gene expression was consistently high where expected (i.e. Csf1r, Cx3cr1, P2ry12) (Zhang et al., 2014) and also low where expected (i.e. Ccl5) for physiological microglia (Fig. 8A) (Bennett et al., 2016; Zhang et al., 2014). Of note, markers of peripheral immune cells Cd19, Cd3E, and Ly6G for B cells, T cells, and granulocytes respectively, were not detected, demonstrating that samples were not contaminated with peripheral immune cell types (Grabert et al., 2016).
Using the subset of genes of interest shown in Fig. 8A, Euclidian distance hierarchical clustering with Pearson correlation was performed on DESeq2 rlog normalized gene counts (DSrlogNGCs). This analysis revealed a striking absence of transcript-level gene expression differences between SAL and EtOH samples (Fig. 8A). The samples did not group by treatment, demonstrating that SAL or EtOH was not influencing gene expression variability above chance alone. Additional analysis was performed to ensure that the pattern of SAL and EtOH sample clustering was not influenced by the experimental day microglia were isolated (a would-be batch effect). The consistency in yellow or blue coloring across all nine samples in Figure 8A illustrates just how similar transcript levels of these genes of interest were in early adolescent visual cortex microglia, regardless of prior EtOH exposure. In addition, when hierarchical clustering using Euclidean distances was performed in a correlation matrix analysis that included all genes detected (not just the selected genes of interest in Fig. 8A), sample relatedness was again found not to be defined by treatment group identity (S3 Fig.).
In total, 21,660 genes met the detection threshold, defined as a gene having at least 1 read count in at least one of the 9 samples. While this is a non-stringent method of defining the genes included in our analysis, it is comprehensive and includes all genes whose mature mRNA transcripts were present at any level in the samples. The three scatter plots in Figure 8B–D show three different examples of the remarkable similarity in expression across all genes detected, when comparing SAL and EtOH samples. For each of the scatter plots, all 21,660 detected genes are graphed, with DSrlogNGCs from a randomly selected SAL animal graphed on the y axis and the corresponding read counts from a randomly selected EtOH animal graphed on the x axis. R2 values for the best-fit lines were all above 0.99. Zero genes were detected as significantly differentially expressed by DESeq2 analysis. Separately, but using the same data set, differential expression analysis using the CuffDiff algorithm was also performed. Again, no genes were flagged as significantly differentially expressed.
Overall, these RNA-seq data showed that across the entire spectrum of detected transcripts, from the lowest to highest expressed genes, expression level was nearly identical in SAL and EtOH P28 microglia isolated from visual cortex (Figs. 8A–D). These findings provide strong evidence that microglial phenotype in P28 visual cortex is indeed largely unperturbed by BGS EtOH exposure.
3.6 BGS EtOH does not cause neuronal death or activate microglia acutely in mouse visual cortex
To further understand why long-term microglial function and gene expression were so resistant to early EtOH exposure, despite the significant effect of EtOH at this time on later experience-dependent cortical plasticity, we chose to look at an earlier time point to determine whether EtOH caused acute changes in microglia. We again assayed microglial density, distribution, arbor circularity, and arbor spread in an analogous fashion to Fig. 3, but at P10, 24 hours after the last EtOH dose (Fig. 9). Confocal images showed that, as expected due to the difference in age (Arnoux et al., 2013), the density of microglia at P10 was lower than the density of microglia at P28 (Fig. 3D vs. Fig. 9D). Qualitatively, P10 microglia had fewer fine processes and exhibited a more amoeboid shape, also typical of cortical microglia at this developmental age (Eyo and Dailey, 2013). However, contrary to our hypothesis that P10 microglia in the EtOH group would have a more activated morphology compared to controls, we did not find a significant main effect of treatment on density (F(2)= 2.35, p=0.128), distribution (F(2)= 0.0451, p=0.956), arbor circularity (F(2)= 0.418, p=0.666), or arbor spread (F(2)= 0.643, p=0.544) among the SEP, SAL, and EtOH groups (Figs. 9D–G). Bonferroni post-hoc comparisons after one-way ANOVAs also did not shown any significant differences. These results suggest that these cortical microglia are not activated by EtOH, even shortly following the developmental exposure. Consistent with these findings, we did not observe changes in the percentage of microglial area that was also positive for CD68 (a phagocytic marker) among groups at P10 (F(2)= 0.5006, p=0.6206, one-way ANOVA) (S2 Fig. A and C). Furthermore, we performed an analysis of microglial density at P5, 24 hours after the first EtOH exposure. For this study, we used CX3CR1-Heterozygous eGFP mice, which were also used in a prior study reporting increased microglial density and clumping of amoeboid microglia specifically in layers II and IV of somatosensory cortex 24 hours after intraperitoneal (i.p.) EtOH exposure on P7 or P8 (Ahlers et al., 2015). S4 Fig. shows that the density of microglia in V1b layers II/III (F(2)= 1.360, p= 0.3003), IV (F(2)= 1.074, p= 0.3781), and V/VI (F(2)= 1.552, p= 0.2588) was not affected even 24 hours after P4 EtOH exposure. While the irregular morphology of microglia at this age precluded a quantitative analysis, microglial morphology was not qualitatively altered between groups. Together, these results strongly support the conclusion that in our BGS model of EtOH treatment, the visual cortex may be a relatively spared area in which microglia do not assume an activated phenotype even acutely after exposure.
Fig 9.
Microglial morphology in P10 V1b is unaffected by BGS EtOH exposure. (A) Representative confocal images of IBA-1 immunohistochemistry in fixed sections of layer II/III V1b (B) Sample 20× and (C) 40× images used for density/distribution and circularity/arbor area analyses respectively. Analysis was analogous to that done for P28 animals as shown in Fig 3. Microglial cell bodies were marked (red dots) to quantify density and record coordinate locations of each microglia for distribution analysis. 40× images were used to quantify microglial circularity using process spread measurements (process long= magenta and process short= blue). The red outline shows an example of the arbor area calculated for one sample microglia. No significant differences in (D) microglial density, (E) distribution, (F) arbor circularity, or (G) arbor area were found among SEP (n=3), SAL (n=6), and EtOH (n=4) mice at P10 (one-way ANOVAs). Dots indicate individual animals. Scale bars = 50μm. Graphs show mean ± SEM.
Because other studies have reported microglial activation in different brain areas following P4–P9 high binge EtOH exposure paradigms that were similar although not equivalent to the one used here (Boschen et al., 2016; Drew et al., 2015; Kane et al., 2011), we wondered why microglia in visual cortex were not sensitive to our BGS EtOH exposure model. In the literature, microglial activation after EtOH exposure is often paired with neuronal death (Ahlers et al., 2015; Ikonomidou et al., 2000; Olney et al., 2002b). In fact, recent evidence supports the conclusion that microglial activation after developmental EtOH exposure is initiated by neuronal apoptosis rather than by a direct effect of EtOH on microglia (Ahlers et al., 2015). Thus, we sought to determine whether our BGS EtOH paradigm caused neuronal death in visual cortex. For a gross measure of general cortical cell survival, we first measured visual cortex thickness after BGS EtOH (Fig. 10A–B). While P28 visual cortex thickness was significantly greater than P10 visual cortex thickness (F(1)= 21.28, p<0.001 main effect of age, one-way ANOVA), exposure condition did not affect visual cortex thickness at either age (F(2)= 0.567, p= 0.574, no main effect of exposure group, one-way ANOVA) (Fig. 10A–B). Bonferroni post-hoc comparisons also showed no significant differences in cortical thickness among SEP, SAL, and EtOH animals of the same age. Whole brain weights, excluding olfactory bulbs and brain stem of C57BL/6 SEP, SAL, and EtOH mice were also weighed at P28 directly after perfusion. No significant effect of exposure group on whole brain weight was detected (F(2)= 0.518, p= 0.610, two-way ANOVA, no main effect, Bonferroni post-hoc comparisons all p>0.05) (Fig. 10C). These data suggest that daily exposure to two 1.8g/kg s.c. doses of EtOH (separated by a two hour interval) during the BGS from P4–P9 did not cause widespread cell death that would lead to a gross reduction in cortical thickness or brain size.
Fig 10.
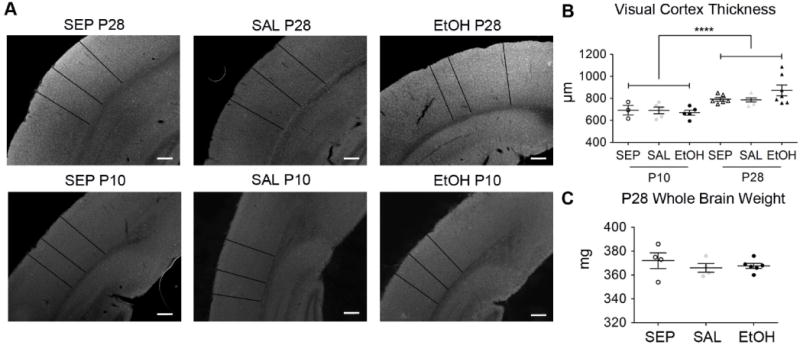
P28 V1b cortical thickness and whole brain weight are unaffected by BGS EtOH. (A) Representative 4× brightfield images of P10 and P28 coronal sections containing visual cortex. Cortical thickness measures (black lines) at three random locations per image were averaged and two sections per animal were analyzed and graphed in (B). As expected, cortical thickness was significantly greater in P28 animals compared to P10 animals (****= p< 0.0001, two-way ANOVA, main effect of age). However, EtOH exposure did not affect visual cortical thickness at either age. Dots are individual animals with P10 SEP (n=3), P10 SAL (n=5), P10 EtOH (n=5), P28 SEP (n=6), P28 SAL (n=5), and P28 EtOH (n=7). (C) P28 SEP (n=4), SAL (n=4), and EtOH (n=6) brains were weighed directly after transcardial perfusion and removal of brainstem and olfactory bulbs, revealing no significant differences among the three groups (one-way ANOVA). Scale bar = 200μm. Graphs show mean ± SEM.
We next assessed whether reductions in neuron number could be detected in V1b at P28, particularly in layer II/III where we assayed microglial phenotype (Figs. 11A–B). Since neurons are post mitotic, neuronal cell death at an early age would result in reduced density throughout life. In this set of experiments, C57BL/6 mice were dosed at the extremely high binge level of 2.5g/kg × 2 EtOH daily from P4–P9, which should have resulted in more cell death than with our 1.8g/kg × 2 EtOH daily P4–P9 dosing paradigm. Even at this higher level of BGS EtOH exposure, NeuN-labeled neuron density in layer II/III at P28 was not significantly different from that of control groups (F(2)= 1.033, p= 0.378, Bonferroni post-hoc comparisons all p>0.05, one-way ANOVA) (Fig. 11A–B). These results, together with results in Fig. 10, support the conclusion that neurons in layer II/III visual cortex did not undergo cell death as a result of BGS EtOH.
Fig 11.
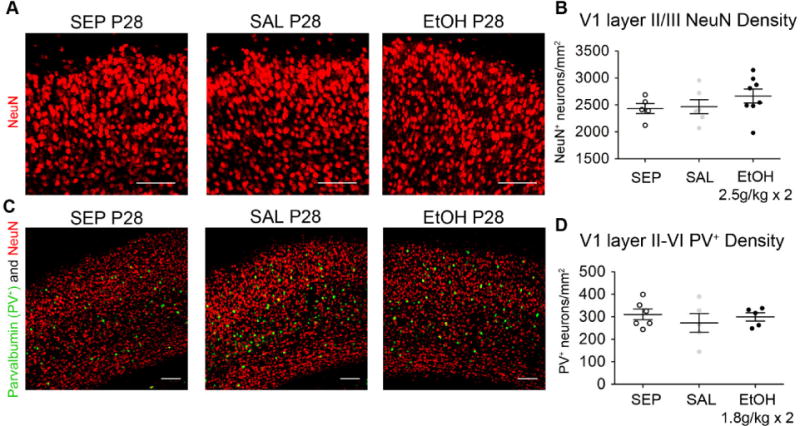
P28 V1b neuron density is not altered by BGS EtOH exposure. (A)– (B) For this experiment only, mice were treated with a higher level of EtOH, 2.5g/kg s.c. 2 times/day from P4–P9, using the same two hour interval between the two daily doses. (A) Representative images of layer II/III used to quantify NeuN density are shown. (B) No significant differences in NeuN density were detected among SEP (n=5), SAL (n=6), and EtOH (n=8) groups (one-way ANOVA). (C)– (D) Mice were treated according to the 1.8g/kg s.c. 2 times/day dosing paradigm, as in experiments presented in all previous figures. (C) Immunohistochemistry for NeuN (red) and Parvalbumin (PV+) (green), a marker of a subset of inhibitory interneurons, was completed on coronal sections containing V1b. (D) Density of PV+ neurons was assessed throughout layers II–VI and found to be similar among SEP (n=6), SAL (n=5), and EtOH (n=5) animals (one-way ANOVA). Scale bars= 100μm. Graphs show mean ± SEM.
We were also interested in probing whether 1.8g/kg × 2 P4–P9 BGS EtOH exposure affected a subpopulation of GABAergic inhibitory interneurons that express parvalbumin (PV+). Normal neuronal network function is tied to the balance between excitatory and inhibitory inputs. Furthermore, extensive literature has shown that the opening and closure of the visual critical period is controlled by the maturation of PV+ inhibitory interneurons (Fagiolini et al., 2004; Pizzorusso et al., 2002). One previous study also reported a reduction in the density of PV+ interneurons in adult motor cortex and prefrontal cortex after P7 high binge EtOH exposure (Coleman et al., 2012). Therefore, we performed PV+ NeuN immunohistochemistry to quantify PV+ inhibitory interneuron density in layers II–VI of P28 visual cortex (Fig. 11C–D). We found no difference in PV+ inhibitory interneuron density among SEP, SAL, and EtOH animals, leading us to conclude, overall, that BGS EtOH in our model did not trigger pronounced neuronal cell death. Therefore, we likely did not detect changes in the activation state of microglia in P10 or P28 layer II/III visual cortex after BGS EtOH exposure because the exposure did not induce elevated levels of neuronal cell death in this brain region.
Discussion
This study aimed to elucidate potential underlying causes of cognitive disability in FASD by investigating ways in which developmental EtOH exposure affects the physiological and/or pathological functions of microglia in a mouse model. We focused on assessing microglial phenotype in the visual cortex, a brain region showing deficits in experience-dependent synaptic plasticity in early adolescent mice following our model of BGS EtOH exposure (Fig. 2, (Lantz et al., 2015)). Because recent studies have implicated microglia as critical players in experience-dependent plasticity, we hypothesized that BGS EtOH might alter the physiological phenotype of microglia in a way that would impair synaptic plasticity. However, assessment of microglial structure, dynamics, and gene expression in early adolescent animals showed that microglia in the visual cortex of mice at this age were remarkably unperturbed long-term by the developmental EtOH exposure. In fact, visual cortex microglia were not activated acutely after EtOH exposure, a finding likely related to our observation that extensive neuronal cell death also did not occur in this brain region. However, we observed a trend for early EtOH exposure to increase the responsiveness of microglia in adolescent visual cortex to focal injury when compared to microglia in control mice, suggesting that there may be a long-term difference in the ability of microglia to undergo immune activation in response to a ‘second hit.’ Overall, we conclude from our mouse model that high binge levels of BGS EtOH exposure, mimicking exposure during the human third trimester, causes an experience-dependent plasticity deficit that occurs independently of large changes in the baseline phenotype of microglia.
4.1 Long-term effects of developmental EtOH exposure on experience-dependent plasticity in visual cortex
Prior studies provide a range of evidence supporting the conclusion that early EtOH exposure can induce defects in experience-dependent synaptic plasticity. For example, exposing rats to EtOH throughout gestation leads to negative outcomes for adult somatosensory cortex neuronal function: spontaneous activity is dramatically decreased and the ability of these neurons to undergo plasticity in response to whisker trimming is severely impaired (Rema and Ebner, 1999). Deficits in experience-dependent plasticity within the visual cortex, specifically ocular dominance plasticity (ODP), have also been demonstrated after BGS EtOH exposure (Lantz et al., 2015; Lantz et al., 2012; Medina et al., 2003; Medina and Ramoa, 2005). A detailed understanding of this specific plasticity deficit is relevant to the human condition, as FASD patients often have difficulties with visual perception because of poor visual acuity and sensitivity to contrast (Doney et al., 2016; Vernescu et al., 2012). In both adolescent ferrets and mice, the ocular dominance bias of animals that remain non-deprived after EtOH exposure during the BGS is no different from that of controls. However, when animals previously exposed to EtOH undergo monocular deprivation for either short (3–4 days) or longer periods (10 days) during the visual critical period, they exhibit defects in their ability to shift ocular dominance toward the open eye (Lantz et al., 2015; Lantz et al., 2012; Medina et al., 2003). It has been shown in ferrets that the BGS EtOH-induced impairment of ODP is present regardless of when monocular deprivation is initiated during the visual critical period (Medina and Ramoa, 2005).
In our model of high binge BGS EtOH exposure, which used a lower EtOH dose than previously reported (Lantz et al., 2012), we found a definite but less severe impairment of ODP in early adolescent animals (Fig. 2). Agreeing with prior literature, we found that without deprivation, EtOH mice had a contralateral eye bias no different from that of either SEP or SAL controls (Lantz et al., 2015). After 4 days of contralateral eye monocular deprivation, BGS EtOH treated mice exhibited ODIs that were not significantly different from those in the ND EtOH group, demonstrating that the ocular dominance shift toward the open eye did not occur properly. However, after a longer deprivation period of 7 days, ODIs of EtOH animals were significantly lower than that of the ND EtOH group. Previous reports showed a layer-specific defect in ODP after BGS EtOH exposure (Lantz et al., 2015). In EtOH-exposed animals, layer IV neurons underwent normal ocular dominance shifts in the early phase of ODP, which is mediated by an LTD-driven weakening of deprived eye responses, while layer II/III neurons did not. However, layer IV neurons were deficient in the late phase of ODP, when open eye responses are strengthened by LTP-like or homeostatic mechanisms. Here, we confirm that neurons in layer II/III (which is assessed using iOS in our experiments) are deficient in the early phase of ODP, and we show that an ocular dominance shift can occur in the late phase. Because some studies have suggested that an initial depression of deprived eye responses is an important trigger for the potentiation of open eye responses (Mrsic-Flogel et al., 2007), it is unclear whether in layer II/III in our model of EtOH exposure the first phase is delayed, needing a longer time to take effect, or whether the late phase occurs normally in the absence of the early phase. Future studies are needed to determine the exact effects of BGS EtOH on ODP.
Additionally, our results demonstrate heterogeneity in the effect of BGS EtOH on ODP. While there was a significant shift in ocular dominance on average in the 7D MD EtOH group, a number of animals within this group did not shift, thus reducing the overall magnitude of the shift compared to that seen in 7D MD SEP and 7D MD SAL groups (Fig. 2C). Similarly, while 4D MD EtOH animals did not show a significant shift on average, some animals did show MD-induced changes in ocular dominance (Fig. 2C). The fact that some 4D MD and some 7D MD EtOH animals exhibited ocular dominance shifts similar to that of controls, while others did not shift, indicates that individual animals can have differential susceptibility to developmental EtOH exposure. While it is difficult to pinpoint factors that may predispose mice to EtOH-induced ODP deficits, animal sex did not appear to be a defining factor in our study. This conclusion is also consistent with male and female animals being grouped together in prior studies focused on EtOH-induced ODP impairment (Lantz et al., 2015; Lantz et al., 2012).
4.2 Visual cortex microglial phenotype long-term after developmental EtOH exposure
In response to pathology, microglia change their morphology from highly ramified cells to cells with fewer, thicker processes and a more compact arbor spread. As the brain’s resident immune cells, their phagocytic activity also increases, facilitating clearance of dead cells and debris. Microglia can also hone to a damaged or infected brain region, as well as proliferate to compensate for a loss in population. Therefore, an analysis of microglia morphology, density, and phagocytic activity can be generally revealing of microglial activation state. A prevailing hypothesis within the FASD field and one that we held at the outset of our studies, is that developmental EtOH exposure may cause cognitive dysfunction through persistent neuroinflammation triggered by early microglial activation that leads to a spiral of uncontrolled neuronal cell death (Block et al., 2007; Guizzetti et al., 2014).
Adding layers to this hypothesis, it has become increasingly clear that microglia also have many important roles under normal physiological conditions. Therefore, our studies also focused on investigating the potential effects of BGS EtOH exposure on these physiological functions, which are known to be critical for normal neural network development, synaptogenesis/synaptic pruning (Miyamoto et al., 2016; Paolicelli et al., 2011; Schafer et al., 2012), and synaptic plasticity (Sipe et al., 2016). Indeed, microglial physiological functions and ODP were recently shown to be intricately intertwined. Within 12 hours of MD, microglia hyper-ramify (Sipe et al., 2016), and this initial increase in branching complexity returns to levels seen in ND animals after longer periods of deprivation (through 7 days) when circuit remodeling is largely complete. In addition, microglial process motility decreases in V1b after two or four days of monocular deprivation and at both these time points, increased apposition of microglial processes with synaptic clefs was detected at the ultrastructural level (Sipe et al., 2016). It is thought that since these morphological and dynamic changes occur early, microglia may be influencing the early phase of ODP when inputs from the contralateral eye are being lost. In fact, the number of phagocytic inclusions in microglia increases rapidly after MD and peaks at 2 days (Sipe et al., 2016). This phagocytosis may be related to the removal of synapses that serve the deprived eye, since at this time, the number of glutamatergic puncta engulfed by microglia also increases (Sipe et al., 2016). Importantly, blocking the activity of a microglial specific purinergic receptor, P2RY12, either using a genetic knockout (KO) mouse or treating with a P2RY12 antagonist, severely impairs ODP. P2ry12-KO animals do not show ocular dominance shifts even after 7 days of MD, indicating that disruption of microglia physiological functions within V1b can profoundly impair experience-dependent synaptic plasticity (Sipe et al., 2016).
Thus, we sought to assess microglial phenotype in V1b at the same age when we observed the EtOH-induced ODP deficit, focusing on morphological signs of microglial activation, including density, distribution, arbor area, the circularity of process spread (all Fig. 3), branching complexity (Fig. 4), phagocytic activity (S2 Fig.), dynamic microglial process motility (Fig. 5), as well as potentially subtle changes in the entire mature mRNA transcriptome of microglia (Fig. 8). Unexpectedly, we found that by all these measures, microglial phenotype at P28 in V1b was not perturbed in any detectable way by BGS EtOH exposure in our model. The transcriptome data was particularly supportive of this conclusion, in that of the 21,660 genes detected, none were significantly differentially expressed between SAL and EtOH groups (Fig. 8B–D). P2RY12, known to be critical for ODP and also highly expressed at the protein level in ramified, physiological microglia (Davalos et al., 2005; Sipe et al., 2016), was one of the most highly detected transcripts in V1b microglia isolated from both SAL and EtOH animals (Fig. 8A). Iba-1 (Aif1), known to be produced at higher levels by pathologically activated microglia compared to microglia in the unperturbed brain also displayed very similar levels of transcript across all samples. This transcript level comparison at P28 was also consistent with similar levels of IBA-1 protein-level immunohistochemical staining qualitatively seen across SEP, SAL, and EtOH groups in Fig. 3 and S2 Fig.
Of note, we also found no difference in transcript levels of Cx3cr1 (fractalkine receptor) between microglia from SAL or EtOH P28 visual cortex. Fractalkine signaling, defined in the CNS as that between fractalkine (CX3CL1) expressed by neurons and fractalkine receptor (CX3CR1) expressed by microglia, has long been thought as a critical channel of communication between these two cell types (Harrison et al., 1998). Assays documenting the interaction between microglia and photoreceptor cells in the retina demonstrate (by using CX3CR1 neutralizing antibodies as well as artificial addition of soluble CX3CL1) that microglia chemotactically migrate toward CX3CL1, sensing this signal through CX3CR1 (Zhang et al., 2012). Differences in synapse development and microglial densities at early postnatal ages have been found between Cx3cr1-Heterozygous eGFP mice and Cx3cr1-KO eGFP mice, suggesting that microglial CX3CR1 expression supports normal synaptic pruning (Paolicelli et al., 2014). In our RNA-seq study, Cx3cr1 transcripts were highly represented at similar levels in all SAL and EtOH samples (Fig. 8A).
Our RNA-seq study also demonstrates that complement system signaling is unperturbed in P28 visual cortex microglia after BGS EtOH exposure. It has been shown that microglia engulf retinogeniculate presynaptic inputs at an age when pruning of synapses in this region peaks (P5), and that this pruning depends on complement because significantly fewer synapses are phagocytosed by microglia in Cr3-KO mice (Schafer et al., 2012). The CR3 protein complex consists of the integrins CD11b and CD18, written as ITGAM and ITGB2 respectively in Fig. 8A. We found that transcript levels of these CR3 components were similarly expressed across all our SAL and EtOH samples (Fig. 8A), suggesting no long-term impact of BGS EtOH exposure on CR3. Components of the C1Q protein complex include C1QA, C1QB, and C1QC. We found that transcript levels of all these C1Q components were also similarly expressed across all our SAL and EtOH samples in Fig. 8A. Together, these results support the conclusion that complement signaling remains intact in early adolescent visual cortex microglia, despite prior BGS EtOH exposure. Overall, we found that none of the microglial functions known to play a role in the remodeling of neuronal networks were affected by BGS EtOH exposure: ramification was unaltered, dynamics were unchanged, the phagocytic profile of microglia was normal, and transcript levels of genes previously implicated in microglial-driven synaptic remodeling were also not differentially expressed because of BGS EtOH exposure.
4.3 Evaluating visual cortex for long-term neuronal damage and potential acute effects of EtOH on microglia
While our analysis showed that microglia were not activated long-term in our model, acute changes in microglial activation state have been shown to occur within 6 to 48 hours after BGS EtOH exposure. EtOH can cause microglial activation and corresponding changes in cellular morphology within 24 hours of high binge EtOH exposure in somatosensory cortex (Ahlers et al., 2015; Drew et al., 2015), hippocampus (Boschen et al., 2016; Topper et al., 2015), and cerebellum (Drew et al., 2015; Kane et al., 2011; Topper et al., 2015). It has been more recently shown that apoptotic neuronal cell death is a prerequisite for this microglial activation response, in that when apoptosis is genetically prevented, EtOH exposure no longer causes microglial activation as measured morphologically, by protein expression, and by proinflammatory cytokine/chemokine production (Ahlers et al., 2015). In wild type rodents, most studies have reported increased transcript levels of proinflammatory cytokines and chemokines such as IL-1β, Ccl2, Tnf-α, and Ccl4, in whole tissue homogenate from these same brain regions within 24 hours after high binge BGS EtOH exposure (Boschen et al., 2016; Drew et al., 2015). A recent study that included both acute and long-term time points showed that even when microglial activation and neuronal cell death are observed acutely during BGS EtOH exposure in cerebellum, by P45, differences in microglial morphology are no longer detected, though neuronal density remains reduced (Topper et al., 2015). Together, the literature currently supports the hypothesis that microglia are capable of responding to EtOH as an immune insult once EtOH has surpassed a ‘toxic threshold’ at which neurons undergo apoptosis (Ikonomidou et al., 2000), but that even after neuronal apoptosis, microglia are capable of resolving to a physiological, non-activated state.
Our findings support the conclusions from literature showing that in the absence of pronounced cell death, microglia do not activate even acutely after EtOH exposure. Employing a variety of in vivo methods, we found no signs of microglial activation in visual cortex at P5 (S4 Fig.), P10 (Fig. 9, S2 Fig.), or P28 (Fig. 3, Fig. 4, Fig. 5, Fig. 8, S2 Fig., S3 Fig.). In our study, EtOH also did not elicit changes in brain weight or V1b thickness (Fig. 10), and V1b NeuN density was not decreased in early adolescence (Fig. 11). While we thought there might be more limited elimination of specific neuronal types, such as PV+ interneurons that critically regulate ODP, we did not observe this either, suggesting that EtOH-induced cell death was very limited within visual cortex in our model (Fig. 11). It is important to note that our study is the first specifically document that ODP is affected by prior EtOH exposure even in the absence of neuronal cell death and microglial activation, supporting the idea that EtOH has many targets in the brain and can negatively impact experience-dependent plasticity without overtly affecting the survival of neuronal populations or microglial function.
4.4 Developmental EtOH exposure and its effect on pathological functions of microglia
As follow-up to our assessment of baseline microglial phenotype at P28, when we challenged P28 visual cortex microglia to respond to a secondary pathological challenge, namely a focal tissue injury, we found that microglia in mice with prior EtOH exposure showed a trend toward a more robust response to the injury. These results, though not statistically significant, could have interesting implications and deserve more investigation in the future. They suggest that despite unperturbed neuronal populations in early adolescent V1b, normal microglial morphology and dynamic motility at baseline, and the absence of transcriptome changes detected within microglia in this brain region and age, the impact of BGS EtOH on microglia can potentially be unmasked by an immune challenge.
The concept that microglia can remain immunologically primed later in life after earlier exposure to an immune stimulus is not without precedent. Recently, it was shown that the combination of prenatal EtOH exposure in rats (dam voluntary drinking for 4 hours/day from gestational day 1 through birth, modeling human first and second trimester exposure) and chronic sciatic nerve constriction injury at 4–5 months of age leads to increased allodynia, increased glial fibrillary acidic protein (GFAP) staining as well as increased IBA-1 staining in the lumbar spinal cord, compared to the effect on these measures of sciatic nerve injury alone (Noor et al., 2017). These differences, supporting the conclusion that the EtOH exposure caused increased pain perception that was coincident with a priming effect on both astrocytes and microglia, were observed long-term, 4 weeks after the nerve constriction injury (Noor et al., 2017). Interestingly, rats exposed only to prenatal EtOH and sham nerve constriction surgery had an allodynia response as well as GFAP and IBA-1 staining in lumbar spinal cord that was not significantly different from that of saccharin and sham surgery rats. These findings indicate that the effects of prenatal EtOH exposure itself appeared minimal and were only unmasked by a secondary injury (Noor et al., 2017).
In addition, literature outside of the FASD field has shown that a combination of early life infection (E. coli at P4) and secondary immune insult (lipopolysaccharide (LPS) in adulthood) can lead to memory impairment in rats that is not observed if animals do not receive the secondary LPS challenge (Bilbo et al., 2005b). This memory impairment after secondary LPS challenge was in fact found to stem from the production of IL-1β by microglia in the hippocampus (Bilbo et al., 2005a; Williamson et al., 2011). EtOH has also been shown to have an exacerbating effect on the immune environment in the brain after secondary challenge. Exposure to high binge levels of EtOH for 10 days in adult mice, followed 1 day later by exposure to the viral mimetic, poly:IC, resulted in higher levels of Tnf-α, IL-1β, IL-6, and Mcp-1 mRNA detected in mouse whole brain homogenate, compared to that detected in the brains of mice exposed only to poly:IC (Qin and Crews, 2012). Similar effects should be evaluated after developmental EtOH exposure to determine whether microglia are truly more responsive to pathological stimuli in EtOH exposed animals. In addition, future in vivo two-photon microscopy studies could examine how LPS administration alters microglial motility with and without BGS EtOH exposure. As a single insult, LPS has been shown to increase both the extension and retraction rates of microglial processes in vivo (Gyoneva et al., 2014). BGS EtOH may further increase microglial process extension and retraction in response to LPS. This additional information would help clarify whether the subtle priming of microglial immune functions after BGS EtOH exposure that we observed is limited to the response to local injury, or could also be applied to how microglia respond to an insult that causes a more global proinflammatory environment within the brain (Qin et al., 2007).
One possibility that we did not address in this study is that MD can act as a second hit, changing microglial profiles in a way that inhibits plasticity. To begin to examine this scenario, we performed immunohistochemistry for IBA-1 on contralateral V1b fixed sections collected from SAL or EtOH mice that were either non-deprived (ND) or monocularly deprived for 4 days (4D MD) (S5 Fig.). We found that neither microglial density (F(3)= 1.11, p=0.373, one-way ANOVA) nor branching complexity (F(3)= 1.483, p= 0.255, two-way ANOVA repeated measures) were significantly altered between ND and 4D MD animals, regardless of prior EtOH exposure. This shows that 4 days of MD does not induce any obvious change in microglial proliferation, migration, or ramification in EtOH exposed animals at a time when plasticity is impaired. While more work will be necessary to determine whether more subtle microglial characteristics and functions are altered by MD in BGS EtOH exposed animals, this preliminary result suggests that MD is unlikely to act as a second hit that profoundly alters microglial behavior.
If visual cortex microglia are truly primed by prior EtOH exposure, it is surprising that no signature of such priming was observed in their transcriptome. However, it is also possible that a transcriptome-level assessment does not accurately represent key changes in microglia that could support priming. For example, differences in posttranslational modifications or in miRNA expression could elicit changes in microglial response but would not be detected in our RNA-seq analysis (Ignacio et al., 2014; Pena-Philippides et al., 2016). BGS EtOH exposure could also have a long-term effect on how proteins or other chemical factors are being released by nonmicroglial cell types after injury challenge, therefore causing the difference seen within an in vivo context to be missed in an analysis of ex vivo isolated microglia. For example, it is known that microglial response to laser ablation injury is mediated through the release of ATP from damaged neurons (Davalos et al., 2005; Haynes et al., 2006). Perhaps in BGS EtOH mice, the laser ablation injury causes increased propagation of the ATP signal from damaged cells, triggering microglia to respond more vigorously. Such possibilities are beyond the scope of this study, but would be important avenues for future investigation.
4.5 Developmental EtOH exposure affects plasticity in a microglia-independent manner
Microglia have long been maligned as instigators of neuroinflammation and contributors to declining brain function in a number of neurological disorders. Similarly, EtOH has been shown at developmental, adolescent, and adult ages to trigger microglial activation and neuroinflammatory responses. In FASD, neuroinflammation during development and beyond has been postulated to negatively impact the wiring of neural circuitry. In light of the current burgeoning increase in studies addressing the diverse functions of microglia, it is also clear that non-pathological microglia have important roles in neurodevelopment and neural circuit remodeling, which could be impacted by prior EtOH exposure but have thus far not been a main focus of study. Here, we show that a long-term deficit in experience-dependent plasticity results from BGS EtOH exposure in a mouse model. However, this plasticity deficit occurs in the absence of pronounced neuronal apoptosis or perpetual microglial activation in visual cortex. Surprisingly, the physiological profile of microglia is not detectably altered by BGS EtOH exposure.
Our findings suggest that later brain plasticity can be impaired by developmental EtOH exposure via an alternative mechanism that likely does not involve a neuroinflammatory environment at either acute or later time points. While EtOH has many targets in the brain and a number of alternative mechanisms exist, effects of BGS EtOH exposure on astrocytic functions long-term are a likely culprit, since astrocytic secretion of serum response factor (SRF) or the synaptogenic protein hevin has been shown to rescue ODP functions in ferret or mouse EtOH exposure models respectively (Paul and Medina, 2012; Paul et al., 2010; Singh et al., 2016). It is also known that BGS EtOH exposure can lead to long-term decreases in levels of myelin basic protein (MBP) in the mouse corpus callosum, based on earlier (P16) reductions in mature and proliferating oligodendrocyte numbers, even if these populations recover by P50 (Newville et al., 2017). Given that the development of myelin deposition within specific layers of mouse visual cortex at specific ages is known to correlate with the end of the visual critical period (McGee et al., 2005), it is possible that BGS EtOH could cause changes in this delicate trajectory of myelination that could contribute to reductions in ODP. Thus, future studies should explore whether changes to the physiological functions of other glial cells as well as neuronal cell types may be subtly altered long-term by developmental EtOH exposure.
Supplementary Material
S1 Fig. Male and female mouse weight gain. Weight gain of SEP, SAL, and EtOH (A) male and (B) female C57BL/6 mice from a subset of experimental litters. For males, SEP n=7, SAL n=11, EtOH n=19. On P27 only, body weights of male EtOH mice were significantly lower than body weights of both male SAL mice #= p<0.05 and male SEP mice $= p<0.0001 (two-way ANOVA, repeated measures, Bonferroni post hocs, significant main effect of exposure group F(2,34)= 4.41, p=0.02). For females, SEP n=5, SAL n=15, EtOH n=15. On P27 only, female EtOH mice were significantly lower in weight than female SAL mice †= p<0.01 (two-way ANOVA repeated measures, Bonferroni post-hocs, nearly significant main effect of exposure group on body weight F(2,32)= 2.95, p= 0.067). Graphs show mean ± SEM.
S2 Fig. Microglial CD68 expression is unaffected by BGS EtOH at either P10 or P28. (A) P10 and (B) P28, SEP, SAL, and EtOH coronal sections containing layer II/III V1b immunoreacted for IBA-1 (green) and CD68 (red). (C) The percentage of microglial area (defined as IBA-1 positive) that was occupied by CD68 staining was quantified in layer II/III V1b at P10 and (D) P28. Dots indicate individual animals. One way ANOVAs to compare among SEP, SAL, and EtOH animals at each age yielded no significant differences (P28: F(2)= 2.305, p= 0.134 and P10: F(2)= 0.5006, p= 0.6206). P10 SEP (n=3), P10 SAL (n=6), P10 EtOH (n=4), P28 SEP (n=5), P28 SAL (n=6), P28 EtOH (n=7). Scale bar = 50μm. Graphs show mean ± SEM.
S3 Fig. Sample-to-sample distances. Heat map showing the hierarchically clustered Euclidean distances between samples from the DESeq2 regularized log transformation of the normalized count data for all genes. This correlation matrix was generated from the same experiment represented in Fig. 8 (GEO: GSE97464) and shows that samples did not cluster based on treatment group when all genes were included for analysis of sample relatedness.
S4 Fig. Microglial density in P5 V1b is unchanged 24 hours after high binge EtOH exposure. (A) Representative epifluorescent images of microglia in P5 V1b from SEP, SAL, and EtOH animals. (B) An example marked imaged used for microglial density analysis in which cortical layers II/III, IV, and V/VI were outlined for area measurements and microglial somas were marked with a red dot for density calculations. Microglial density at P5 was not significantly different among SEP, SAL, and EtOH animals in (C) layer II/III, (D) layer IV, or (E) layer V/VI of V1b (one-way ANOVAs). Dots are individual animals, with n=4 SEP, n=5 SAL, and n= 4 EtOH animals represented in this experiment. Scale bar = 50μm. Graphs show mean ± SEM.
S5 Fig. Monocular deprivation does not affect microglial density or branching in V1b after BGS EtOH exposure. (A) Representative confocal images of IBA-1 immunoreactive microglia at 40× in contralateral V1b layer II/III from SAL and EtOH animals. 4D MD animals were monocularly deprived on P28 ± 1 day and perfused 4 days later while ND animals were perfused on P28 ± 2 days. Scale bar = 50μm. (B) Microglial density was not significantly different in SAL and EtOH animals, regardless of deprivation treatment (one-way ANOVA, Bonferroni post-hocs). Density measurements were made on 20× maximum Z projections (not shown). (C) For Sholl analysis, 15 total randomly selected microglia per animal were binarized and thresholded prior to measurement of the number of intersections at set concentric distances from the soma of each cell. No significant differences in process ramification were observed between SAL ND, EtOH ND, SAL 4D MD and EtOH 4D MD microglia (repeated measures two-way ANOVA, Bonferroni post-hocs). SAL ND n=4, EtOH ND n=5, SAL 4D MD n=5, EtOH 4D MD n=6 for both density and branching complexity experiments. Graphs show mean † SEM.
S1 Video. Microglial response to focal tissue injury in early adolescent visual cortex of a representative SEP mouse. Over 55 minutes, processes from surrounding microglia encompass the central injury core. Scale bar = 20μm.
S2 Video. Microglial response to focal tissue injury in early adolescent visual cortex of a representative SAL mouse. Over 55 minutes, processes from surrounding microglia encompass the central injury core. Scale bar= 20μm.
S3 Video. Microglial response to focal tissue injury in early adolescent visual cortex of a representative EtOH mouse. Over 55 minutes, processes from surrounding microglia encompass the central injury core. When this example is compared to the SEP and SAL examples shown in Supplemental Videos 3 and 4 respectively, the number of pixels representing microglial processes and the rate at which these processes surround the injury core is faster and more robust. Scale bar= 20μm.
S1 Table. This table shows the results from the Bonferroni post-hoc analyses of the data graphed in Fig. 2C.
Highlights.
Adolescent visual cortex plasticity is impaired by developmental ethanol exposure.
Ethanol-induced changes in microglial phenotype and behavior were investigated.
Neither microglial activation nor neuronal death were detected in visual cortex.
Ethanol causes impaired plasticity independently of changes in microglial function.
Acknowledgments
We thank Judith Sharp and the laboratory of Linda Spear for completing the blood and brain EtOH concentration analyses. We thank Matthew Cochran and the URMC Flow Cytometry Core, as well as Michelle Zanche and the URMC Genomics Research Core for their expert consultation and technical assistance. We thank Fátima Rivera-Escalera for excellent training in FACS preparation, as well as Grayson Sipe for training on the iOS technique and sharing code for microglial motility index analysis. We also thank Jianhua Cang for sharing Matlab code for ODI analysis, Holly Beaulac for assistance with the postnatal day 5 microglial density analysis in S4 Fig., and Hanna Batchelor for assistance with Sholl analysis in S5 Fig. Thanks also to Linda Spear and Rebecca Lowery for providing detailed comments on the manuscript text. This research was supported by the National Institutes of Health (NIH) grants R01 EY019277 (AKM), R21 AA020855 (AKM), T32 ES007026 (ELW), F31 AA024346 (ELW), and the URMC Graduate Education Dean’s Fund (ELW).
Footnotes
Publisher's Disclaimer: This is a PDF file of an unedited manuscript that has been accepted for publication. As a service to our customers we are providing this early version of the manuscript. The manuscript will undergo copyediting, typesetting, and review of the resulting proof before it is published in its final citable form. Please note that during the production process errors may be discovered which could affect the content, and all legal disclaimers that apply to the journal pertain.
Author Contributions:
E.L.W. and A.K.M. conceived the project and designed the experiments. E.L.W., N.M.L., V.A.H., and C.E.L. all contributed to data collection. N.M.L. performed experiments, imaging, and analysis presented in Fig. 3 and Fig. 9 as well as experiments and imaging for S2 Fig. and S4 Fig. V.A.H. assisted with experiments, image collection, and completed all analysis for Fig. 4. C.E.L. assisted with collection of animal weight gain data in Fig. 1 and S1 Fig., as well as brain weight data in Fig. 10. H.R.M. helped conceive of and create Fig. 8. J.R.M and J.M.A. completed the analysis and also helped interpret data presented in Fig. 8. J.R.M. generated S3 Fig. and was responsible (jointly with E.L.W.) for the submission of RNA-seq data to the Gene Expression Omnibus (GEO) repository. E.L.W. completed all other experiments, imaging, and analysis. E.L.W. and A.K.M. wrote the first draft of the manuscript. All authors contributed to the final manuscript.
References
- Ahlers KE, Karacay B, Fuller L, Bonthius DJ, Dailey ME. Transient activation of microglia following acute alcohol exposure in developing mouse neocortex is primarily driven by BAX-dependent neurodegeneration. Glia. 2015;63:1694–1713. doi: 10.1002/glia.22835. [DOI] [PMC free article] [PubMed] [Google Scholar]
- Arnoux I, Hoshiko M, Mandavy L, Avignone E, Yamamoto N, Audinat E. Adaptive phenotype of microglial cells during the normal postnatal development of the somatosensory “Barrel” cortex. Glia. 2013;61:1582–1594. doi: 10.1002/glia.22503. [DOI] [PubMed] [Google Scholar]
- Bennett ML, Bennett FC, Liddelow SA, Ajami B, Zamanian JL, Fernhoff NB, Mulinyawe SB, Bohlen CJ, Adil A, Tucker A, Weissman IL, Chang EF, Li G, Grant GA, Hayden Gephart MG, Barres BA. New tools for studying microglia in the mouse and human CNS. Proceedings of the National Academy of Sciences of the United States of America. 2016;113:E1738–1746. doi: 10.1073/pnas.1525528113. [DOI] [PMC free article] [PubMed] [Google Scholar]
- Bilbo SD, Biedenkapp JC, Der-Avakian A, Watkins LR, Rudy JW, Maier SF. Neonatal infection-induced memory impairment after lipopolysaccharide in adulthood is prevented via caspase-1 inhibition. The Journal of neuroscience: the official journal of the Society for Neuroscience. 2005a;25:8000–8009. doi: 10.1523/JNEUROSCI.1748-05.2005. [DOI] [PMC free article] [PubMed] [Google Scholar]
- Bilbo SD, Levkoff LH, Mahoney JH, Watkins LR, Rudy JW, Maier SF. Neonatal infection induces memory impairments following an immune challenge in adulthood. Behav Neurosci. 2005b;119:293–301. doi: 10.1037/0735-7044.119.1.293. [DOI] [PubMed] [Google Scholar]
- Block ML, Zecca L, Hong JS. Microglia-mediated neurotoxicity: uncovering the molecular mechanisms. Nat Rev Neurosci. 2007;8:57–69. doi: 10.1038/nrn2038. [DOI] [PubMed] [Google Scholar]
- Bolger AM, Lohse M, Usadel B. Trimmomatic: a flexible trimmer for Illumina sequence data. Bioinformatics. 2014;30:2114–2120. doi: 10.1093/bioinformatics/btu170. [DOI] [PMC free article] [PubMed] [Google Scholar]
- Boschen KE, Ruggiero MJ, Klintsova AY. Neonatal binge alcohol exposure increases microglial activation in the developing rat hippocampus. Neuroscience. 2016;324:355–366. doi: 10.1016/j.neuroscience.2016.03.033. [DOI] [PMC free article] [PubMed] [Google Scholar]
- Boyadjieva NI, Sarkar DK. Microglia play a role in ethanol-induced oxidative stress and apoptosis in developing hypothalamic neurons. Alcoholism, clinical and experimental research. 2013;37:252–262. doi: 10.1111/j.1530-0277.2012.01889.x. [DOI] [PMC free article] [PubMed] [Google Scholar]
- Coleman LG, Jr, Oguz I, Lee J, Styner M, Crews FT. Postnatal day 7 ethanol treatment causes persistent reductions in adult mouse brain volume and cortical neurons with sex specific effects on neurogenesis. Alcohol. 2012;46:603–612. doi: 10.1016/j.alcohol.2012.01.003. [DOI] [PMC free article] [PubMed] [Google Scholar]
- Davalos D, Grutzendler J, Yang G, Kim JV, Zuo Y, Jung S, Littman DR, Dustin ML, Gan WB. ATP mediates rapid microglial response to local brain injury in vivo. Nature neuroscience. 2005;8:752–758. doi: 10.1038/nn1472. [DOI] [PubMed] [Google Scholar]
- Dobbing J, Sands J. Comparative aspects of the brain growth spurt. Early human development. 1979;3:79–83. doi: 10.1016/0378-3782(79)90022-7. [DOI] [PubMed] [Google Scholar]
- Dobin A, Davis CA, Schlesinger F, Drenkow J, Zaleski C, Jha S, Batut P, Chaisson M, Gingeras TR. STAR: ultrafast universal RNA-seq aligner. Bioinformatics. 2013;29:15–21. doi: 10.1093/bioinformatics/bts635. [DOI] [PMC free article] [PubMed] [Google Scholar]
- Doney R, Lucas BR, Watkins RE, Tsang TW, Sauer K, Howat P, Latimer J, Fitzpatrick JP, Oscar J, Carter M, Elliott EJ. Visual-motor integration, visual perception, and fine motor coordination in a population of children with high levels of Fetal Alcohol Spectrum Disorder. Research in developmental disabilities. 2016;55:346–357. doi: 10.1016/j.ridd.2016.05.009. [DOI] [PubMed] [Google Scholar]
- Drew PD, Johnson JW, Douglas JC, Phelan KD, Kane CJ. Pioglitazone blocks ethanol induction of microglial activation and immune responses in the hippocampus, cerebellum, and cerebral cortex in a mouse model of fetal alcohol spectrum disorders. Alcoholism, clinical and experimental research. 2015;39:445–454. doi: 10.1111/acer.12639. [DOI] [PMC free article] [PubMed] [Google Scholar]
- Dursun I, Jakubowska-Dogru E, Elibol-Can B, van der List D, Chapman B, Qi L, Berman RF. Effects of early postnatal alcohol exposure on the developing retinogeniculate projections in C57BL/6 mice. Alcohol. 2013;47:173–179. doi: 10.1016/j.alcohol.2012.12.013. [DOI] [PMC free article] [PubMed] [Google Scholar]
- Eyo UB, Dailey ME. Microglia: key elements in neural development, plasticity, and pathology. Journal of neuroimmune pharmacology: the official journal of the Society on NeuroImmune Pharmacology. 2013;8:494–509. doi: 10.1007/s11481-013-9434-z. [DOI] [PMC free article] [PubMed] [Google Scholar]
- Fagiolini M, Fritschy JM, Low K, Mohler H, Rudolph U, Hensch TK. Specific GABAA circuits for visual cortical plasticity. Science. 2004;303:1681–1683. doi: 10.1126/science.1091032. [DOI] [PubMed] [Google Scholar]
- Frenkel MY, Bear MF. How monocular deprivation shifts ocular dominance in visual cortex of young mice. Neuron. 2004;44:917–923. doi: 10.1016/j.neuron.2004.12.003. [DOI] [PubMed] [Google Scholar]
- Fu R, Shen Q, Xu P, Luo JJ, Tang Y. Phagocytosis of microglia in the central nervous system diseases. Mol Neurobiol. 2014;49:1422–1434. doi: 10.1007/s12035-013-8620-6. [DOI] [PMC free article] [PubMed] [Google Scholar]
- Ginhoux F, Greter M, Leboeuf M, Nandi S, See P, Gokhan S, Mehler MF, Conway SJ, Ng LG, Stanley ER, Samokhvalov IM, Merad M. Fate mapping analysis reveals that adult microglia derive from primitive macrophages. Science. 2010;330:841–845. doi: 10.1126/science.1194637. [DOI] [PMC free article] [PubMed] [Google Scholar]
- Grabert K, Michoel T, Karavolos MH, Clohisey S, Baillie JK, Stevens MP, Freeman TC, Summers KM, McColl BW. Microglial brain region-dependent diversity and selective regional sensitivities to aging. Nature neuroscience. 2016;19:504–516. doi: 10.1038/nn.4222. [DOI] [PMC free article] [PubMed] [Google Scholar]
- Guizzetti M, Zhang X, Goeke C, Gavin DP. Glia and neurodevelopment: focus on fetal alcohol spectrum disorders. Frontiers in pediatrics. 2014;2:123. doi: 10.3389/fped.2014.00123. [DOI] [PMC free article] [PubMed] [Google Scholar]
- Gyoneva S, Davalos D, Biswas D, Swanger SA, Garnier-Amblard E, Loth F, Akassoglou K, Traynelis SF. Systemic inflammation regulates microglial responses to tissue damage in vivo. Glia. 2014;62:1345–1360. doi: 10.1002/glia.22686. [DOI] [PMC free article] [PubMed] [Google Scholar]
- Harrison JK, Jiang Y, Chen S, Xia Y, Maciejewski D, McNamara RK, Streit WJ, Salafranca MN, Adhikari S, Thompson DA, Botti P, Bacon KB, Feng L. Role for neuronally derived fractalkine in mediating interactions between neurons and CX3CR1-expressing microglia. Proceedings of the National Academy of Sciences of the United States of America. 1998;95:10896–10901. doi: 10.1073/pnas.95.18.10896. [DOI] [PMC free article] [PubMed] [Google Scholar]
- Haynes SE, Hollopeter G, Yang G, Kurpius D, Dailey ME, Gan WB, Julius D. The P2Y12 receptor regulates microglial activation by extracellular nucleotides. Nature neuroscience. 2006;9:1512–1519. doi: 10.1038/nn1805. [DOI] [PubMed] [Google Scholar]
- He J, Crews FT. Increased MCP-1 and microglia in various regions of the human alcoholic brain. Experimental neurology. 2008;210:349–358. doi: 10.1016/j.expneurol.2007.11.017. [DOI] [PMC free article] [PubMed] [Google Scholar]
- Hughes V. Microglia: The constant gardeners. Nature. 2012;485:570–572. doi: 10.1038/485570a. [DOI] [PubMed] [Google Scholar]
- Idrus NM, Napper RM. Acute and long-term Purkinje cell loss following a single ethanol binge during the early third trimester equivalent in the rat. Alcoholism, clinical and experimental research. 2012;36:1365–1373. doi: 10.1111/j.1530-0277.2012.01743.x. [DOI] [PubMed] [Google Scholar]
- Ieraci A, Herrera DG. Nicotinamide protects against ethanol-induced apoptotic neurodegeneration in the developing mouse brain. PLoS medicine. 2006;3:e101. doi: 10.1371/journal.pmed.0030101. [DOI] [PMC free article] [PubMed] [Google Scholar]
- Ignacio C, Mooney SM, Middleton FA. Effects of Acute Prenatal Exposure to Ethanol on microRNA Expression are Ameliorated by Social Enrichment. Frontiers in pediatrics. 2014;2:103. doi: 10.3389/fped.2014.00103. [DOI] [PMC free article] [PubMed] [Google Scholar]
- Ikonomidou C, Bittigau P, Ishimaru MJ, Wozniak DF, Koch C, Genz K, Price MT, Stefovska V, Horster F, Tenkova T, Dikranian K, Olney JW. Ethanol-induced apoptotic neurodegeneration and fetal alcohol syndrome. Science. 2000;287:1056–1060. doi: 10.1126/science.287.5455.1056. [DOI] [PubMed] [Google Scholar]
- Jung S, Aliberti J, Graemmel P, Sunshine MJ, Kreutzberg GW, Sher A, Littman DR. Analysis of fractalkine receptor CX(3)CR1 function by targeted deletion and green fluorescent protein reporter gene insertion. Molecular and cellular biology. 2000;20:4106–4114. doi: 10.1128/mcb.20.11.4106-4114.2000. [DOI] [PMC free article] [PubMed] [Google Scholar]
- Kalatsky VA, Stryker MP. New paradigm for optical imaging: temporally encoded maps of intrinsic signal. Neuron. 2003;38:529–545. doi: 10.1016/s0896-6273(03)00286-1. [DOI] [PubMed] [Google Scholar]
- Kane CJ, Phelan KD, Han L, Smith RR, Xie J, Douglas JC, Drew PD. Protection of neurons and microglia against ethanol in a mouse model of fetal alcohol spectrum disorders by peroxisome proliferator-activated receptor-gamma agonists. Brain, behavior, and immunity. 2011;25(Suppl 1):S137–145. doi: 10.1016/j.bbi.2011.02.016. [DOI] [PMC free article] [PubMed] [Google Scholar]
- Kelly EA, Majewska AK. Chronic imaging of mouse visual cortex using a thinned-skull preparation. Journal of visualized experiments: JoVE. 2010 doi: 10.3791/2060. [DOI] [PMC free article] [PubMed] [Google Scholar]
- Lantz CL, Sipe GO, Wong EL, Majewska AK, Medina AE. Effects of Developmental Alcohol Exposure on Potentiation and Depression of Visual Cortex Responses. Alcoholism, clinical and experimental research. 2015;39:1434–1442. doi: 10.1111/acer.12775. [DOI] [PMC free article] [PubMed] [Google Scholar]
- Lantz CL, Wang W, Medina AE. Early alcohol exposure disrupts visual cortex plasticity in mice. International journal of developmental neuroscience: the official journal of the International Society for Developmental Neuroscience. 2012;30:351–357. doi: 10.1016/j.ijdevneu.2012.05.001. [DOI] [PMC free article] [PubMed] [Google Scholar]
- Lowery RL, Tremblay ME, Hopkins BE, Majewska AK. The microglial fractalkine receptor is not required for activity-dependent plasticity in the mouse visual system. Glia. 2017;00:000–000. doi: 10.1002/glia.23192. [DOI] [PMC free article] [PubMed] [Google Scholar]
- Mataga N, Mizuguchi Y, Hensch TK. Experience-dependent pruning of dendritic spines in visual cortex by tissue plasminogen activator. Neuron. 2004;44:1031–1041. doi: 10.1016/j.neuron.2004.11.028. [DOI] [PubMed] [Google Scholar]
- Mattson SN, Goodman AM, Caine C, Delis DC, Riley EP. Executive functioning in children with heavy prenatal alcohol exposure. Alcoholism, clinical and experimental research. 1999;23:1808–1815. [PubMed] [Google Scholar]
- Mattson SN, Riley EP. Implicit and explicit memory functioning in children with heavy prenatal alcohol exposure. Journal of the International Neuropsychological Society: JINS. 1999;5:462–471. doi: 10.1017/s1355617799555082. [DOI] [PubMed] [Google Scholar]
- May PA, Baete A, Russo J, Elliott AJ, Blankenship J, Kalberg WO, Buckley D, Brooks M, Hasken J, Abdul-Rahman O, Adam MP, Robinson LK, Manning M, Hoyme HE. Prevalence and characteristics of fetal alcohol spectrum disorders. Pediatrics. 2014;134:855–866. doi: 10.1542/peds.2013-3319. [DOI] [PMC free article] [PubMed] [Google Scholar]
- McClain JA, Morris SA, Deeny MA, Marshall SA, Hayes DM, Kiser ZM, Nixon K. Adolescent binge alcohol exposure induces long-lasting partial activation of microglia. Brain, behavior, and immunity. 2011;25(Suppl 1):S120–128. doi: 10.1016/j.bbi.2011.01.006. [DOI] [PMC free article] [PubMed] [Google Scholar]
- McGee AW, Yang Y, Fischer QS, Daw NW, Strittmatter SM. Experience-driven plasticity of visual cortex limited by myelin and Nogo receptor. Science. 2005;309:2222–2226. doi: 10.1126/science.1114362. [DOI] [PMC free article] [PubMed] [Google Scholar]
- Medina AE, Krahe TE, Coppola DM, Ramoa AS. Neonatal alcohol exposure induces long-lasting impairment of visual cortical plasticity in ferrets. The Journal of neuroscience: the official journal of the Society for Neuroscience. 2003;23:10002–10012. doi: 10.1523/JNEUROSCI.23-31-10002.2003. [DOI] [PMC free article] [PubMed] [Google Scholar]
- Medina AE, Ramoa AS. Early alcohol exposure impairs ocular dominance plasticity throughout the critical period. Brain research Developmental brain research. 2005;157:107–111. doi: 10.1016/j.devbrainres.2005.03.012. [DOI] [PubMed] [Google Scholar]
- Melief J, Schuurman KG, van de Garde MD, Smolders J, van Eijk M, Hamann J, Huitinga I. Microglia in normal appearing white matter of multiple sclerosis are alerted but immunosuppressed. Glia. 2013;61:1848–1861. doi: 10.1002/glia.22562. [DOI] [PubMed] [Google Scholar]
- Miyamoto A, Wake H, Ishikawa AW, Eto K, Shibata K, Murakoshi H, Koizumi S, Moorhouse AJ, Yoshimura Y, Nabekura J. Microglia contact induces synapse formation in developing somatosensory cortex. Nature communications. 2016;7:12540. doi: 10.1038/ncomms12540. [DOI] [PMC free article] [PubMed] [Google Scholar]
- Morton RA, Diaz MR, Topper LA, Valenzuela CF. Construction of vapor chambers used to expose mice to alcohol during the equivalent of all three trimesters of human development. Journal of visualized experiments: JoVE. 2014 doi: 10.3791/51839. [DOI] [PMC free article] [PubMed] [Google Scholar]
- Mrsic-Flogel TD, Hofer SB, Ohki K, Reid RC, Bonhoeffer T, Hubener M. Homeostatic regulation of eye-specific responses in visual cortex during ocular dominance plasticity. Neuron. 2007;54:961–972. doi: 10.1016/j.neuron.2007.05.028. [DOI] [PubMed] [Google Scholar]
- Newville J, Valenzuela CF, Li L, Jantzie LL, Cunningham LA. Acute oligodendrocyte loss with persistent white matter injury in a third trimester equivalent mouse model of fetal alcohol spectrum disorder. Glia. 2017;65:1317–1332. doi: 10.1002/glia.23164. [DOI] [PMC free article] [PubMed] [Google Scholar]
- Nimmerjahn A, Kirchhoff F, Helmchen F. Resting microglial cells are highly dynamic surveillants of brain parenchyma in vivo. Science. 2005;308:1314–1318. doi: 10.1126/science.1110647. [DOI] [PubMed] [Google Scholar]
- Noor S, Sanchez JJ, Vanderwall AG, Sun MS, Maxwell JR, Davies S, Jantzie LL, Petersen TR, Savage DD, Milligan ED. Prenatal alcohol exposure potentiates chronic neuropathic pain, spinal glial and immune cell activation and alters sciatic nerve and DRG cytokine levels. Brain, behavior, and immunity. 2017;61:80–95. doi: 10.1016/j.bbi.2016.12.016. [DOI] [PMC free article] [PubMed] [Google Scholar]
- Olney JW, Tenkova T, Dikranian K, Muglia LJ, Jermakowicz WJ, D’Sa C, Roth KA. Ethanol-induced caspase-3 activation in the in vivo developing mouse brain. Neurobiology of disease. 2002a;9:205–219. doi: 10.1006/nbdi.2001.0475. [DOI] [PubMed] [Google Scholar]
- Olney JW, Tenkova T, Dikranian K, Qin YQ, Labruyere J, Ikonomidou C. Ethanol-induced apoptotic neurodegeneration in the developing C57BL/6 mouse brain. Brain research Developmental brain research. 2002b;133:115–126. doi: 10.1016/s0165-3806(02)00279-1. [DOI] [PubMed] [Google Scholar]
- Pang Y, Frantz KA, Roberts DK. Association of refractive error with optic nerve hypoplasia. Ophthalmic Physiol Opt. 2015;35:570–576. doi: 10.1111/opo.12229. [DOI] [PubMed] [Google Scholar]
- Paolicelli RC, Bisht K, Tremblay ME. Fractalkine regulation of microglial physiology and consequences on the brain and behavior. Frontiers in cellular neuroscience. 2014;8:129. doi: 10.3389/fncel.2014.00129. [DOI] [PMC free article] [PubMed] [Google Scholar]
- Paolicelli RC, Bolasco G, Pagani F, Maggi L, Scianni M, Panzanelli P, Giustetto M, Ferreira TA, Guiducci E, Dumas L, Ragozzino D, Gross CT. Synaptic pruning by microglia is necessary for normal brain development. Science. 2011;333:1456–1458. doi: 10.1126/science.1202529. [DOI] [PubMed] [Google Scholar]
- Paul AP, Medina AE. Overexpression of serum response factor in astrocytes improves neuronal plasticity in a model of early alcohol exposure. Neuroscience. 2012;221:193–202. doi: 10.1016/j.neuroscience.2012.06.045. [DOI] [PMC free article] [PubMed] [Google Scholar]
- Paul AP, Pohl-Guimaraes F, Krahe TE, Filgueiras CC, Lantz CL, Colello RJ, Wang W, Medina AE. Overexpression of serum response factor restores ocular dominance plasticity in a model of fetal alcohol spectrum disorders. The Journal of neuroscience: the official journal of the Society for Neuroscience. 2010;30:2513–2520. doi: 10.1523/JNEUROSCI.5840-09.2010. [DOI] [PMC free article] [PubMed] [Google Scholar]
- Pena-Philippides JC, Caballero-Garrido E, Lordkipanidze T, Roitbak T. In vivo inhibition of miR-155 significantly alters post-stroke inflammatory response. Journal of neuroinflammation. 2016;13:287. doi: 10.1186/s12974-016-0753-x. [DOI] [PMC free article] [PubMed] [Google Scholar]
- Pino PA, Cardona AE. Isolation of brain and spinal cord mononuclear cells using percoll gradients. Journal of visualized experiments: JoVE. 2011 doi: 10.3791/2348. [DOI] [PMC free article] [PubMed] [Google Scholar]
- Pizzorusso T, Medini P, Berardi N, Chierzi S, Fawcett JW, Maffei L. Reactivation of ocular dominance plasticity in the adult visual cortex. Science. 2002;298:1248–1251. doi: 10.1126/science.1072699. [DOI] [PubMed] [Google Scholar]
- Qin L, Crews FT. Chronic ethanol increases systemic TLR3 agonist-induced neuroinflammation and neurodegeneration. Journal of neuroinflammation. 2012;9:130. doi: 10.1186/1742-2094-9-130. [DOI] [PMC free article] [PubMed] [Google Scholar]
- Qin L, Wu X, Block ML, Liu Y, Breese GR, Hong JS, Knapp DJ, Crews FT. Systemic LPS causes chronic neuroinflammation and progressive neurodegeneration. Glia. 2007;55:453–462. doi: 10.1002/glia.20467. [DOI] [PMC free article] [PubMed] [Google Scholar]
- Ramirez RL, Varlinskaya EI, Spear LP. Effect of the selective NMDA NR2B antagonist, ifenprodil, on acute tolerance to ethanol-induced motor impairment in adolescent and adult rats. Alcoholism, clinical and experimental research. 2011;35:1149–1159. doi: 10.1111/j.1530-0277.2011.01448.x. [DOI] [PMC free article] [PubMed] [Google Scholar]
- Rema V, Ebner FF. Effect of enriched environment rearing on impairments in cortical excitability and plasticity after prenatal alcohol exposure. The Journal of neuroscience: the official journal of the Society for Neuroscience. 1999;19:10993–11006. doi: 10.1523/JNEUROSCI.19-24-10993.1999. [DOI] [PMC free article] [PubMed] [Google Scholar]
- Rohan Walker F, Yirmiya R. Microglia, physiology and behavior: A brief commentary. Brain, behavior, and immunity. 2016;55:1–5. doi: 10.1016/j.bbi.2016.03.006. [DOI] [PubMed] [Google Scholar]
- Sakata-Haga H, Dominguez HD, Sei H, Fukui Y, Riley EP, Thomas JD. Alterations in circadian rhythm phase shifting ability in rats following ethanol exposure during the third trimester brain growth spurt. Alcoholism, clinical and experimental research. 2006;30:899–907. doi: 10.1111/j.1530-0277.2006.00105.x. [DOI] [PubMed] [Google Scholar]
- Schafer DP, Lehrman EK, Kautzman AG, Koyama R, Mardinly AR, Yamasaki R, Ransohoff RM, Greenberg ME, Barres BA, Stevens B. Microglia sculpt postnatal neural circuits in an activity and complement-dependent manner. Neuron. 2012;74:691–705. doi: 10.1016/j.neuron.2012.03.026. [DOI] [PMC free article] [PubMed] [Google Scholar]
- Singh SK, Stogsdill JA, Pulimood NS, Dingsdale H, Kim YH, Pilaz LJ, Kim IH, Manhaes AC, Rodrigues WS, Jr, Pamukcu A, Enustun E, Ertuz Z, Scheiffele P, Soderling SH, Silver DL, Ji RR, Medina AE, Eroglu C. Astrocytes Assemble Thalamocortical Synapses by Bridging NRX1alpha and NL1 via Hevin. Cell. 2016;164:183–196. doi: 10.1016/j.cell.2015.11.034. [DOI] [PMC free article] [PubMed] [Google Scholar]
- Sipe GO, Lowery RL, Tremblay ME, Kelly EA, Lamantia CE, Majewska AK. Microglial P2Y12 is necessary for synaptic plasticity in mouse visual cortex. Nature communications. 2016;7:10905. doi: 10.1038/ncomms10905. [DOI] [PMC free article] [PubMed] [Google Scholar]
- Sokol RJ, Delaney-Black V, Nordstrom B. Fetal alcohol spectrum disorder. Jama. 2003;290:2996–2999. doi: 10.1001/jama.290.22.2996. [DOI] [PubMed] [Google Scholar]
- Stephen JM, Kodituwakku PW, Kodituwakku EL, Romero L, Peters AM, Sharadamma NM, Caprihan A, Coffman BA. Delays in auditory processing identified in preschool children with FASD. Alcoholism, clinical and experimental research. 2012;36:1720–1727. doi: 10.1111/j.1530-0277.2012.01769.x. [DOI] [PMC free article] [PubMed] [Google Scholar]
- Streissguth AP, Sampson PD, Olson HC, Bookstein FL, Barr HM, Scott M, Feldman J, Mirsky AF. Maternal drinking during pregnancy: attention and short-term memory in 14-year-old offspring–a longitudinal prospective study. Alcoholism, clinical and experimental research. 1994;18:202–218. doi: 10.1111/j.1530-0277.1994.tb00904.x. [DOI] [PubMed] [Google Scholar]
- Stromland K. Ocular involvement in the fetal alcohol syndrome. Surv Ophthalmol. 1987;31:277–284. doi: 10.1016/0039-6257(87)90028-2. [DOI] [PubMed] [Google Scholar]
- Stromland K. Visual impairment and ocular abnormalities in children with fetal alcohol syndrome. Addict Biol. 2004;9:153–157. doi: 10.1080/13556210410001717024. discussion 159–160. [DOI] [PubMed] [Google Scholar]
- Topper LA, Baculis BC, Valenzuela CF. Exposure of neonatal rats to alcohol has differential effects on neuroinflammation and neuronal survival in the cerebellum and hippocampus. Journal of neuroinflammation. 2015;12:160. doi: 10.1186/s12974-015-0382-9. [DOI] [PMC free article] [PubMed] [Google Scholar]
- Trachtenberg JT, Trepel C, Stryker MP. Rapid extragranular plasticity in the absence of thalamocortical plasticity in the developing primary visual cortex. Science. 2000;287:2029–2032. doi: 10.1126/science.287.5460.2029. [DOI] [PMC free article] [PubMed] [Google Scholar]
- Tremblay ME, Lowery RL, Majewska AK. Microglial interactions with synapses are modulated by visual experience. PLoS biology. 2010;8:e1000527. doi: 10.1371/journal.pbio.1000527. [DOI] [PMC free article] [PubMed] [Google Scholar]
- Tremblay ME, Stevens B, Sierra A, Wake H, Bessis A, Nimmerjahn A. The role of microglia in the healthy brain. The Journal of neuroscience: the official journal of the Society for Neuroscience. 2011;31:16064–16069. doi: 10.1523/JNEUROSCI.4158-11.2011. [DOI] [PMC free article] [PubMed] [Google Scholar]
- Tremblay ME, Zettel ML, Ison JR, Allen PD, Majewska AK. Effects of aging and sensory loss on glial cells in mouse visual and auditory cortices. Glia. 2012;60:541–558. doi: 10.1002/glia.22287. [DOI] [PMC free article] [PubMed] [Google Scholar]
- Vernescu RM, Adams RJ, Courage ML. Children with fetal alcohol spectrum disorder show an amblyopia-like pattern of vision deficit. Developmental medicine and child neurology. 2012;54:557–562. doi: 10.1111/j.1469-8749.2012.04254.x. [DOI] [PubMed] [Google Scholar]
- Wake H, Moorhouse AJ, Jinno S, Kohsaka S, Nabekura J. Resting microglia directly monitor the functional state of synapses in vivo and determine the fate of ischemic terminals. The Journal of neuroscience: the official journal of the Society for Neuroscience. 2009;29:3974–3980. doi: 10.1523/JNEUROSCI.4363-08.2009. [DOI] [PMC free article] [PubMed] [Google Scholar]
- Whitcher LT, Klintsova AY. Postnatal binge-like alcohol exposure reduces spine density without affecting dendritic morphology in rat mPFC. Synapse. 2008;62:566–573. doi: 10.1002/syn.20532. [DOI] [PMC free article] [PubMed] [Google Scholar]
- Wiesel TN, Hubel DH. Single-Cell Responses in Striate Cortex of Kittens Deprived of Vision in One Eye. Journal of neurophysiology. 1963;26:1003–1017. doi: 10.1152/jn.1963.26.6.1003. [DOI] [PubMed] [Google Scholar]
- Williamson LL, Sholar PW, Mistry RS, Smith SH, Bilbo SD. Microglia and memory: modulation by early-life infection. The Journal of neuroscience: the official journal of the Society for Neuroscience. 2011;31:15511–15521. doi: 10.1523/JNEUROSCI.3688-11.2011. [DOI] [PMC free article] [PubMed] [Google Scholar]
- Wong EL, Stowell RD, Majewska AK. What the Spectrum of Microglial Functions Can Teach us About Fetal Alcohol Spectrum Disorder. Front Synaptic Neurosci. 2017;9:11. doi: 10.3389/fnsyn.2017.00011. [DOI] [PMC free article] [PubMed] [Google Scholar]
- Wozniak DF, Hartman RE, Boyle MP, Vogt SK, Brooks AR, Tenkova T, Young C, Olney JW, Muglia LJ. Apoptotic neurodegeneration induced by ethanol in neonatal mice is associated with profound learning/memory deficits in juveniles followed by progressive functional recovery in adults. Neurobiology of disease. 2004;17:403–414. doi: 10.1016/j.nbd.2004.08.006. [DOI] [PubMed] [Google Scholar]
- Zhang M, Xu G, Liu W, Ni Y, Zhou W. Role of fractalkine/CX3CR1 interaction in light-induced photoreceptor degeneration through regulating retinal microglial activation and migration. PLoS One. 2012;7:e35446. doi: 10.1371/journal.pone.0035446. [DOI] [PMC free article] [PubMed] [Google Scholar]
- Zhang Y, Chen K, Sloan SA, Bennett ML, Scholze AR, O’Keeffe S, Phatnani HP, Guarnieri P, Caneda C, Ruderisch N, Deng S, Liddelow SA, Zhang C, Daneman R, Maniatis T, Barres BA, Wu JQ. An RNA-sequencing transcriptome and splicing database of glia, neurons, and vascular cells of the cerebral cortex. The Journal of neuroscience: the official journal of the Society for Neuroscience. 2014;34:11929–11947. doi: 10.1523/JNEUROSCI.1860-14.2014. [DOI] [PMC free article] [PubMed] [Google Scholar]
- Zhang Y, Sloan SA, Clarke LE, Caneda C, Plaza CA, Blumenthal PD, Vogel H, Steinberg GK, Edwards MS, Li G, Duncan JA, 3rd, Cheshier SH, Shuer LM, Chang EF, Grant GA, Gephart MG, Barres BA. Purification and Characterization of Progenitor and Mature Human Astrocytes Reveals Transcriptional and Functional Differences with Mouse. Neuron. 2016;89:37–53. doi: 10.1016/j.neuron.2015.11.013. [DOI] [PMC free article] [PubMed] [Google Scholar]
Associated Data
This section collects any data citations, data availability statements, or supplementary materials included in this article.
Supplementary Materials
S1 Fig. Male and female mouse weight gain. Weight gain of SEP, SAL, and EtOH (A) male and (B) female C57BL/6 mice from a subset of experimental litters. For males, SEP n=7, SAL n=11, EtOH n=19. On P27 only, body weights of male EtOH mice were significantly lower than body weights of both male SAL mice #= p<0.05 and male SEP mice $= p<0.0001 (two-way ANOVA, repeated measures, Bonferroni post hocs, significant main effect of exposure group F(2,34)= 4.41, p=0.02). For females, SEP n=5, SAL n=15, EtOH n=15. On P27 only, female EtOH mice were significantly lower in weight than female SAL mice †= p<0.01 (two-way ANOVA repeated measures, Bonferroni post-hocs, nearly significant main effect of exposure group on body weight F(2,32)= 2.95, p= 0.067). Graphs show mean ± SEM.
S2 Fig. Microglial CD68 expression is unaffected by BGS EtOH at either P10 or P28. (A) P10 and (B) P28, SEP, SAL, and EtOH coronal sections containing layer II/III V1b immunoreacted for IBA-1 (green) and CD68 (red). (C) The percentage of microglial area (defined as IBA-1 positive) that was occupied by CD68 staining was quantified in layer II/III V1b at P10 and (D) P28. Dots indicate individual animals. One way ANOVAs to compare among SEP, SAL, and EtOH animals at each age yielded no significant differences (P28: F(2)= 2.305, p= 0.134 and P10: F(2)= 0.5006, p= 0.6206). P10 SEP (n=3), P10 SAL (n=6), P10 EtOH (n=4), P28 SEP (n=5), P28 SAL (n=6), P28 EtOH (n=7). Scale bar = 50μm. Graphs show mean ± SEM.
S3 Fig. Sample-to-sample distances. Heat map showing the hierarchically clustered Euclidean distances between samples from the DESeq2 regularized log transformation of the normalized count data for all genes. This correlation matrix was generated from the same experiment represented in Fig. 8 (GEO: GSE97464) and shows that samples did not cluster based on treatment group when all genes were included for analysis of sample relatedness.
S4 Fig. Microglial density in P5 V1b is unchanged 24 hours after high binge EtOH exposure. (A) Representative epifluorescent images of microglia in P5 V1b from SEP, SAL, and EtOH animals. (B) An example marked imaged used for microglial density analysis in which cortical layers II/III, IV, and V/VI were outlined for area measurements and microglial somas were marked with a red dot for density calculations. Microglial density at P5 was not significantly different among SEP, SAL, and EtOH animals in (C) layer II/III, (D) layer IV, or (E) layer V/VI of V1b (one-way ANOVAs). Dots are individual animals, with n=4 SEP, n=5 SAL, and n= 4 EtOH animals represented in this experiment. Scale bar = 50μm. Graphs show mean ± SEM.
S5 Fig. Monocular deprivation does not affect microglial density or branching in V1b after BGS EtOH exposure. (A) Representative confocal images of IBA-1 immunoreactive microglia at 40× in contralateral V1b layer II/III from SAL and EtOH animals. 4D MD animals were monocularly deprived on P28 ± 1 day and perfused 4 days later while ND animals were perfused on P28 ± 2 days. Scale bar = 50μm. (B) Microglial density was not significantly different in SAL and EtOH animals, regardless of deprivation treatment (one-way ANOVA, Bonferroni post-hocs). Density measurements were made on 20× maximum Z projections (not shown). (C) For Sholl analysis, 15 total randomly selected microglia per animal were binarized and thresholded prior to measurement of the number of intersections at set concentric distances from the soma of each cell. No significant differences in process ramification were observed between SAL ND, EtOH ND, SAL 4D MD and EtOH 4D MD microglia (repeated measures two-way ANOVA, Bonferroni post-hocs). SAL ND n=4, EtOH ND n=5, SAL 4D MD n=5, EtOH 4D MD n=6 for both density and branching complexity experiments. Graphs show mean † SEM.
S1 Video. Microglial response to focal tissue injury in early adolescent visual cortex of a representative SEP mouse. Over 55 minutes, processes from surrounding microglia encompass the central injury core. Scale bar = 20μm.
S2 Video. Microglial response to focal tissue injury in early adolescent visual cortex of a representative SAL mouse. Over 55 minutes, processes from surrounding microglia encompass the central injury core. Scale bar= 20μm.
S3 Video. Microglial response to focal tissue injury in early adolescent visual cortex of a representative EtOH mouse. Over 55 minutes, processes from surrounding microglia encompass the central injury core. When this example is compared to the SEP and SAL examples shown in Supplemental Videos 3 and 4 respectively, the number of pixels representing microglial processes and the rate at which these processes surround the injury core is faster and more robust. Scale bar= 20μm.
S1 Table. This table shows the results from the Bonferroni post-hoc analyses of the data graphed in Fig. 2C.