Abstract
In this paper, we present a novel technique for automatic parametric mesh generation of subject-specific cerebral arterial trees. This technique generates high-quality and anatomically accurate computational meshes for fast blood flow simulations extending the scope of 3D vascular modeling to a large portion of cerebral arterial trees. For this purpose, a parametric meshing procedure was developed to automatically decompose the vascular skeleton, extract geometric features and generate hexahedral meshes using a body-fitted coordinate system that optimally follows the vascular network topology. To validate the anatomical accuracy of the reconstructed vasculature, we performed statistical analysis to quantify the alignment between parametric meshes and raw vascular images using receiver operating characteristic curve. Geometric accuracy evaluation showed an agreement with area under the curves value of 0.87 between the constructed mesh and raw MRA data sets. Parametric meshing yielded on-average, 36.6% and 21.7% orthogonal and equiangular skew quality improvement over the unstructured tetrahedral meshes. The parametric meshing and processing pipeline constitutes an automated technique to reconstruct and simulate blood flow throughout a large portion of the cerebral arterial tree down to the level of pial vessels. This study is the first step towards fast large-scale subject-specific hemodynamic analysis for clinical applications.
Keywords: Parametric mesh generation, cerebral arterial tree, computational fluid dynamic, hexahedral mesh generation, subject-specific, bifurcation
Graphical Abstract
1. Introduction
Currently, unstructured tetrahedral meshes (UNST) are the standard format of domain discretization of circulatory networks in computational fluid dynamics (CFD). UNST meshes have been very successful in handling irregular vascular geometry especially pathological cases1–5. There are also procedures to convert UNST into unstructured polyhedral meshes to reduce the required cell elements6. Although unstructured grids are the most commonly used technique for complex geometries, structured hexahedral meshes offer several advantages that might be necessary for some applications. For example, structured hexahedral meshes are essential for isogeometric analysis7; the arrangement of near-orthogonal hexahedral cell layers make them ideal for fluid structure interaction8 (FSI). Hexahedral structured mesh generation for the entire vascular trees is challenging due to complex network connectivity with multiple bifurcations, loops, and vessels with high tortuosity.
Structured hexahedral meshes have proven to produce stable results in numerical analysis requiring fewer elements to reach mesh independence than UNST meshes9. Moreover, it has been shown10 that UNST mesh element refinement does not necessarily reduce mesh-dependent error in calculating wall shear stress (WSS). However, WSS components are critical hemodynamic factors for predicting of endovascular lesions such as atherosclerosis4,11.
Randomly distributed cells introduce numerical diffusion error in CFD analysis12–14. The main blood flow direction in large cylindrical vessels aligns with the longitudinal axis. Face and elements alignment along the main flow direction may accelerate convergence and improve numerical results. Grid cell alignment in the flow direction can, in principle, be achieved by structured meshing such as using cooper algorithm15, Laplace equation16,17, block structure18–20, and NURBS7,21,22. However, most implementations require manual intervention when applied for vascular trees. Some procedures require a smoothed surface mesh for hexahedral volumetric mesh generation23,24, but it is extremely laborious to manually obtain a high quality surface mesh with no gaps and discontinuity from medical images for a large-scale cerebral arterial tree. Size and complex connectivity of cerebral arterial trees with hundreds of bifurcations and branches call for automated image segmentation and mesh processing.
Many prior techniques also suffer from limitations when dealing with complex topologies. For example, some methods are limited to planar bifurcations10,15,24,25 (bifurcation branches lying in a single plane), however, non-planar bifurcations are prevalent in the human vascular trees26. Other procedures fail in short segments between bifurcations23 or segments with high tortuosity27.
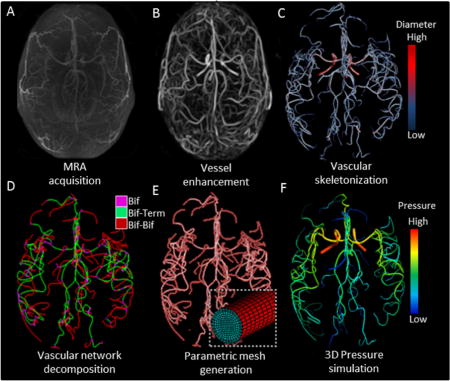
In this study, we present a robust automatic procedure for parametric hexahedral mesh generation of large cerebral arterial trees from medical images. We will perform parametric meshing on multiple healthy and pathological arterial trees. The workflow for the large-scale arterial tree flow simulation from image acquisition to simulation output is illustrated in Figure 1. Imaging datasets were used for arterial tree reconstructions of six healthy volunteers and two endovascular patient cases. A novel vesselness filter28,29 was used to enhance the contrast of the cerebral angioarchitecture30 down to pial arteries (400 µm). Vessel centerline and radius information of the vascular network were extracted. Then, a fully automatic parametric mesh generation technique (PRM) was deployed to generate flow-aligned hexahedral meshes for the cerebral arterial trees. Finally, we performed blood flow simulation of cerebral arterial trees and compared the results to those obtained with UNST meshing techniques.
Figure 1.
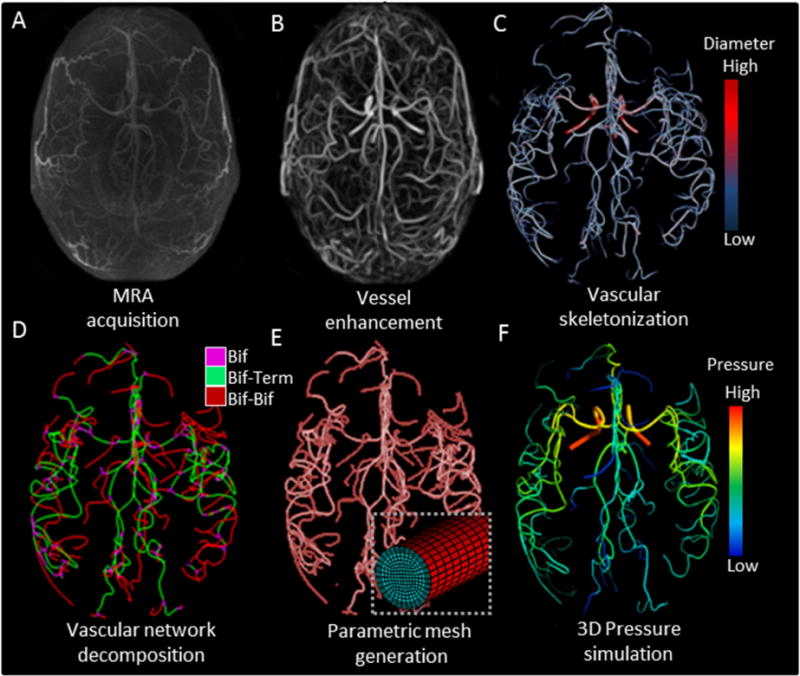
Workflow of subject-specific skeletonization and parametric mesh generation of cerebral arterial tree. (A) Raw MRA image acquisition of cerebral arterial tree with MRA. (B) Vesselness enhancement filter suppresses tissues and background to better delineate the arterial blood vessels. (C) Vascular skeletonization obtains geometrical network information such as diameters, centerline point coordinates, and segment connectivity (color-coded diameter information). (D) The vascular network is decomposed into three sections: bifurcation (Bif), bifurcation-to-terminal (Bif-Term), and bifurcation-to-bifurcation (Bif-Bif) segments. (E) Parametric meshes composed of surface and volumetric grids along body-fitted radial, circumferential and axial coordinates system. Magnified insert shows cross-section of a small artery. (F) Simulated three-dimensional pressure field at systole for the entire cerebral arterial tree in one subject.
2. Methods
2.1. Image acquisition
Six healthy human subjects with no known cerebral vascular diseases were recruited and underwent MR imaging studies on a General Electric 3T MR750 scanner using a 32 channel phased array coil (Nova Medical, Inc., Wilmington, MA, USA). Magnetic resonance angiograms (MRA) were acquired for healthy volunteers (five men and one woman between 25 to 31 year-old). In addition, clinical digital subtraction angiography (DSA) data for two retrospective pathological cases were selected. Pathological case I was a 59 year-old male diagnosed with left middle cerebral artery (MCA) stenosis. Pathological case II was a 74 year-old female who had a large aneurysm in the side branch of the right vertebral artery (VA). MRA and DSA were acquired under institutional review board at the University of Illinois at Chicago.
2.2. Vascular filtration
To better capture a large-scale cerebrovascular tree from large to small pial arteries, we enhanced the vessel contrast with our in-house multi-scale vesselness filter28,29. Figure 1B shows an enhanced image of the vasculature of the subject I, which is much brighter and clearly delineated from the background compared to the raw image data.
2.3. Vascular skeletonization
Morphological descriptors including centerlines, vessel diameters, and network connectivity were acquired from the filtered images. A Voronoi diagram-based approach was used to extract centerline and its corresponding vessel diameters31,32. Vascular skeleton data was partitioned into point coordinates, connectivity, and diameter information. The point coordinate matrix contains the location of each node on the vessel centerline with its corresponding diameter segmentation. Logical connections between two points were encoded via a connectivity matrix. Using point coordinate and connectivity matrices, the network was partitioned into segments. The segments encompass an array of points and its connectivity between either two bifurcations or a bifurcation and inlet/outlet (i.e., terminal). Three point-connectivity corresponds to a bifurcation; a single point-connectivity characterizes a terminal node. Statistics of the reconstructed arterial trees are listed in Table 1.
Table 1.
Statistics of reconstructed cerebral arterial trees with parametric meshing technique for six volunteers.
| Subjects | #Points | #Bezier curves | #Branches | #Bifurcations | Wall surface (m2) |
Blood volume (ml) |
Meshing time (min) |
|---|---|---|---|---|---|---|---|
| I | 15688 | 391 | 133 | 68 | 0.0122 | 4.01 | 15.6 |
| II | 22502 | 538 | 294 | 100 | 0.0134 | 4.28 | 18.4 |
| III | 17436 | 433 | 175 | 89 | 0.0151 | 5.36 | 16.8 |
| IV | 24485 | 574 | 309 | 122 | 0.0141 | 4.75 | 19.6 |
| V | 20477 | 496 | 247 | 99 | 0.0146 | 4.76 | 17.5 |
| VI | 19203 | 462 | 206 | 93 | 0.0138 | 4.70 | 17.4 |
|
| |||||||
| Mean | 19965 | 482 | 227 | 95 | 0.0138 | 4.64 | 17.6 |
2.4. Vascular network decomposition
Network decomposition groups the vascular network into three categories: bifurcation (Bif), bifurcation-to-terminal (Bif-Term), and bifurcation-to-bifurcation (Bif-Bif) segments. C1-continuous Bezier splines are used to delineate centerlines33. To decompose bifurcation regions, each bifurcation branch was subdivided where the arc length of the branch was equal to the local diameter. The de Casteljau algorithm34 was used to split contiguous Bezier splines at desired locations. The truncated segments are categorized into either Bif-Term or Bif-Bif segments. The decomposed vascular network for one volunteer is illustrated in Figure 1D.
2.5. Mesh generation
The next step entails surface and volumetric mesh generation for each vascular segment.
Bifurcation-to-terminal (Bif-Term) segments
Mesh generation for Bif-Term vessels requires a moving frame to sweep a cross-sectional mesh template along the centerline. A common problem here is twisting35, which we overcome by introducing a body-fitted coordinate system that moves along the curve as shown in Figure 2A and Eq. (1–3).
Figure 2.
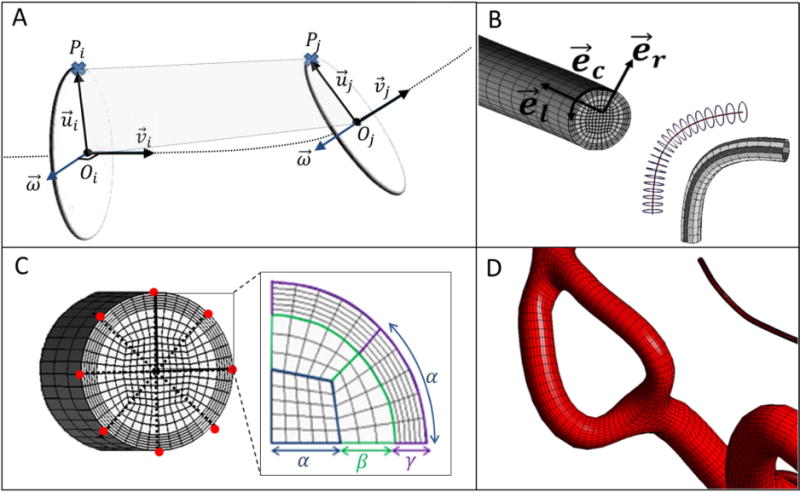
Mesh generation for arterial segments between bifurcation to a terminal point (Bif-Term) and vessels connecting two bifurcations (Bif-Bif). (A) To build the mesh for a Bif-Term segment, a moving frame was implemented to sweep the local coordinate base vectors along the centerline. Reference point section, Pi, in the first cross-section was associated with the point, Pj, in the second cross-section using iso-planar mapping. (B) Longitudinal, circumferential and radial directions were used to adjust the resolution of the parametric meshes. Longitudinal subdivision can be chosen to refine the surface as a function of local diameter and centerline curvature. (C) For generating the volumetric meshes, cross-sections are swept and rotated along the longitudinal coordinate systems. Suitable selection of surface reference points (marked red) connect two bifurcation cross-sections to minimize rotation. The butterfly pattern allows for desired cross-sectional mesh refinement with the help of control parameters (α, β, and γ). (D) Subject-specific parametric mesh showing a section with two Bif-Bif segments forming a loop in the entrance of the anterior cerebral artery territory of subject II.
| (1) |
| (2) |
| (3) |
Here is the normalized tangent vector at the centerpoint, Oi. is a vector between the reference, Pi, and the centerpoint in the ith cross-section. Rj is the vessels radius at the jth cross-section. The reference point can be chosen among the circumferential points. Figure 2A illustrates the method to move the local frame between two cross-sections without twisting. It is termed iso-planar because Pj lies on the same plane, generated by Pi, Oi and Oj with the normal plane of . The use of a single plane eliminates the twisting problem at inflection points. Mesh resolution was controlled in the longitudinal , circumferential , and radial directions, as shown in Figure 2B. Longitudinal subdivisions were served to refine the surface as a function of local diameter and centerline curvature. Circumferential and radial mesh refinements are further discussed in the Bif-Bif section.
Bifurcation (Bif) segments
Bifurcating branches require a unique procedure to define the separation region and maintain continuity of connected branches. The separation region is defined around the bifurcation point B by three separation points, S, and two control points, CP. The three branches of a bifurcation were indexed as a, b, and c as shown in Figure 3A. Then coordinates of separation points, Sab, Sbc, Sac, were calculated between the branches of a–b, b–c, and a–c, respectively using Eq. (4–5). To complete the separation region geometry, the normal vector of the separation plane, , was extended by a magnitude equal to the mean radius to find control points, CP1 and CP2, using Eq. (6–8) as shown in Figure 3A.
Figure 3.
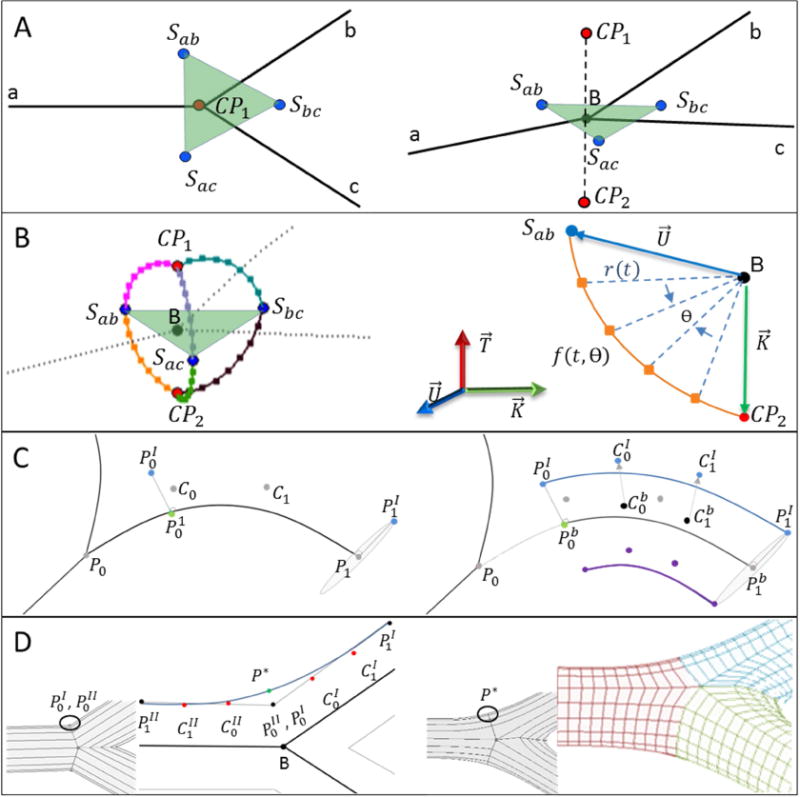
Workflow for the parametric meshing of a bifurcation. (A) Separation points, S, are located between two branches. Control points, CP, lie above and below the separation plane (transparent green plane). (B) Six parametric curves connecting CP and S form the bifurcation geometry. The schematic illustrates parametric curves between Sab and CP2. (C) For creating the longitudinal surface, we chose an arbitrary point located on the parametric curves. Then, a minimum distance point on the centerline is identified (marked green on the left). The shortened centerline segment is split from the entire centerline using de Casteljau’s algorithm. The control points of the shortened centerline segment are transferred to the surface by enforcing a desired radial offset between the centerline and the vessel surface. (D) Smooth connections between branches avoid tangent discontinuity in the bifurcation surface geometry (as illustrated in left panel). A new control point P* (marked in green) is inserted so that both branches connect smoothly (G1-continuity). For each bifurcation branch, Bezier surface curves are partitioned longitudinally to span a structured parametric bifurcation surface mesh (as shown in the right panel). Note that resulting grids are shown with lower mesh density so that grid lines are better visible.
| (4) |
| (5) |
| (6) |
| (7) |
| (8) |
Where the unit tangent vectors of , , are at the bifurcation point are equal to the derivative of Bezier curve at t = 0 on a, b, c branches, respectively. ||.|| denotes the Euclidean norm. α is the angle between two unit vectors of and . Ra and Rb are the radii corresponding to the branches of a and b, respectively. CP1 and CP2 control points located above and below the separation plane.
Parametric curves are generated to connect control points to separation points. Figure 3B shows the six curves reached to build the bifurcation geometry that link CP and S. A radial parameter, r(t), was computed between each control and separation point using Eq. (9). A parametric curve equation in Eq. (10) determines the position of surface nodes, which will serve as guide points for the vessel surface mesh.
| (9) |
| (10) |
Vector and connect separation and control point to bifurcation point B, respectively, as shown in Figure 3B. correspond to the normal vector of i. denotes a normal vector to the plane of CP, S, and B. The parametric curve, f(t, θ), is a scalar function with two independent variables of t and θ representing the radial and angular parameters, respectively. N is the total number of points on the circumference of the structured cross-section. For each quarter, N/4 points were calculated to partition each parametric curve using Eq. (10). Surface envelopes are generated following prior procedures36,37 by transferring Bezier centerline information to the surface, as shown in Figure 3C. Two bifurcation branches are smoothly joined by a single Bezier spline, where the point P* is positioned as shown in Figure 3D and Eqs. (11–13).
| (11) |
| (12) |
| (13) |
Bifurcation-to-bifurcation (Bif-Bif) segment
The interior of the vessel cross-section was discretized with a structured butterfly pattern38(also known as O-grid), as shown in Figure 2C. The butterfly pattern allows for desired cross-sectional mesh refinement with the help of parameters of α, β and γ (N = 8α). Thus, we generated prism boundary-layers with orthogonal grid elements in the wall-normal direction. Our method enables adjustment of the thickness of the boundary layers. The boundary-layer refinement parameter (γ) was used to set the number of boundary layers (refinement). The total number of cross-sectional elements (NCSE) can be calculated using Eq. (14).
| (14) |
Segments connecting two bifurcation branches are processed with a similar sweeping procedure as the one described for Bif-Term segments with additional rotation. The reference point of Bif-Bif segments was chosen among the circumferential points at the symmetry axis of the butterfly pattern. We first choose one reference point on the first branch, and then project it on the cross-sectional plane of the other bifurcation branch. The matching referenced point is chosen such that the rotational angle between the two cross-sections is minimized. Thus, cross-sectional grids gradually rotate along the longitudinal direction of the vessels for seamlessly transition of two cross-sectional butterfly patterns of adjacent bifurcations. Figure 2D illustrates two Bif-Bif segments forming a loop at the entrance of the anterior cerebral artery territory.
2.6. Blood flow simulation of PRM and UNST meshes
To systematically study the potential benefits of PRM meshing, we also generated UNST meshes for comparison. All our attempt of direct unstructured meshing of the entire large portion of the arterial tree failed due to surface discontinuities, holes and overlap between neighboring surface patches. To overcome this problem for large-scale modeling, we synthesized unstructured tetrahedral/prism meshes by using parametric surface meshes (PRM) and Delaunay method in ANSYS ICEMCFD (ANSYS Inc., Canonsburg, Pa., USA). We compared the performance of PRM with UNST meshes using parallel 14-core processing on dual 2.4 GHz Xenon CPUs. Unsteady hemodynamic simulations were carried out using ANSYS Fluent 18.1 (ANSYS Inc., Canonsburg, PA) using the finite volume method (FVM). For both PRM and UNST, the numerical simulations were carried out using semi-implicit method for pressure-linked equations (SIMPLE) solver with a second-order upwind scheme with 40 iterations per time-step, and time-step size of 0.001 s.
The vessel walls were assumed rigid with no-slip boundary condition. Blood rheology is modeled as a viscous, incompressible, single-phase Newtonian fluid with density 1055 kg/m3 and dynamic viscosity of 4.265 × 10⁻³ Pa.s.
3. Results
This section presents the results for meshing and blood flow simulations of image-based subject-specific vascular trees. We applied PRM meshing was applied to reconstruct a large portion of the cerebral arterial tree in six human subjects with an average of 227±68 vessel segments and 95±17 bifurcations. To analyze the geometric accuracy, we first quantified geometric overlap between the vessel surface in the reconstructed meshes and the MRA image. Moreover, mesh quality of PRM meshes were compared against conventional UNST meshes. For computational validation, hemodynamic simulations on all subjects were executed and compared the results and calculation-speed between PRM and UNST meshes. Finally, the PRM method was applied to reconstruct anatomy and to perform blood flow simulations in two pathological cases.
3.1. Geometric accuracy evaluation
We quantified the geometric overlap between the reconstructed PRM model and intensity-based MRA. Both the MRA image and the reconstructed vascular tree were registered in the Walk-in Brain virtual-reality software39. The arteries in the MRA and the reconstructed meshes were rendered semi-transparently to simultaneously view both structures at the exact region of interest. Statistical analysis was performed by selecting and capturing images on all bifurcations and vascular cross-sections. Detailed views of vessel cross-sections were captured along the longitudinal direction of vessels; bifurcations were displayed above and below the separation planes. Typical examples of cross-sections and bifurcations are shown in Figure 4A. Vessel geometry in MRA was distinguished from the reconstructed mesh using an RGB filter (red-green-blue). Relative positions of the centroid were calculated; differences were reported in box plots of Figure 4B. In all six subjects, over 86% of cross-sections and bifurcation centroid differences were less than 400 µm apart. This value is equal to the resolution limit of the image acquisition. Pixel-by-pixel analysis was also performed with the receiver operating characteristic curve (ROC) by plotting the true positive rate (TPR) against the false positive rate (FPR) as shown in Figure 4C. The accuracy of the overlap between each pixel of PRM and MRA images was quantified by means of the area under the curves (AUC). The mean AUC value of 0.87 for the six case studies quantifies the geometrical accuracy of PRM meshing. Validation was performed for MRA images of healthy volunteers. The pathological cases were reconstructed from clinical DSA images are not reported here, but validation of image segmentation from DSA images can be found in prior work28,40.
Figure 4.
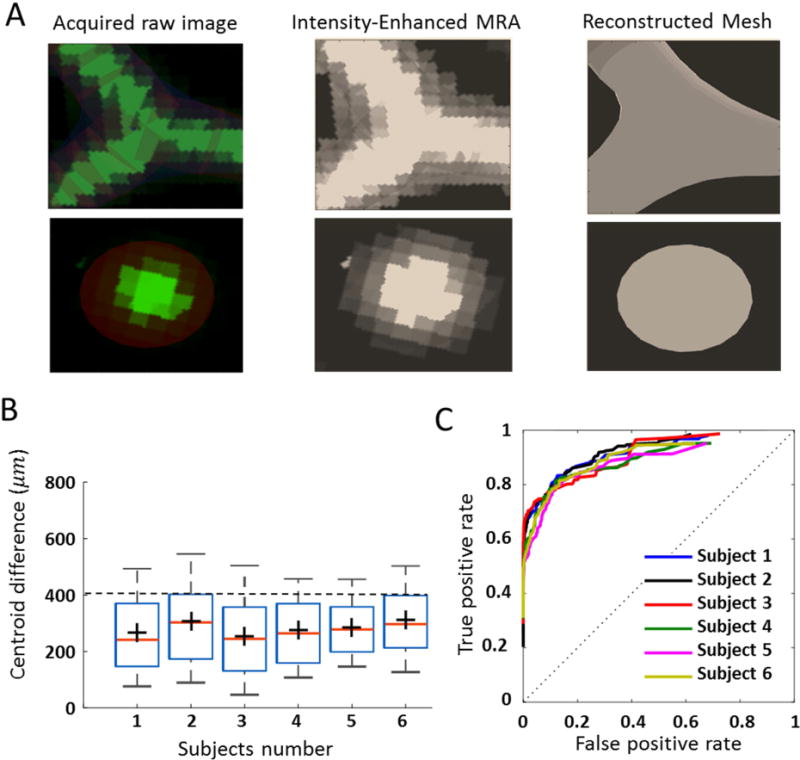
Geometrical validation of parametric mesh generation. (A) We compared reconstructed parametric meshes geometry to MRA. Using RGB filter (red-green-blue), the locations of blood vessel MRA signal and reconstructed mesh were rendered in the Walk-In Brain virtual reality environment39. (B) Statistical comparison between the position of the centroid in MRA data and reconstructed volumetric mesh. These results show that 86% of positional differences are below the MRA resolution limit (~400 µm) (C) To quantify the accuracy of the overlap between PRM and MRA images, a pixel-by-pixel analysis was performed with the receiver operating characteristic curve (ROC). The area under the curve (AUC) was calculated as 0.87 for all six volunteers. These results show the high accuracy of vascular geometry reconstruction with the PRM meshing technique.
3.2. Mesh quality
Mesh quality plays an important role in the accuracy and stability of the numerical computation. Three critical metrics, scaled Jacobian, equiangle skew and orthogonality were assessed. The scaled-Jacobian determinants generally range from −1 (worst) to +1 (well-shaped rectangular hexahedral)41. Negative values of scaled-Jacobian may not be acceptable for numerical analysis42. None of PRM meshes for healthy or pathological cases had cells with negative scale-Jacobians. Figure 5 displays magnified PRM meshes with histograms of the scaled Jacobian matrix determinant for three subjects. High quality PRM meshes were generated for three problematic locations; non-planar bifurcation (Figure 5A), short Bif-Bif segments (Figure 5B) and vessels with high tortuosity such as intracranial arteries (Figure 5C). The equiangle skew19 ranges between zero (worst) and unity (best) as defined in Appendix Eq. (A.1). For all six subjects, equiangular skew was 0.85±0.03. In addition, mesh orthogonality ranging from 0 (worst) to 1 (best) was quantified using ANSYS ICEMCFD, see Appendix Eq. (A-2). Mean orthogonality quality for all subjects was 0.97±0.01. We also report the minimum internal angle in cells for both PRM and UNST mesh. Table 2 summarizes mesh quality statistics for both PRM and UNST models. In addition to mesh quality metrics, we calculated the aspect ratio and volume change as summarized in Table 3.
Figure 5.
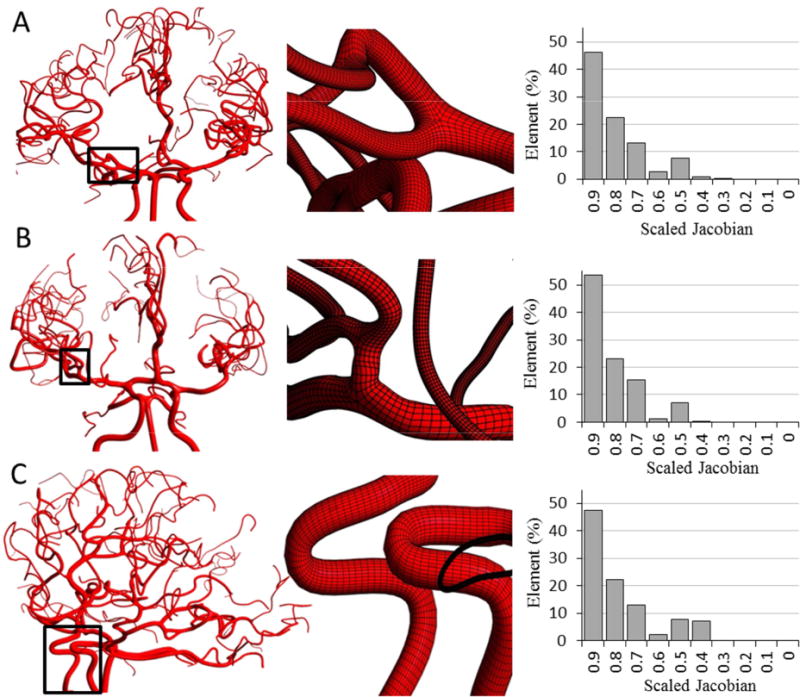
Parametric mesh generation for subject-specific cerebral arterial trees (only three specimens are shown here). Histograms quantify mesh quality in terms of scaled Jacobian for each subject (A) Magnified view visualizes planar and non-planar bifurcations. (B) Insert show details of a Bif-Bif segment connecting branches of several bifurcations. (C) Highly tortuous region of the internal carotid siphon.
Table 2.
Comparison of mesh density, quality (angle, orthogonality, skew) and computational speed for PRM and UNST meshes.
| #Elements
|
Min angle
|
Orthogonality
|
Equiangle Skew
|
CPU time
|
||||||
|---|---|---|---|---|---|---|---|---|---|---|
| Subjects | PRM | UNST | PRM (mean, min) |
UNST (mean, min) |
PRM (mean, min) |
UNST (mean, min) |
PRM (mean, min) |
UNST (mean, min) |
PRM Tc (min) |
UNST Tc (min) |
| I | 1783K | 29940K | 77.2, 39.0 | 44.4,13.8 | 0.97, 0.79 | 0.78, 0.38 | 0.85, 0.56 | 0.74, 0.23 | 78 | 1917 |
| II | 2158K | 22455K | 77.6, 21.6 | 40.2, 5.0 | 0.96, 0.40 | 0.69, 0.04 | 0.84, 0.39 | 0.67, 0.07 | 86 | 1980 |
| III | 1876K | 26342K | 79.7, 25.4 | 45.3, 8.3 | 0.97, 0.56 | 0.67, 0.12 | 0.84, 0.47 | 0.68, 0.12 | 103 | 2466 |
| IV | 2115K | 32536K | 78.3, 22.4 | 42.3, 9.2 | 0.97, 0.67 | 0.68, 0.07 | 0.86, 0.47 | 0.69, 0.22 | 89 | 2745 |
| V | 1918K | 22547K | 80.4, 32.3 | 43.6, 8.6 | 0.98, 0.72 | 0.71, 0.17 | 0.83, 0.42 | 0.70, 0.09 | 72 | 2035 |
| V1 | 1897K | 27986K | 76.9, 34.5 | 44.1, 6.0 | 0.96, 0.55 | 0.68, 0.22 | 0.86, 0.51 | 0.65, 0.04 | 82 | 2785 |
|
| ||||||||||
| Mean | 1958K | 26967K | 78.3, 29.2 | 43.3, 8.4 | 0.97, 0.62 | 0.71,0.17 | 0.85, 0.47 | 0.69, 0.13 | 85 | 2321 |
PRM: Parametric hexahedral mesh, UNST: Unstructured tetrahedral mesh. Tc: Total CPU time for a one cardiac cycle
Table 3.
Comparison aspect ratio and volume change for PRM and UNST meshes.
| #Elements
|
Aspect ratio
|
Volume change
|
||||
|---|---|---|---|---|---|---|
| Subjects | PRM | UNST | PRM (mean, min, max) |
UNST (mean, min max) |
PRM (mean, min, max) |
UNST (mean, min, max) |
| I | 1783K | 29940K | 0.36, 0.18, 0.99 | 0.76, 0.21, 0.99 | 1.31, 0.66, 10.39 | 1.29, 0.51, 09.38 |
| II | 2158K | 22455K | 0.48, 0.12, 0.97 | 0.63, 0.02, 1.00 | 1.31, 0.72, 26.68 | 1.50, 0.25, 26.28 |
| III | 1876K | 26342K | 0.37, 0.16, 0.96 | 0.66, 0.12, 1.00 | 1.34, 0.72, 20.25 | 1.52, 0.36, 07.53 |
| IV | 2115K | 32536K | 0.38, 0.12, 1.00 | 0.69, 0.15, 0.98 | 1.30, 0.86, 22.50 | 1.49, 0.49, 12.56 |
| V | 1918K | 22547K | 0.42, 0.09, 0.98 | 0.59, 0.03, 1.00 | 1.28, 0.76, 18.23 | 1.37, 0.39, 10.11 |
| V1 | 1897K | 27986K | 0.37, 0.11, 0.99 | 0.60, 0.08, 0.98 | 1.33, 0.69, 16.33 | 1.22, 0.33, 18.30 |
|
| ||||||
| Mean | 1958K | 26967K | 0.39, 0.13, 0.98 | 0.65, 0.10, 0.99 | 1.31, 0.73, 19.06 | 1.39, 0.38, 14.03 |
PRM: Parametric hexahedral mesh, UNST: Unstructured tetrahedral mesh.
3.3. Blood flow simulation and CPU performance
Mesh generation
We compared the performance of PRM with UNST mesh generation using the single-core processor on a 2.4 GHz Xenon CPU. The CPU time for vascular network decomposition and PRM mesh generation of the cerebrovascular tree takes less than 17 minutes on average using MATLAB R2013b (MathWorks Inc.) as listed in Table 1. Even with excellent smooth surface meshes (STL file), ICEM ANSYSCFD required more than 32 hours to generate tetrahedral/prism volumetric meshes for the arterial trees of the volunteers.
CFL number
We also checked the Courant-Friedrichs-Lewy (CFL) number in our mesh models. Figure 6A–B shows the CFL contour and histogram comparison of PRM and UNST meshes. For the same time discretization, more than 80% of the cells exhibited high CFL number (>1), while PRM meshes with fewer cell numbers meet CFL condition for the first healthy subject. We also visualized the contour map and histogram mesh equiangular skewness (Figure 6C) and orthogonality quality (Figure 6D) of the UNST and PRM meshes.
Figure 6.
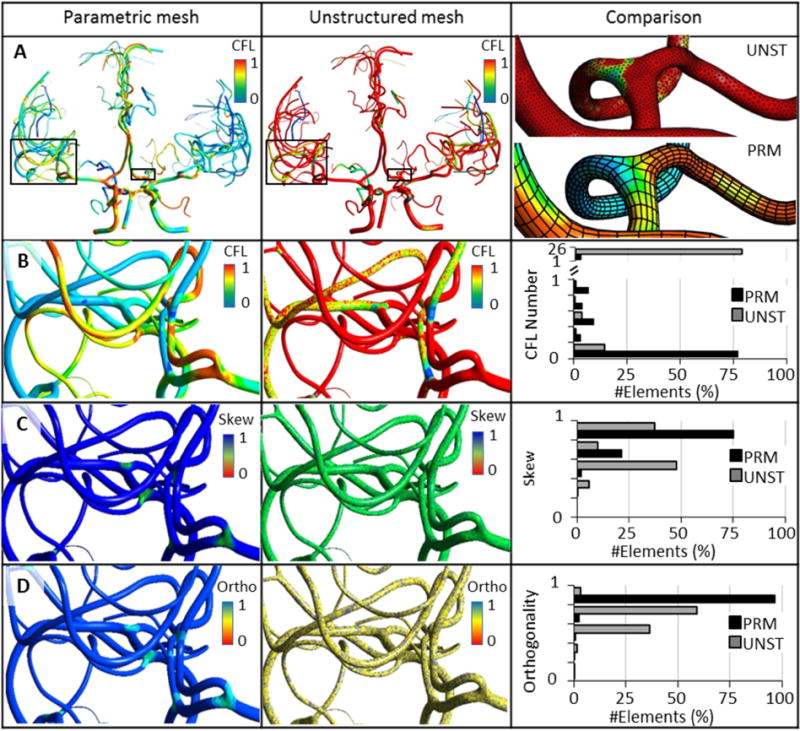
Comparison of mesh quality and computational stability in 3D CFD blood flow simulations of cerebral arterial trees reconstructed with parametric (PRM) versus unstructured meshing (UNST). (A) Global view of CFL contours for a subject-specific cerebral arterial tree mesh with PRM and UNST. Magnified insert shows a small portion of the meshes. (B) For a given step size, all cells in the PRM meshes meets the CFL condition at much lower mesh density. For the same time step, more than 80% of the cells violate the CFL criterion (>1) in UNST. (C) Equiangular skew (abbr. as Skew). PRM meshing improves mean skewness by 20%. (D) Orthogonality (abbr. as Ortho); more than 97% of the PRM cells are almost perfectly orthogonal.
Mesh independence and blood flow in normal subjects
We compared the dynamic 3D CFD results for one cardiac cycle between UNST and PRM models with results shown in Figure 7. Polylines starting from internal carotid arteries (ICA), and basilar artery (BA) passing through a large portion of the vascular tree were generated. These polylines were used for point-to-point comparisons of computed pressure, velocity and vorticity magnitudes at peak-systole, mid-diastole, and end-diastole of the cardiac cycle. Additional polylines located on the vessel walls were created for WSS comparison. Simulation results of vorticity magnitude and WSS results between mesh-independent UNST and PRM model are shown in Figure 7B–C. Maximum WSS and vorticity magnitude differences were less than 5% and 3% over one cardiac cycle. Table 4 summarizes percentage difference of WSS between PRM and UNST at peak-systole, mid-diastole and end-diastole of the cardiac cycle. The predicted values between the two methods differed less than accepted relative error threshold of the mesh independence, indicating that the results are numerically equivalent. The accepted relative error for mesh-independence was set to 3% for pressure and velocity and 5% for vorticity and WSS43,44. Figure 8 A–B displays results of simulated pressure and WSS contour in six healthy subjects. The minimum number of cells needed to reach grid-independent pressure, velocity, vorticity, and WSS-based predictions were 1,957,000 (PRM) and 26,967,000 (UNST). In these case studies, UNST meshes required on average 13.7 times more cells to reach a mesh-independent hemodynamic variable, leading to 27.3 times longer CPU time compared to PRM meshes.
Figure 7.
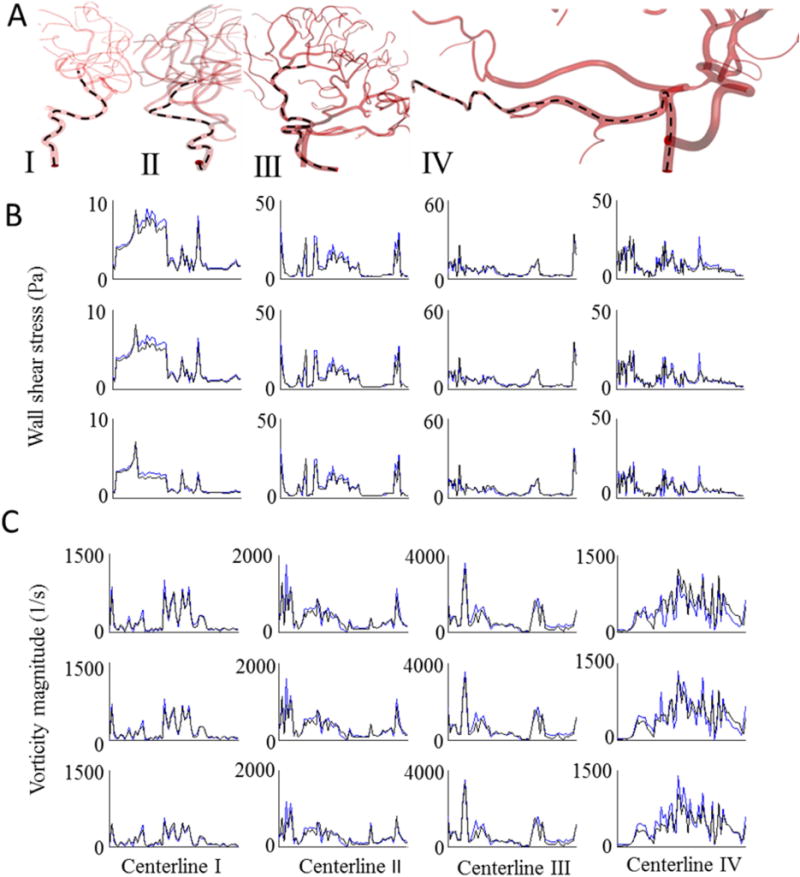
Comparison of unsteady CFD blood flow simulation between PRM and UNST for subject-specific cerebrovascular trees. (A) Hemodynamic states along polylines (marked as dashed lines) passing from ICA and BA to downstream vessels of the arterial tree were plotted to compare predictions of blood pressure, velocity, wall shear stress and vorticity magnitude of parametric and unstructured meshes. Simulation results for WSS (B) and vorticity magnitude (C) of the UNST (black solid-line) and PRM meshes (blue solid-lines). The first, second and third rows correspond to the results at peak-systole, mid-diastole, and end-diastole of the cardiac cycle, respectively. Maximum WSS and vorticity magnitude differences were less than 5% and 3% over one cardiac cycle. PRM meshes required at least 10 times fewer elements to reach mesh-independent hemodynamic results.
Table 4.
Percentage difference between PRM and UNST simulations of pressure drop, velocity, and vorticity and WSS magnitude for numerical analysis along polylines. Percentage differences are listed for peak systole, mid-diastole, and end-diastole of the cardiac cycle.
| Pressure % Difference |
Velocity % Difference |
Vorticity % Difference |
WSS% Difference
|
|||||||||
|---|---|---|---|---|---|---|---|---|---|---|---|---|
| Lines | Peak systole | Mid diastole | End diastole | Peak systole | Mid diastole | End diastole | Peak systole | Mid diastole | End diastole | Peak systole | Mid diastole | End diastole |
| I | 1.85 | 0.61 | 1.15 | 0.49 | 2.00 | 2.55 | −1.71 | 0.10 | 4.10 | 4.96 | 4.17 | 3.25 |
| II | 2.06 | 1.64 | 2.70 | −2.46 | −2.87 | −1.39 | −0.21 | −0.25 | −0.92 | −4.74 | −4.61 | −3.60 |
| III | 2.14 | 1.81 | 2.07 | −2.90 | −2.21 | −2.05 | −2.69 | −2.41 | −2.44 | −2.73 | 2.98 | 4.98 |
| IV | −2.28 | 0.93 | 1.25 | 2.13 | −2.28 | −0.50 | 2.21 | −1.76 | −3.06 | −4.11 | 4.90 | 3.84 |
|
| ||||||||||||
| Mean | 2.08 | 1.25 | 1.79 | 1.99 | 1.84 | 1.62 | 1.71 | 1.13 | 2.63 | 4.14 | 4.17 | 3.92 |
PRM: Parametric hexahedral mesh; UNST: Unstructured tetrahedral mesh; WSS: wall shear stress.
Figure 8.
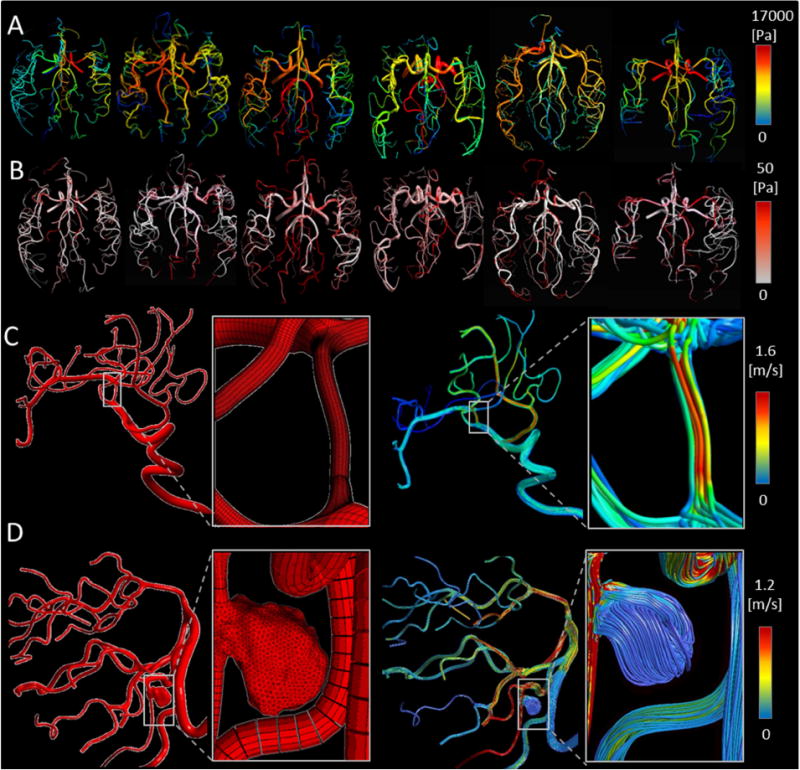
Preliminary 3D hemodynamic CFD analysis using parametric meshes in healthy and pathological cerebral arterial trees. (A) Predicted 3D pressure field for a large portion of cerebral arterial tree simulation at peak-systole in six volunteers. (B) Predicted wall shear stress distribution. (C–D) Hemodynamic simulation in patients with endovascular pathologies. Panel (C) illustrates the application of PRM method for a patient with MCA stenosis. Panel (D) summarizes results for a saccular aneurysm in the vertebral artery. It shows unstructured mesh for a saccular aneurysm in the right vertebral arteries fused to a parametric mesh of the vertebrobasilar system down to posterior cerebral arteries. The magnified insert depicts the hybrid mesh of unstructured aneurysm with parametric vascular tree meshes. The blood flow streamlines are shown for both stenosis and aneurysm pathological cases (right column of C and D panel).
Preliminary blood flow analysis in pathological cases
In addition to CFD blood flow simulations in six healthy data sets, we also tested the PRM methodology in two pathological cases: a MCA stenosis lesion case and a severe aneurysm in the left vertebral artery. We successfully generated a parametric mesh for a vascular tree of a patient with MCA (M2) stenosis from digital subtraction angiography. The stenosed region was readily meshed parametrically. Reconstructed meshes and unsteady blood flow simulation results are shown in Figure 8C.
For irregular pathological regions, such as saccular aneurysms, unstructured meshing is the method of choice1–4. We combined the benefits of unstructured meshing for complex irregular pathologies with the efficient parametric meshing for normal segments by fusing the unstructured grid for the aneurysm with a parametric mesh for the remaining portion of the patient’s arterial tree. To create a seamless connection between the aneurysm and the parametric arterial tree, an axial cross-section containing surface and interior points were used as seeding points for initiating unstructured mesh generation of the aneurysm. This task was supported by ICEM CFD mesh editing tools (e.g. merge-nodes, split-edges). The unstructured aneurysm mesh was connected at the proximal and the distal end to the parametric mesh of the “healthy” arterial tree. Figure 8D illustrates the combined hybrid PRM-UNST mesh with an unstructured (pathological) and a parametric (healthy) portion. We succeeded in performing preliminary hemodynamic simulation on a large portion of the vertebrobasilar system down to small arteries of the posterior cerebral territory for a patient with a massive aneurysm. Hybrid meshing enabled highly dense mesh refinement in the irregular pathology, combined with very economic reconstruction of the normal portion of the patients’ cerebral circulation.
4. Discussion
We presented a fully automated parametric mesh generation method tailored for large-scale hemodynamic analysis. It succeeded in generating high-quality meshes including challenging locations such as non-planar bifurcations, very short segments between bifurcations, bifurcations with significant diameter differences, loops and high tortuosity arteries in both healthy and pathological cases.
PRM vs. UNST comparison
In all subjects, over 86% positions of the centroid in the reconstructed meshes differed less than the resolution limit from the corresponding points in the MR image. Geometric accuracy evaluation showed a good agreement, with an AUC value of 0.87, between the constructed mesh and raw MRA data sets.
The required mesh generation time for PRM was almost 112 times faster than UNST mesh generation on the same computer with single core processor. Unsteady 3D CFD blood flow simulations for one cardiac cycle on a PC with 14-core parallel processors, required over 27 times more CPU time for the UNST meshes compared to the PRM model. Overall, the use of hexahedral PRM meshing decreases numerical diffusion error; mesh independence of the flow solution was achieved with significantly fewer elements in all subject-specific cases presented here. For the same time step, the value of local CFL number was visualized for both UNST and PRM models. It should be noted that the comparison of CFL numbers is not a direct measure of solver stability and convergence acceleration. High aspect ratio cells can also increase the bound of stability limits of a specific time-step and would allow the use of a larger CFL value to achieve fast convergence45.
PRM meshes reached mesh-independent hemodynamic results with only 7% of the number of elements required for UNST. This is at least one order of magnitude savings in mesh size. PRM meshing yielded on-average, 36.6% and 21.7% orthogonal and equiangular skew quality improvement over unstructured meshes. The mean orthogonality quality and equiangular skew quality of PRM models for all six subjects were 0.97±0.01 and 0.85 ±0.03, respectively. However, the average of aspect ratio and volume changes of PRM and UNST are 0.39 ±0.04 and 0.655±0.06 as well as, 1.31±0.02 and 1.39±0.11, respectively. It is important to note that cells with large aspect ratio are undesirable in UNST, because stretching tetrahedral cells invariably introduces element distortion which in turn causes errors in the CFD analysis. In contrast, for structured hexahedral meshes, a large aspect ratio aligned longitudinally does not degrade skewness and orthogonality quality. Moreover, good alignment of mesh edges in the dominant flow direction reduces numerical diffusion46. Unstructured meshes with randomly oriented cells are reported to introduce relevant numerical diffusion in the flow solution, especially in predominantly unidirectional flow systems14,47. In summary, some judgment needs to be taken into consideration in addition to the pure high-quality metrics, because the role of quality parameters (aspect ratio, skewness, orthogonality) shifts, due to the differences in the construction principles of tetrahedral unstructured meshes versus PRM meshes.
Anisotropic mesh refinement
Fast and accurate 3D computational hemodynamic results may benefit from mesh refinement to better resolve complex local blood flow patterns. Anisotropic mesh refinement has been previously shown to reduce the numerical diffusion10,13,14,48. The purpose of anisotropic meshing is to perform a flow or geometric-dependent mesh refinement in the region of interest, where higher precision is required. In our PRM method, mesh resolution in longitudinal and cross-sectional directions was varied to optimize the number of required grid cells. For each branch, the number of longitudinal subdivisions depends on the degree of curvature and local diameter of the vessel. To increase the solution accuracy near the boundary layers where higher velocity gradients are expected, higher cell density was implemented close to vessel walls using the boundary-layer refinement parameter (γ). Local orientation (longitudinal, circumferential and radial) aides defining flow- or geometry-dependent refinement in the vascular models. Flow gradients are generally smaller in the longitudinal direction than in the radial direction; therefore the mesh density should be high in the steep gradient regions. Accordingly, structured grid parametrized by a body-fitted coordinate system provides direct control over mesh alignment to improve computational efficiency for large vascular hemodynamic simulations and minimizing unnecessary mesh elements.
Limitations and future work
In this current state, the project has a few limitations which need to be addressed in the future work. Although the actual study was limited to finite volumes methods, the parametric meshes could further be explored for use in finite element methods for blood flow simulations or vascular wall dynamics. In this paper, 3D unsteady simulation results provide quality metrics, CPU time cost, and accuracy, to compare the computational results between UNST and PRM meshing.
A next step simulation using parametric meshing techniques could include 3D fluid-structure interaction (FSI), because the body-fitted coordinate system enables a simple extension of the luminal wall to create a cylindrical wall domain of desired thickness. Our hexahedral orthogonal elements allow layered modeling of the detailed biomechanics of vessel walls49. However, reliable mechanical properties and vessel thickness measurements of the intracranial vasculature are necessary before attempting more rigorous 3D FSI simulations50 for large sections of the cerebral vasculature.
In this paper, complex vascular features such as bifurcations and loops were parametrically meshed, but multifurcations will require further generalization of Eqs. (4–8). Although the current focus is on the cerebral arterial tree, this methodology is applicable to other arterial networks such as coronary, pulmonary and retinal circulatory systems. Future work using the PRM method should address the venous system and irregular pathological regions such as a saccular aneurysm.
A future step incorporating increased clinical significance will entail assessment of disturbed flow in pathological cases, and compare the near-wall hemodynamic parameters before and after endovascular intervention for quantifying surgical outcomes. The automatic PRM method enables detailed hemodynamic analysis for a large portion of the arterial tree, including small downstream vessels. A large-scale approach of assessing hemodynamic risk factors for regions far away from the site of intervention, could aid in elucidating poorly understood phenomena such as delayed hemorrhage (DH)51,52.
Moreover, automation of the workflow presented here would address an important clinical need, because it enables image segmentation and dynamic simulation of patient-specific images on the same day. Near real-time hemodynamic analysis is a clinical requirement that has the potential to inform physicians about disturbed blood flow based on subject-specific meshes and rigorous CFD computations.
5. Conclusion
An image-based automatic processing workflow specifically tailored for mesh generation of large-scale subject-specific cerebral arterial trees was presented. The tight integration of image processing, mesh generation and hemodynamics analysis with realistic, anatomically sound CFD tools is expected to narrow the gap between biofluid mechanic analysis and endovascular surgical practice aiming at providing more efficient interventions for cerebrovascular diseases.
Highlights.
Automated parametric mesh generation technique to reconstruct subject-specific cerebral arterial tree
The proposed parametric meshing technique extends current level of hemodynamic analysis from few segments to large-scale modeling with hundreds of vessels and bifurcations.
CFD hemodynamic studies in subject-specific arterial trees are facilitated by the automated parametric mesh generation.
Acknowledgments
The authors would like to gratefully acknowledge partial support of this project by NSF grant CBET-1301198 and NIH NINDS 1R21NS099896-01A1 (A. Linninger, PI and A. Alaraj, Co-PI).
Appendix 1-Mathematical description of equiangular skewness and orthogonality quality
Equiangular skewness quality (Qskew):
| (A.1) |
Orthogonality Quality (Qortho):
| (A.2) |
Here, αmax and αmin are the largest and smallest angles in the cell, respectively. αe is the angle for an equiangular cell (αe = 60 for UNST, αe = 90 for PRM)19. For each face i, is the face normal vector, is a vector from the centroid of the cell to the centroid of the face, is the vector of the centroid of the cell to the centroid of the adjacent cell sharing a face.
Appendix 2-Subject-specific simulation
Two imaging protocols, Time-of-Flight (TOF) and phase contrast MRA (PCMRA) were performed for acquiring anatomical and dynamic information to interpret volumetric blood flow. These images are processed using a commercial flow analysis software, NOVA (Vassol Inc, River Forest, IL).31 Blood flow was measured from incoming flow to circle of Willis (CoW) including the left and right internal carotid arteries (LICA and RICA) and basilar artery (BA); in addition, arteries leaving the CoW include the anterior cerebral arteries (LACA and RACA), middle cerebral arteries (LMCA and RMCA) and the left and the right posterior cerebral arteries (LPCA and RPCA). The locations of the acquired volumetric blood flow measurements are shown in Figure A2.
The blood flow measurements, obtained from the NOVA scans, at the BA, RICA, and LICA served as pulsatile inlet boundary conditions in our simulations. Pressure boundary conditions were set for the six outflow territories including LACA. RACA. LMCA, RMCA, LPCA, RPCA outlets to minimize the in-vivo PCMRA blood flow with computational fluid dynamic simulation53. We performed a Fourier series approximation to set velocity boundary conditions at the inlet of the basilar and carotid arteries, which were implemented in ANSYS Fluent with user-defined functions (UDF).
Figure. A2.
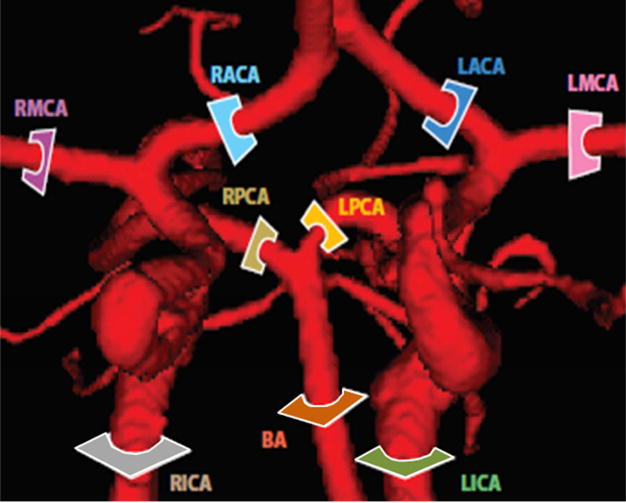
Comparison of regional blood flow measurement and subject-specific simulation using PC-MRA flow measurement. The color-coded slice plane is perpendicular to the longitudinal axis of a vessel segment showing where the measurement was made in the main cerebral arteries (BA, LICA, RICA, LACA, RACA, LPCA, RPCA, LMCA, and RMCA).
Footnotes
Publisher's Disclaimer: This is a PDF file of an unedited manuscript that has been accepted for publication. As a service to our customers we are providing this early version of the manuscript. The manuscript will undergo copyediting, typesetting, and review of the resulting proof before it is published in its final citable form. Please note that during the production process errors may be discovered which could affect the content, and all legal disclaimers that apply to the journal pertain.
Conflict of Interest
All authors certify that they have NO affiliations with or involvement in any organization or entity with any financial interest or non-financial interest in the subject matter or materials discussed in this manuscript.
References
- 1.Sankaran S, et al. Patient-Specific Multiscale Modeling of Blood Flow for Coronary Artery Bypass Graft Surgery. Ann Biomed Eng. 2012;40:2228–2242. doi: 10.1007/s10439-012-0579-3. [DOI] [PMC free article] [PubMed] [Google Scholar]
- 2.Cebral J, et al. Clinical Application of Image-Based CFD for Cerebral Aneurysms. Int J Numer Methods Biomed Eng. 2011;27:977–992. doi: 10.1002/cnm.1373. [DOI] [PMC free article] [PubMed] [Google Scholar]
- 3.Grinberg L, Anor T, Madsen J, Yakhot A, Karniadakis G. Large-Scale Simulation of the Human Arterial Tree. Clin Exp Pharmacol Physiol. 2009;36:194–205. doi: 10.1111/j.1440-1681.2008.05010.x. [DOI] [PubMed] [Google Scholar]
- 4.Arzani A, Shadden SC. Characterizations and Correlations of Wall Shear Stress in Aneurysmal Flow. J Biomech Eng. 2015;138 doi: 10.1115/1.4032056. 014503/1-014503/10. [DOI] [PMC free article] [PubMed] [Google Scholar]
- 5.Liu X, et al. Three-dimensional hemodynamics analysis of the circle of Willis in the patient-specific nonintegral arterial structures. Biomech Model Mechanobiol. 2016;15:1439–1456. doi: 10.1007/s10237-016-0773-6. [DOI] [PubMed] [Google Scholar]
- 6.Spiegel M, et al. Tetrahedral vs. polyhedral mesh size evaluation on flow velocity and wall shear stress for cerebral hemodynamic simulation. Comput Methods Biomech Biomed Engin. 2011;14:9–22. doi: 10.1080/10255842.2010.518565. [DOI] [PubMed] [Google Scholar]
- 7.Zhang Y, Bazilevs Y, Goswami S, Bajaj CL, Hughes TJR. Patient-Specific Vascular NURBS Modeling for Isogeometric Analysis of Blood Flow. Comput Methods Appl Mech Eng. 2007;196:2943–2959. doi: 10.1016/j.cma.2007.02.009. [DOI] [PMC free article] [PubMed] [Google Scholar]
- 8.Lima R, Imai Y, Ishikawa T, Oliveira V. Visualization and Simulation of Complex Flows in Biomedical Engineering. Springer Science & Business Media; 2013. [Google Scholar]
- 9.De Santis G, De Beule M, Segers P, Verdonck P, Verhegghe B. Patient-specific computational haemodynamics: generation of structured and conformal hexahedral meshes from triangulated surfaces of vascular bifurcations. Comput Methods Biomech Biomed Engin. 2011;14:797–802. doi: 10.1080/10255842.2010.495066. [DOI] [PubMed] [Google Scholar]
- 10.De Santis G, et al. Patient-specific computational fluid dynamics: structured mesh generation from coronary angiography. Med Biol Eng Comput. 2010;48:371–380. doi: 10.1007/s11517-010-0583-4. [DOI] [PubMed] [Google Scholar]
- 11.Ku DN, Giddens DP, Zarins CK, Glagov S. Pulsatile flow and atherosclerosis in the human carotid bifurcation. Positive correlation between plaque location and low oscillating shear stress. Arterioscler Dallas Tex. 1985;5:293–302. doi: 10.1161/01.atv.5.3.293. [DOI] [PubMed] [Google Scholar]
- 12.Auricchio F, Conti M, Ferrara A, Morganti S, Reali A. Patient-specific finite element analysis of carotid artery stenting: a focus on vessel modeling. Int J Numer Methods Biomed Eng. 2013;29:645–664. doi: 10.1002/cnm.2511. [DOI] [PubMed] [Google Scholar]
- 13.Sahni O, Müller J, Jansen KE, Shephard MS, Taylor CA. Efficient anisotropic adaptive discretization of the cardiovascular system. Comput Methods Appl Mech Eng. 2006;195:5634–5655. [Google Scholar]
- 14.Vinchurkar S, Longest PW. Evaluation of hexahedral, prismatic and hybrid mesh styles for simulating respiratory aerosol dynamics. Comput Fluids. 2008;37:317–331. [Google Scholar]
- 15.Antiga L, Ene-Iordache B, Caverni L, Cornalba GP, Remuzzi A. Geometric reconstruction for computational mesh generation of arterial bifurcations from CT angiography. Comput Med Imaging Graph Off J Comput Med Imaging Soc. 2002;26:227–235. doi: 10.1016/s0895-6111(02)00020-4. [DOI] [PubMed] [Google Scholar]
- 16.Baudouin TC, Remacle JF, Marchandise E, Henrotte F, Geuzaine C. A frontal approach to hex-dominant mesh generation. Adv Model Simul Eng Sci. 2014;1:1–30. [Google Scholar]
- 17.Verma CS, Fischer PF, Lee SE, Loth F. An All-Hex Meshing Strategy for Bifurcation Geometries in Vascular Flow Simulation. In: Hanks BW, editor. Proceedings of the 14th International Meshing Roundtable. Springer; Berlin Heidelberg: 2005. pp. 363–375. [Google Scholar]
- 18.Ali Z, Tucker PG. Multiblock Structured Mesh Generation for Turbomachinery Flows. In: Sarrate J, Staten M, editors. Proceedings of the 22nd International Meshing Roundtable. Springer International Publishing; 2014. pp. 165–182. [DOI] [Google Scholar]
- 19.De Santis G, et al. Full-hexahedral structured meshing for image-based computational vascular modeling. Med Eng Phys. 2011;33:1318–1325. doi: 10.1016/j.medengphy.2011.06.007. [DOI] [PubMed] [Google Scholar]
- 20.Bols J, et al. Unstructured hexahedral mesh generation of complex vascular trees using a multi-block grid-based approach. Comput Methods Biomech Biomed Engin. 2016;19:663–672. doi: 10.1080/10255842.2015.1058925. [DOI] [PubMed] [Google Scholar]
- 21.Wittek A, Grosland NM, Joldes GR, Magnotta V, Miller K. From Finite Element Meshes to Clouds of Points: A Review of Methods for Generation of Computational Biomechanics Models for Patient-Specific Applications. Ann Biomed Eng. 2015;44:3–15. doi: 10.1007/s10439-015-1469-2. [DOI] [PubMed] [Google Scholar]
- 22.Otoguro Y, Takizawa K, Tezduyar TE. Space–time VMS computational flow analysis with isogeometric discretization and a general-purpose NURBS mesh generation method. Comput Fluids. 2017 doi: 10.1016/j.compfluid.2017.04.017. [DOI] [Google Scholar]
- 23.Xiong G, Musuvathy S, Fang T. Automated Structured All-Quadrilateral and Hexahedral Meshing of Tubular Surfaces. In: Jiao X, Weill J-C, editors. Proceedings of the 21st International Meshing Roundtable. Springer; Berlin Heidelberg: 2013. pp. 103–120. [Google Scholar]
- 24.De Santis G, De Beule M, Segers P, Verdonck P, Verhegghe B. Patient-specific computational haemodynamics: generation of structured and conformal hexahedral meshes from triangulated surfaces of vascular bifurcations. Comput Methods Biomech Biomed Engin. 2011;14:797–802. doi: 10.1080/10255842.2010.495066. [DOI] [PubMed] [Google Scholar]
- 25.Antiga L, Steinman DA. Robust and objective decomposition and mapping of bifurcating vessels. IEEE Trans Med Imaging. 2004;23:704–713. doi: 10.1109/tmi.2004.826946. [DOI] [PubMed] [Google Scholar]
- 26.Ghaffari M, Hsu CY, Linninger AA. Automatic Reconstruction and Generation of Structured Hexahedral Mesh for Non-planar Bifurcations in Vascular Networks. Comput Aided Chem Eng. 2015;37:635–640. [Google Scholar]
- 27.Guo J, Li S, Chui YP, Qin J, Heng PA. Mesh quality oriented 3D geometric vascular modeling based on parallel transport frame. Comput Biol Med. 2013;43:879–888. doi: 10.1016/j.compbiomed.2013.04.004. [DOI] [PubMed] [Google Scholar]
- 28.Hsu CY, et al. Automatic recognition of subject-specific cerebrovascular trees. Magn Reson Med. 2017;77:398–410. doi: 10.1002/mrm.26087. [DOI] [PMC free article] [PubMed] [Google Scholar]
- 29.Hsu CY, Schneller B, Ghaffari M, Alaraj A, Linninger A. Medical Image Processing for Fully Integrated Subject Specific Whole Brain Mesh Generation. Technologies. 2015;3:126–141. [Google Scholar]
- 30.Hsu CY, et al. Gap-free segmentation of vascular networks with automatic image processing pipeline. Comput Biol Med. 2017;82:29–39. doi: 10.1016/j.compbiomed.2017.01.012. [DOI] [PubMed] [Google Scholar]
- 31.Antiga L, Ene-iordache B, Remuzzi A. Centerline Computation and Geometric Analysis of Branching Tubular Surfaces with Application to Blood Vessel Modeling; Proceedings of the 11th International Conference in Central Europe on Computer Graphics; Plzen, Czech Republic. 2003. pp. 11–18. [Google Scholar]
- 32.Antiga L, Ene-Iordache B, Remuzzi A. Computational geometry for patient-specific reconstruction and meshing of blood vessels from MR and CT angiography. IEEE Trans Med Imaging. 2003;22:674–684. doi: 10.1109/TMI.2003.812261. [DOI] [PubMed] [Google Scholar]
- 33.Govil-Pai S. Principles of Computer Graphics: Theory and Practice Using OpenGL and Maya®. Springer Science & Business Media; 2006. [Google Scholar]
- 34.Boehm W, Müller A. On de Casteljau’s algorithm. Comput Aided Geom Des. 1999;16:587–605. [Google Scholar]
- 35.Do Carmo MP. Differential Geometry of Curves and Surfaces. Prentice-Hall; 1976. [Google Scholar]
- 36.Chang JW, Choi YK, Kim MS, Wang W. Computation of the minimum distance between two Bézier curves/surfaces. Comput Graph. 2011;35:677–684. [Google Scholar]
- 37.Elber G, Lee IK, Kim MS. Comparing offset curve approximation methods. IEEE Comput Graph Appl. 1997;17:62–71. [Google Scholar]
- 38.van Ertbruggen C, Hirsch C, Paiva M. Anatomically based three-dimensional model of airways to simulate flow and particle transport using computational fluid dynamics. J Appl Physiol. 2005;98:970–980. doi: 10.1152/japplphysiol.00795.2004. [DOI] [PubMed] [Google Scholar]
- 39.Hartung G, Alaraj A, Linninger A. Walk-In Brain: Virtual reality environment for immersive exploration and simulation of brain metabolism and function. Comput Aided Chem Eng. 2017;39:649–658. [Google Scholar]
- 40.Shakur SF, et al. Validation of cerebral arteriovenous malformation hemodynamics assessed by DSA using quantitative magnetic resonance angiography: preliminary study. J NeuroInterventional Surg. 2017 doi: 10.1136/neurintsurg-2017-012991. neurintsurg-2017-012991. [DOI] [PubMed] [Google Scholar]
- 41.Zhang Y, Bajaj C. Adaptive and Quality Quadrilateral/Hexahedral Meshing from Volumetric Data. Comput Methods Appl Mech Eng. 2006;195:942–960. doi: 10.1016/j.cma.2005.02.016. [DOI] [PMC free article] [PubMed] [Google Scholar]
- 42.Zienkiewicz OC, Taylor RL. The Finite Element Method: Solid mechanics. Butterworth-Heinemann; 2000. [Google Scholar]
- 43.Wellnhofer E, Goubergrits L, Kertzscher U, Affeld K, Fleck E. Novel non-dimensional approach to comparison of wall shear stress distributions in coronary arteries of different groups of patients. Atherosclerosis. 2009;202:483–490. doi: 10.1016/j.atherosclerosis.2008.05.044. [DOI] [PubMed] [Google Scholar]
- 44.Malek AM, Alper SL, Izumo S. Hemodynamic shear stress and its role in atherosclerosis. JAMA. 1999;282:2035–2042. doi: 10.1001/jama.282.21.2035. [DOI] [PubMed] [Google Scholar]
- 45.Buelow BEO, Venkateswaran S, Merkle CL. Convergence acceleration of implicit schemes in the presence of high aspect ratio grid cells. 1993 [Google Scholar]
- 46.De Santis G. Novel mesh generation method for accurate image-based computational modelling of blood vessels. Ghent University; 2011. [Google Scholar]
- 47.Longest PW, Vinchurkar S. Effects of mesh style and grid convergence on particle deposition in bifurcating airway models with comparisons to experimental data. Med Eng Phys. 2007;29:350–366. doi: 10.1016/j.medengphy.2006.05.012. [DOI] [PubMed] [Google Scholar]
- 48.Mortier P, et al. A novel simulation strategy for stent insertion and deployment in curved coronary bifurcations: comparison of three drug-eluting stents. Ann Biomed Eng. 2010;38:88–99. doi: 10.1007/s10439-009-9836-5. [DOI] [PubMed] [Google Scholar]
- 49.Swillens A, Degroote J, Vierendeels J, Lovstakken L, Segers P. A simulation environment for validating ultrasonic blood flow and vessel wall imaging based on fluid-structure interaction simulations: Ultrasonic assessment of arterial distension and wall shear rate. Med Phys. 2010;37:4318–4330. doi: 10.1118/1.3462592. [DOI] [PubMed] [Google Scholar]
- 50.Alastruey J, Parker KH, Peiró J, Byrd SM, Sherwin SJ. Modelling the circle of Willis to assess the effects of anatomical variations and occlusions on cerebral flows. J Biomech. 2007;40:1794–1805. doi: 10.1016/j.jbiomech.2006.07.008. [DOI] [PubMed] [Google Scholar]
- 51.Amini A, Osborn AG, McCall TD, Couldwell WT. Remote Cerebellar Hemorrhage. Am J Neuroradiol. 2006;27:387–390. [PMC free article] [PubMed] [Google Scholar]
- 52.Mitha AP, et al. Can the windkessel hypothesis explain delayed intraparenchymal haemorrhage after flow diversion? A case report and model-based analysis of possible mechanisms. Heart Lung Circ. 2015;24:824–830. doi: 10.1016/j.hlc.2015.02.001. [DOI] [PubMed] [Google Scholar]
- 53.Adib MAHM, Ii S, Watanabe Y, Wada S. Minimizing the blood velocity differences between phase-contrast magnetic resonance imaging and computational fluid dynamics simulation in cerebral arteries and aneurysms. Med Biol Eng Comput. 2017;55:1605–1619. doi: 10.1007/s11517-017-1617-y. [DOI] [PubMed] [Google Scholar]


