

Abstract
The patient-specific biomechanical analysis of the aorta requires in vivo mechanical properties of individual patients. Existing approaches for estimating in vivo material properties often demand high computational cost and mesh correspondence of the aortic wall between different cardiac phases. In this paper, we propose a novel multi-resolution direct search (MRDS) approach for estimation of the nonlinear, anisotropic constitutive parameters of the aortic wall. Based on the finite element (FE) updating scheme, the MRDS approach consists of the following three steps: (1) representing constitutive parameters with multiple resolutions using principal component analysis (PCA), (2) building links between the discretized PCA spaces at different resolutions, and (3) searching the PCA spaces in a ‘coarse to fine’ fashion following the links. The estimation of material parameters is achieved by minimizing a node-to-surface error function, which does not need mesh correspondence. The method was validated through a numerical experiment by using the in vivo data from a patient with ascending thoracic aortic aneurysm (ATAA), the results show that the number of FE iterations was significantly reduced compared to previous methods. The approach was also applied to the in vivo CT data from an aged healthy human patient, and using the estimated material parameters, the FE-computed geometry was well matched with the image-derived geometry. This novel MRDS approach may facilitate the personalized biomechanical analysis of aortic tissues, such as the rupture risk analysis of ATAA, which requires fast feedback to clinicians.
Keywords: constitutive parameter estimation, multi-resolution direct search, principal component analysis, finite element analysis
1 Introduction
With the advancement of clinical cardiac imaging modalities and computational tools, patient-specific biomechanical evaluation of aortic disease conditions, such as aortic aneurysm dissection and rupture, is getting closer to reality. Among the three key components necessary for an engineering biomechanics analysis, i.e., geometries, material properties, and loading boundary conditions, the patient-specific in vivo material properties is clearly the biggest unknown. Indeed, accurate estimation of in vivo mechanical properties of the aortic wall, which is nonlinear and anisotropic, has been a challenging problem in the field of cardiovascular biomechanics for several decades (Taylor and Figueroa, 2009).
The methods that use the strain/displacement/stress field measurements to back out the material properties of the aortic wall are collectively referred as the inverse method (Grédiac et al., 2006). Based on the measurement of in vitro displacement field from an unloaded configuration to the loaded state (Kroon and Holzapfel, 2009; Zhao et al., 2009), an error function is often defined to quantify the discrepancy between the predicted and experimental results. The constitutive parameters, used to define the material properties, are inversely identified by minimizing the error function using certain iterative schemes. Accordingly, the virtual field method (Grédiac et al., 2006) has been developed for extracting constitutive parameters from in vitro full-field measurement data (Avril et al., 2010; Genovese et al., 2013) of blood vessels. However, the unknown unloaded state makes it a challenging task to estimate the constitutive parameters from in vivo loaded geometries.
To estimate the in vivo mechanical properties, simplifications and assumptions were made in several studies. By assuming linear elastic constitutive relations, (Liu and Shi, 2009), (Zhang et al., 2017) and (Franquet et al., 2013) identified linear elastic material parameters from in vivo images. By assuming a perfect cylindrical shape of the arteries, (Schulze-Bauer and Holzapfel, 2003) identified Fung-type material parameters, (Masson et al., 2011; Masson et al., 2008; Olsson and Klarbring, 2006; Stålhand, 2009) estimated material parameters using the constitutive model proposed in (Holzapfel et al., 2000) together with geometrical parameters, (Smoljkić et al., 2015) estimated the Gasser–Ogden-Holzapfel (GOH) model (Gasser et al., 2006) parameters. (Trabelsi et al., 2016) proposed a multiple linear regression-based method to estimate the constitutive parameters by assuming a linear relation between the volume of the aorta and the constitutive parameters of the Demiray model.
To account for the patient-specific geometries, the finite element (FE) updating scheme is typically used to estimate in vivo mechanical properties from multi-phase cardiac images, following the steps of: (1) recovering the unpressurized geometry, (2) deforming the geometry with in vivo loading and boundary conditions and initial candidate constitutive parameters, and (3) by using certain optimization methods, the estimated constitutive parameters will be iteratively adjusted to ensure certain physical measurements (e.g. strain/displacement) are matched between the FE-deformed configuration and the in vivo configuration. This optimization process yields the best set of estimated constitutive parameters. Using such strategies, (Liu et al., 2012) determined the modified Moony-Rivlin parameters of the carotid artery from 2D slices reconstructed from MRI. (Zeinali-Davarani et al., 2011) evaluated the local wall thickness and material anisotropy of the aorta, while the constitutive parameters were determined through biaxial tests. (Wittek et al., 2016; Wittek et al., 2013) developed two methods to determine patient-specific GOH material parameters of the human abdominal aorta from in vivo 4D ultrasound strain measurements. However, for the FE updating approach, the convexity of the error function is usually not guaranteed, i.e. can have multiple local optima. Different material parameters may be nonlinearly coupled in their contributions to the overall mechanical response. To avoid stuck in the local optima, mixed stochastic-deterministic optimization methods were used by (Wittek et al., 2016; Wittek et al., 2013). However, numerous iterations were needed to reach the optimal solution in these methods, often resulting in computing time of 1~2 weeks. The high computational cost could inhibit the practical use of these methods, particularly in a clinical setting requiring rapid feedback to clinicians.
The full-field displacement measurement, which establishes mesh correspondence between different configurations, is often required for the material parameter estimation (Avril et al., 2010; Wittek et al., 2016; Wittek et al., 2013; Zhao et al., 2009). The in vivo mesh correspondence of the abdominal aorta may be obtained using the 4D ultrasound data (Compas et al., 2014; Karatolios et al., 2013), for which speckle patterns are used. However, the 4D ultrasound imaging is not routinely used for thoracic aortic wall because of the limited field-of-view (van Disseldorp et al., 2016). The mesh correspondence can be difficult to obtain from CT and MRI. Thus, the absence of in vivo mesh correspondence poses a critical challenge for material parameter identification.
In this study, we proposed a multi-resolution direct search (MRDS) approach for the in vivo material parameter estimation of the aortic wall by using in vivo loaded geometries at two cardiac phases with known blood pressures. This approach is based on the general framework of FE updating and the objective is to match the FE deformed geometry with the in vivo measured geometry by minimizing a node-to-surface error function, which does not require mesh correspondence. The parameter optimization is based on the idea of “coarse-to-fine” search, for which multiple level representations of material parameters with different resolutions are built using principal component analysis (PCA) prior to the optimization process. Since the number of FE iterations is significantly reduced, this method can obtain the material parameter for a patient in 1~2 days. The accuracy of the method was examined by a numerical verification.
2 Methods
2.1 Prerequisites and Assumptions
The constitutive parameters of homogeneous (average) mechanical properties of the aortic wall segment will be estimated in our approach, which has three main assumptions. (1) In vivo loaded geometries of the aorta and blood pressure levels are known at 2 phases, e.g., diastole and systole. However, mesh correspondence between the two phases is not required (i.e. displacement field can be unknown); (2) Wall thickness of the unpressurized geometry is assumed to be a known constant according to our previous experiments (Martin et al., 2015); and (3) the residual stresses are ignored. The unpressurized geometry is assumed to be the reference configuration.
2.2 Constitutive Model
The Gasser-Ogden-Holzapfel (GOH) model (Gasser et al., 2006) was used to model the mechanical response of the aortic wall tissue. In this model, tissues are assumed to be composed of a matrix material with two families of embedded fibers, each of which has a preferred direction. The fiber directions can be mathematically described using two unit vectors. The strain energy function can be expressed by
| (1) |
where C10 is a material parameter to describe the matrix material. k1 is a positive material parameter that has the same dimension of stress, while k2is a dimensionless parameter. The deviatoric strain invariant is used to characterize the matrix material, and the deviatoric strain invariant is used to characterize the fiber families. is equal to squares of the stretches in the fiber directions. κ is used as a dispersion parameter describing the distribution of fiber orientation. When κ = 0, the fibers are perfectly aligned. When κ = 0.33, the fibers are randomly distributed, and the material becomes isotropic. The mean fiber directions were assumed symmetric with respect to the circumferential axis of the local coordinate system. The parameter defines the angle between one of the mean local fiber direction and the circumferential axis of the local coordinate system. Thus, the five material parameters in this model need to be identified, i.e., (C10, k1, k2, κ, θ). The constitutive model is a built-in model in ABAQUS 6.14. Shell elements were used to model the aortic wall, by which the incompressibility of the aortic wall is enforced.
2.3 Workflow of Constitutive Parameter Estimation
The workflow for constitutive parameter estimation is illustrated in Figure 1. Briefly, given a set of material parameters, the unpressurized geometry is first recovered from the in vivo diastolic geometry using the modified version of backward displacement method (Bols et al., 2013; Liang et al., 2017); and the systolic pressure is applied to the unpressurized geometry in FE simulation; then the simulated systolic geometry is compared with the measured systolic geometry Ωsys reconstructed from in vivo image. By using the multi-resolution direct search (MRDS) method (to be described below in detail), the constitutive parameters are adjusted to minimize the average node-to-surface distance between the measured systolic geometry Ωsys and FE deformed systolic geometry .
Figure 1.

Flow chart of the material parameter estimation process. The backward displacement iteration is set to be 10 according to (Liang et al., 2017)
We define the node-to-surface distance between a node X of a quadrilateral shell mesh surface and a triangulated mesh surface Ω as
| (2) |
where X is the coordinate vector of a node; Z is a point on the triangulated mesh surface (it may be located on a vertex, edge or face). ‖■‖ denotes 3D Euclidean norm. Through optimization, for X, the shortest distance to the surface Ω can be obtained. Note that the order of X and Ω matters, i.e., dist(X, Ω) ≠ (Ω, X). This distance measure will be used to define an objective function which compares the FE deformed geometry and the measured geometry Ωsys.
In order to have the symmetric property, the objective function, which measures the average node-to-surface distances between Ωsys and , is defined as
| (3) |
where is the coordinate vector of the nth node on , and Xn is the coordinate vector of the nth node on Ωsys; N is the number of nodes. Therefore the mean distance εsys measures the difference between the measured geometry Ωsys and FE deformed geometry . For simplicity, within Eqn. (3) and have equal weights, because Ωsys and have the same number of nodes, which is achieved by using the re-meshing algorithm previously developed in our group (Liang et al., 2017). We note that, although they have the same number of nodes after remeshing, the meshes do not have physical correspondences between nodes; and therefore a node-to-node matching-based objective function is meaningless. For more general cases, one may modify the weights for geometries with unequal number of nodes.
In practice, the surfaces Ωsys and are first meshed with quadrilateral shell elements (S4R in ABAQUS) for FE simulations, then, for the node-to-surface distance calculations, triangulation was performed on the surface such that a quadrilateral element is divided into two triangle elements without modifying the nodal coordinates.
In general, the material parameter optimization problem associated with Eq.(3) is nonlinear, multivariate and non-convex; and such a problem may exhibit several local optima. Jacobian-based deterministic optimization methods may not guarantee a global optimum. Mixed stochastic-deterministic methods are usually used in the literature (Wittek et al., 2016; Wittek et al., 2013), where initial values of the material parameters are assigned randomly as the “seeds” for the deterministic optimization methods. However, by directly searching in the constitutive parameter space, these methods often require numerous iterations and thus demand a huge computing time. In this study, we propose a faster approach using the MRDS strategy, which can significantly speed up the optimization process.
2.4 The MRDS Strategy
The key idea of the MRDS approach is to decompose the searching space with multiple resolutions, resulting in multiple level representations of the constitutive parameters, from coarse to fine. For simplicity, throughout this paper, we will use the term “level” as the abbreviation of “a level of searching space with a certain resolution”. Rather than searching using the gradient of the objective function in the constitutive parameter space, the MRDS maps the constitutive parameters into a new space using principal component analysis (PCA) and searches in the PCA space at different levels and finds the best one. Therefore, to obtain the multiple level representations, the new PCA space must be discretized into numerous points with multiple resolutions (a point corresponds to a set of material parameters); and the points at one level are sparsely linked to the similar points at adjacent levels; and the links are generated according to the Euclidean distance between points. After a search is performed at the current level, the current best point (i.e. a set of material parameters) is selected; and then following the links associated with the selected point, a new search starts at the next level. As a result, the MRDS method operates on the discrete PCA spaces from the first level with the lowest resolution to the last level with the highest resolution, and the best parameter-candidate will be identified eventually.
2.4.1 Constitutive Parameter Representations with Multiple Resolutions Using Principal Component Analysis
Following the procedure shown in Figure 2, in order to obtain the multiple level representations of material parameters, of which the stress-stretch curves are uniformly distributed, we use stress-stretch curves to represent the constitutive parameters, which map the constitutive parameter space to the “stress-stretch curve space”, and then convert the “stress-stretch curve space” to a PCA space and sample the PCA space uniformly.
Figure 2.

Procedures to build resolutions and links.
First, the GOH constitutive parameter space was densely sampled and the corresponding stress-stretch curves were generated. To ensure the constitutive parameters are physiologically possible, i.e. consistent with the experiment data (Martin et al., 2015; Pierce et al., 2015b; Weisbecker et al., 2012), data range constraints were applied on the parameters as shown in Table 1. Rule-based selection criteria, which were fine-tuned to ensure all the parameters extracted from our previous experiments (Martin et al., 2015) were included (provided in Appendix), were applied on the stress-stretch curves. After the sampling and selection processes, a total of 3,409,040 sets of material parameters were obtained. For each set of constitutive parameters, the stress-stretch curves were obtained by simulating stretch-controlled biaxial tension in MATLAB by assuming the tissue is loaded in the plane stress state and the material is incompressible. The simulations were based on 3 protocols: (1) in the circumferential strip biaxial tension, fixing λ2 = 1 while increasing λ1; (2) in the equi-biaxial tension, keeping the ratio λ1/λ2 = 1; (3) in the longitudinal strip biaxial tension, fixing λ1 = 1 while increasing λ2. λ1 and λ2 is increased gradually by an interval of 0.01. σ1 and λ1 denote the circumferential stress and stretch. σ2 and λ2 denote the longitudinal stress and stretch. A total of 6 curves from the 3 protocols are generated for each set of material parameters.
Table 1.
Upper, lower bounds and increment of constitutive parameters for sampling.
| C10 (kPa) | k1(kPa) | k2 | κ | θ(°) | |
|---|---|---|---|---|---|
| Lower bound | 0 | 0 | 0 | 0 | 0 |
| Upper bound | 100 | 10000 | 50 | 1/3 | 90 |
| Increment | 5 | 50 | 2.5 | 1/15 | 15 |
Furthermore, for each set of material parameters, the stress-stretch curves were sampled at evenly-spaced discrete stress values (21 stress values for the σ2~λ1 curve in protocol-1 and the σ1~λ2 curve in protocol-3 as the stress level is usually lower in the fixed direction than the tensile direction, 41 stress values for the rest of curves), the corresponding stretch values were recorded and stacked in a vector. Therefore, for each set of material parameters, a vector Y of 206 stretch values is assembled from the 6 stress-stretch curves. Thus, there are one-to-one correspondences between the sets of material parameters and the assembled vectors.
Then, PCA (Webb and Copsey, 2011) was performed on a total of 3,409,040 vectors to obtain a compact representation of each vector. Briefly, the PCA is a statistical procedure that uses an orthogonal transformation to convert the data to a new coordinate system such that in the new space the first coordinate (principal component) accounts for the largest variability in the data, and each succeeding component in turn has the highest variance. PCA is a standard technique for dimensionality reduction, in which the original data can be well represented (i.e. approximated) by a few principal components in the new space. After applying PCA, each vector Y can be represented by:
| (4) |
where represents the population mean of the vectors, and PC1,…, PCm are the principal components. m is the number of principal components used for the approximation. and PCi are the same for every vector Y. α1,…, αm are the coefficients and different for different vector Y, i.e., different material properties, which implies that a set of material parameters is now encoded by a set of coefficients. The first 5 principal components (m = 5) are retained to represent the material properties, which accounts for 98.6% of the overall variability, i.e., an approximation error of 1.4%. Therefore each vector Y, corresponding to a set of material parameters, can be well represented by a new vector A of only 5 components α1, …, α5. The pace of the coefficients is called the PCA space, and an axis in the PCA space is called PC axis. Therefore, sampling the “stress-stretch curve space” is now equivalent to sampling the PCA space. Each PC axis represents a variation pattern of the stress-stretch curves, and Figure 3 shows the exemplar stress-stretch curves generated by using Eq.(4).
Figure 3.

The exemplar stress-stretch curves in the circumferential strip biaxial protocol, generated by using Eq.(4). μ1, μ2, μ3 are eigenvalues of the covariance matrix in the PCA algorithm, which are exemplar values of α1, α2, α3 in Eq.(4).
Next, we obtained multi-level representations of the PCA space by sampling the PCA space with different resolutions (i.e. bin size), from coarse to fine. The “closest-to-bin-center” algorithm was developed to choose the points at a level of the PCA space. Specifically, the PCA space was partitioned into bins (i.e. boxes) with a desirable size at each level. Within a particular bin, the algorithm would search for the closest point to the center of the bin in the PCA space.
| (5) |
where k stands for the index of the bin, A represents the coordinate vector of a point in the PCA space within the bink, Ck is the coordinate vector of the bin center. The closest point to the bin center, Sk, will be found. The PCA space was partitioned at 4 levels also in a coarse-to-fine fashion. For the jth level (j ≤ 4), the partition was performed only in the sub-space consisting of PC axes from PC1 to PCj+1. For example, for the first level, only the PC1~PC2 plane are partitioned, and the bin (i.e. 2D square) center coordinates for higher dimensions are set to zeros (i.e. Ck(i) = 0 if i > 2), representing a mean response for the higher dimensions. At each level, sampling the PCA space with certain resolution can be achieved by controlling the bin size. Therefore, by increasing the number of levels, the desired searching accuracy will be achieved. To limit the computing cost, four levels were constructed. At the first level, a total of 12 points were selected from the PCA space, which corresponds to 12 sets of material parameters. Then, a total of 117, 1197 and 10529 points were chosen in the second, third and fourth levels respectively. In Figure 4, the 4 levels as well as the original 3,409,040 data points are plotted in the projections of the PCA space. For the first and second levels, the stress-stretch curves obtained by using the circumferential strip biaxial protocol are shown in Figure 5. Therefore, the representation of the material parameter space at a level is a set of points in the PCA space. A level with a higher (or lower) resolution refers to a point-set with a larger (or smaller) number of points, and there are 4 levels, i.e., 4 point-sets, in total.
Figure 4.

Overlay plots of the 4 levels projected in (a) PC1~PC2 and (b) PC2~PC3 plane. The ‘butter-fly’ shape in PCA space reflects the characteristics of the data: 1) a stretch-stress curve has a non-random shape (i.e. “J” shape) which rules out many points in PCA space that may correspond to non-“J” shapes; and 2) many points in PCA space have been eliminated by the rule-based selection criteria to reject infeasible material parameters (see Appendix).
Figure 5.

The stress-stretch curves in the circumferential strip biaxial protocol for the first and second levels.
Comparison to random sampling and uniform sampling in the material parameter space
Although it is much simpler to directly sample the material parameter space with the same range constraints using a uniform random number generator (e.g. “rand” in MATLAB), compared to the procedure in Figure 2, the resulting stress-stretch curves are distributed randomly as shown in Figure 6a. Deterministic uniform sampling in the parameter space also results in clustered curves, which are plotted in Figure 6b. Our methods ensure that the stress-stretch curves have a nearly uniform distribution at each level.
Figure 6.

The stress-stretch curves in the circumferential strip biaxial protocol obtained by (a) randomly sampling 117 points from the material parameter space (the rule-based selection criteria has been applied) and (b) uniform sampling 150 points from the material parameter space: the sampling is done in two steps 1) sampling 3×3×3×3×3=243 points evenly for the five parameters and 2) applying the rule-based selection criteria (see Appendix).
2.4.2 Links between Adjacent Levels
When a point (i.e. a set of material parameters) in the current level is selected by the MRDS (e.g., point A gives a minimum value of Eq.(3) in the current level), further searching needs to be performed at similar points (i.e., with similar material properties) in the next level of a higher resolution. Therefore, hierarchy links between the points at adjacent levels need to be established to guide the MRDS process. To build these links, we followed three intuitive principles: (1) any two points connected by a link should be similar (i.e. similar material properties); (2) every point must have at least one link; and (3) a tradeoff between the total number of links and computational cost should be made: a large number of links can ensure a large search range, but increasing the number of links will lead to the increase of computational cost. To follow the first principle, Euclidean distance in the PCA space was used to measure the distance (i.e. similarity) between two points, and a local neighbor searching method was used to find similar points. For a point A at the current level, the 10 nearest points in the next level with higher resolution (forward linking), and the 2 nearest points in the previous level with lower resolution (backward linking), were identified and linked to point A. Thus, every point in the current level is linked to at least two points in adjacent levels, which satisfies the second principle. By following the first and the second principles, a network of links were built. To reduce the complexity according to the third principle, these links were examined based on the following rule: if the distance between two linked points is larger than a threshold (set to 2), then the link will be removed if not breaking the second principles. After the links are established for all levels, a point at a level will be linked to some points (about 20 on average from forward and backward linking) at the next level with higher resolution. Thus, starting from any point at the first level, the searching can always reach a point at the last level through the links, and for each point at the last level, it can always be traced back through the links to at least a point at the first level. Figure 7 shows the links between the first two levels in the PCA space.
Figure 7.

Links between the first 2 levels projected in the PC1~PC2~PC3 space.
Since MRDS is based on FE updating, searching along a link means performing a series of FE simulations to evaluate the goodness of a set of material parameters (Figure 1). Therefore, by controlling the complicity of the link network, we can control the number of FE simulations. Here, the adjustable parameters of the link network are (1) the maximum number of nearest points linked between levels and (2) the distance threshold of each link. In this study, the parameters have been selected such that on average 12(level 1) + 3(level 2~4) × 20 points (i.e. 72 sets of material parameters) will be evaluated by FEA to obtain the final solution, translating to a computational time within 2 days using a quad-core CPU.
2.4.3 The Searching Algorithm
The MRDS algorithm starts from the first level by evaluating the 12 points (i.e. parameter-candidates), and the best point will be identified by evaluating the objective function in Eq.(3). The search starts again at the second level by only evaluating the points linked to the best point in the first level. The search will be performed in a similar manner for the third and fourth levels. After the search process completes at the fourth level, the best point will give the final estimation of the constitutive parameters.
3. Results
3.1 Numerical Validation
The proposed method was validated in a numerical experiment by using a real patient geometry and experimentally-derived material parameters. The clinical cardiac CT image data from a patient with ascending thoracic aortic aneurysms (ATAA) was obtained at Yale-New Haven Hospital (New Haven, CT). Institutional Review Broad approval to review de-identified images was obtained for this study. The 3D CT image was acquired at the systolic phase, and the systolic pressure was equivalent to 120 mmHg. The patient underwent surgical repair and the ATAA had been excised. The constitutive parameters of the ATAA tissue from this patient were extracted from 7-protocol biaxial tensile tests in a previous study (Martin et al., 2013). The geometry of the aorta was reconstructed by using the semi-automatic method developed in our previous study (Wang et al., 2011), and the branches at the aortic arch were trimmed.
For the validation, the following methods were used to obtain the “measured” geometries at the diastolic and systolic phases. The unloaded geometry of the aortic wall was recovered from the reconstructed geometry from the CT image by using the modified backward displacement method (Bols et al., 2013; Liang et al., 2017), for which the experimentally derived material parameters were utilized and a constant wall thickness of 2 mm at the unloaded state was assumed based on our previous experimental study (Martin et al., 2015). The “measured” diastolic and systolic geometries were obtained from finite element simulations by applying diastolic (P=80mmHg) and systolic (P=120mmHg) pressures on the unloaded geometry.
In all FE simulations, shell elements S4R in ABAQUS 6.14 and the GOH model were used. Constant pressures were applied uniformly to the inner surface of the FE models, and the boundary nodes of the models, i.e. the proximal and distal ends of the models, were only allowed to move in the radial direction in local cylindrical coordinate systems.
The search process in the validation is shown in Figure 8. It started from the first level, and the material that led to the minimum objective in Eq.(3) was identified and linked to candidate materials at the second level. Evaluations of the objective were then performed on the linked candidate materials at the second level. The candidate materials gradually clustered together in the subsequent levels, and finally, the estimated curve was very close to the curve corresponding to experimentally-derived material parameters.
Figure 8.

Convergence of estimated material parameters to the experimentally-derived material parameters using the MRDS method. The equi-biaxial stress-stretch curves are plotted in each level from (a) to (d).
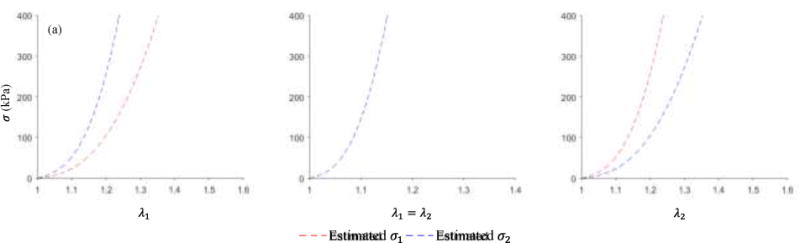
The experimentally-derived parameters and the estimated parameters in the numerical validation are shown in Table 2, and the corresponding stress-stretch curves are depicted in Figure 9. Although the difference in constitutive parameters is obvious, the biaxial stress-stretch curves have good agreement, which is demonstrated by the coefficients of determination. The results indicate that the estimated mechanical properties resemble the experimentally-derived material response. As shown in Figure 10, the average of node-to-surface distances between the “measured” and estimated systolic geometries was 0.0818 mm by using Eq.(3), which means the objective function was indeed minimized by the estimated parameters.
Table 2.
Experimentally-derived and estimated constitutive parameters in the numerical validation.
| C10 (kPa) | k1(kPa) | k2 | κ | θ(°) | |
|---|---|---|---|---|---|
| Experiment | 29.91 | 512.56 | 0.00 | 0.3190 | 90 |
| Estimated | 40 | 350 | 0.00 | 0.2667 | 60 |
Figure 9.

Stretch-stress curves in the numerical validation for (a) strip biaxial tension in the circumferential direction; (b) equi-biaxial tension; (c) strip biaxial tension in the longitudinal direction.
Figure 10.

Comparison of the “measured” and estimated geometries at the systolic phase in the numerical validation. εsys is the average of node-to-surface distances between the “measured” and estimated systolic geometries. The “measured” geometry is displayed in triangle mesh, estimated systolic geometry is displayed in quadrilateral shell mesh.
3.2 Estimation of In Vivo Mechanical Properties of an Aged Human Healthy Aorta
Full phase cardiac multi-slice CT (MSCT) scans were collected from a patient of age 71 at Hartford Hospital (Hartford, CT). Institutional Review Broad approval to review de-identified images was obtained for this study. The patient did not have TAA, severe aortic stenosis or bicuspid aortic valve. The MSCT examination was performed on a GE LightSpeed 64-channel volume computed tomography scanner. The spatial resolution of the image data was 0.49×0.49×1.25 mm. Images were obtained with helical scanning and ECG gating, encompassing 10 phases over the cardiac cycle. The diastolic and systolic geometries were identified and reconstructed semi-automatically (Wang et al., 2011). The iterative closest point (ICP) algorithm (Besl and McKay, 1992; Chen and Medioni, 1991) was used to rigidly transform the systolic geometry to align with the diastolic geometry. The two geometries were then served as the input to the MRDS method. The MRDS method was then applied to estimate the material parameters for this healthy patient, and the estimated parameters are listed in Table 3 and the stress-stretch curves are plotted in Figure 11. Figure 12 shows the comparison between the estimated, FE deformed systolic geometry and the systolic geometry reconstructed from CT image, and the average of node-to-surface distances was 0.5234 mm by using Eq.(3).
Table 3.
Estimated constitutive parameters for the healthy aorta.
| C10 (kPa) | k1(kPa) | k2 | κ | θ(°) | |
|---|---|---|---|---|---|
| Estimated | 30 | 4750 | 2.5 | 0.3333 | 0 |
Figure 11.
Estimated stress-stretch curves for the healthy aorta for (a) strip biaxial tension in the circumferential direction; (b) equi-biaxial tension; (c) strip biaxial tension in the longitudinal direction.
Figure 12.

Comparison of the estimated systolic geometry and the systolic geometry from CT image for the healthy aorta. εsys is the average of node-to-surface distances between two geometries. The geometry from CT image is displayed in triangle mesh, estimated systolic geometry is displayed in quadrilateral shell mesh.
4 Discussion
Many hyperelastic constitutive models, such as the GOH model (Gasser et al., 2006), have highly coupled material parameters, which cause the parameter estimation difficulty known as the local optima. As a result of parameter coupling (a.k.a over parameterization) (Humphrey, 2002), different sets of material parameters of a constitutive model may well fit the same data of stress-strain responses. Not surprisingly, different combinations of C10, k1, k2, κ and θ in the GOH model may provide very similar mechanical responses. For the parameter identification methods that search directly on the material parameter space, this coupling among the material parameters will result in numerous local optima. On the contrary, in our proposed MRDS approach, the PCA space derived from the stress-stretch curves, instead of the material parameter space, was used for the search of optimal material properties. Multiple level representations of the PCA space were obtained with different resolutions and with evenly spaced stress-stretch curves. A large set of stress-stretch curves were generated and represented in the PCA space. Candidate material parameters were sampled in the PCA space with multiple bin sizes to achieve multi-resolutions, which was done prior to the MRDS process. The partition of the PCA space may also be achieved by using other clustering methods, such as K-means clustering, but it may not guarantee a uniform partition (Kerdprasop et al., 2005). In this application, the partition method (Section 2.4.1) can produce a nearly-uniformly distributed centers, covering the entire PCA space.
Since many clinical applications are time-sensitive, we need to make compromises between speed and accuracy, and the MRDS approach can achieve this goal by controlling the number of levels and links. The MRDS approach can be less computationally expensive than the previous stochastic-deterministic approaches: the MRDS took approximately 1~2 days and less than 1000 FE iterations, using a quad-core CPU with 32GB memory, whereas the previous approaches took about 1~2 weeks and 7400 iterations (Wittek et al., 2013) or 2 weeks and 43500-86900 iterations (Wittek et al., 2016), using similar computing power to ours. The previous approaches (Wittek et al., 2016; Wittek et al., 2013) were designed to improve estimation accuracy: a better accuracy of estimated material parameters can be achieved because iterative gradient-based optimizations can fine-tune the parameter values once seed points are chosen. Since these inverse methods are designed for different applications, one should choose a method more suitable for a particular application.
The PCA effectively encodes each set of material parameters as a point in the PCA space, which enables the MRDS approach. Given a new arbitrary set of material parameters, the proposed method can always map it to a point in the PCA space. However, given a new arbitrary point in PCA space, it is difficult to map it back to a set of material parameters. Therefore, a direct search strategy is used in the discretized PCA space instead of gradient-based optimization algorithms which requires the inverse mapping from PCA space to material parameter space. It should be noted that it is possible to use machine learning methods (LeCun et al., 2015) to establish the inverse mapping, enabling gradient-based optimization algorithms in PCA space, which may further improve speed and accuracy and will be our future work.
Despite the discrepancy in constitutive parameters, the biaxial stress-stretch curves have been successfully recovered in the numerical validation. Using the proposed approach, the in vivo material parameters of an aged human healthy aorta were estimated, the difference between the FE deformed geometry and the image-derived geometry was about 0.5 mm, approximately the size of a voxel (0.49×0.49×1.25 mm). More accurate solution may be obtained if higher resolution images are available.
Generally, the mesh correspondence, or full field displacement measurement, is a requirement for both in vivo and in vitro constitutive parameter estimation. In in vitro experiments, this is usually achieved by tracking the markers (Avril et al., 2010). It can also be fulfilled by using 4D ultrasound image data processed with speckle tracking algorithms (Compas et al., 2014). However, ultrasound imaging has a limited field-of-view (van Disseldorp et al., 2016) and the transthoracic ultrasound signal may be reflected by the rib cage and the sternum (2011). The visualization of the aortic arch may be hampered by the air-filled trachea in the transesophageal echocardiography (TEE) (Jansen Klomp et al., 2016). CT and MRI has been used for imaging thoracic aorta. However, the requirement of mesh correspondence may not be satisfied by using clinical CT or MRI data because there are no image patterns for tracking individual points on the wall, and the performance of surface matching based tracking methods (Pengcheng et al., 2000) still needs improvement. In the proposed approach, since the objective function is based on the node-to-surface distance, which does not need mesh correspondence, this approach may be suitable for extracting material properties from CT and MRI data.
Our group have previously developed an inverse method (Liu et al., 2017) for material parameter identification by assuming static determinacy (Miller and Lu, 2013) and mesh correspondence between two loaded configurations. Under the two assumptions, the stress field on the in vivo loaded configuration can be estimated by using infinitesimal linear FEA, and then be used to speed up the parameter identification process. However, the two assumptions of this method significantly limit its potential applications. In this MRDS approach, the two assumptions are no longer needed, which is attractive for many potential applications.
CT imaging is usually used for the diagnosis of the aortic aneurysm, especially ascending thoracic aortic aneurysm, which provides more detailed images and much larger field-of-view than ultrasound imaging. When the contrast agent is used to enhance visualization in cardiac CT imaging, the inner surface of the aorta can be accurately segmented. However, the aortic wall under the loaded state is very thin, about 2 pixels in 64-slice CT, and due to surrounding tissues and partial volume effect (i.e., blurring effect) (Barrett and Keat, 2004), it is difficult to measure wall thickness field in CT images. Therefore, a constant wall thickness is assumed at the unloaded configuration according to our previous experimental results (Martin et al., 2015). The heterogeneity of the wall thickness may have an impact on the estimation of the constitutive behavior. It has been known that the material properties vary at different locations in the thoracic aorta (Choudhury et al., 2009; Davis et al., 2016; Iliopoulos et al., 2009). Indeed, the in vivo geometrical difference between systole and diastole may result from either the unknown heterogeneous wall thickness or the unknown heterogeneous material properties, making the material parameter estimation even more challenging. Here we only consider a simplified scenario, where the homogenous wall thickness is assumed, and the constitutive behavior of the aorta segment is investigated in an averaged sense. This simplification could probably explain the relatively large deviation (0.5mm) observed in Figure 12. To measure the wall thickness field of the aortic wall, it is possible to use the combination of higher resolution CT and MRI as suggested in (Joldes et al., 2016). The wall thickness field can be incorporated in our future work to improve the accuracy.
To simplify the geometry, the supra-aortic branches were carefully trimmed by human experts. Based on our previous studies, for the particular ATAA patient that was used for numerical validation in this paper, the stress and strain results with the branches (Martin et al., 2015) and without the branches (Liu et al., 2017) did not differ significantly. For the thoracic aorta, there are limited data on the axial stretch of humans in the literature. For a mouse model study (Guo and Kassab, 2003), the axial stretch is about 1.1~1.2 for the ascending and proximal thoracic aorta, much lower than the abdominal aorta (~1.6). Furthermore, when prescribing the axial stretch, we encountered severe FE convergence problems, which is being actively investigated in our group. The rigid motion caused by the heart cyclically pulling on the aorta has been removed from FEA by using the ICP algorithm (Besl and McKay, 1992; Chen and Medioni, 1991) as described in Section 3.2.
The unloaded configuration of the aortic wall is assumed to be stress-free in this approach, and thus residual strain/stress is ignored, which is a limitation of this study. Several methods have been developed to incorporate residual stress into patient-specific modeling (Bellini et al., 2014; Genet et al., 2015; Pierce et al., 2015a). Typically, the layer-specific material properties are required in these models, which is not the setup for this study. In addition, as reported by (Labrosse et al., 2009), the residual stresses may play a minor role in constitutive parameter estimation when a single layer model is used. It is shown in (Sokolis et al., 2017) that the residual stretches can vary notably with respect to the axial location and it is also correlated with age and gender. By using certain optimization schemes as proposed in (Ares et al., 2017), it might be possible to identify the heterogeneous layer-specific residual stress field on a patient-specific basis using in vivo images, however, the material properties must have been known as in (Ares et al., 2017). In the future work, with the wall thickness measurement incorporated, we will explore the possibility of estimating residual stresses along with the heterogeneous material properties from in vivo clinical images.
5 Conclusion
We have proposed a novel MRDS approach to estimate the material properties of the aortic wall from in vivo loaded geometries at two cardiac phases with known blood pressures, which does not require mesh correspondence. To facilitate the MRDS method, the material parameter space is transformed into a PCA space, and the PCA space is discretized into multiple levels of resolutions. A network of links between adjacent levels is established. The MRDS search is achieved by following the links between adjacent levels, from coarse to fine. The approach was validated in a numerical experiment by using the in vivo data from an ATAA patient. It was also applied to estimate in vivo material properties of an aged human healthy aorta, and the minimized distance residual reached the image resolution. This novel MRDS approach may facilitate the personalized biomechanical analysis of aortic tissues, such as the rupture risk analysis of ATAA, which requires rapid feedback to clinicians.
Acknowledgments
This study is supported in part by NIH grant HL104080, and Liang is supported by an American Heart Association postdoctoral fellowship 16POST30210003.
8 Appendix
We listed the criteria for selecting the curves that are physiologically possible based on previous experimental observations (Martin et al., 2015). Therefore, if a material does not meet the following constraints, for example, the material is too soft or too stiff, the corresponding constitutive parameters should be considered unrealistic. Thus, it will be excluded from the dataset.
Constraint-1
For the strip biaxial protocol in the circumferential direction, σ1 should be greater than 400kPa when λ1 is 1.7. σ2 should be greater than 100kPa when λ1 is 1.7. λ1 should be in the range of [1.01, 1.7] when σ1 is 400kPa.
Constraint-2
For the equi-biaxial protocol, σ1 and σ2 should both be greater than 400kPa when λ1 is 1.7. λ1 should be in the range of [1.01, 1.7] when σ1 is 400kPa.
Constraint-3
For the strip biaxial protocol in the longitudinal direction, σ2 should be greater than 400kPa when λ2 is 1.7. σ1 should be greater than 100kPa when the λ1 is 1.7. λ2 should be in the range of [1.01, 1.7] when σ2 is 400kPa.
Footnotes
Publisher's Disclaimer: This is a PDF file of an unedited manuscript that has been accepted for publication. As a service to our customers we are providing this early version of the manuscript. The manuscript will undergo copyediting, typesetting, and review of the resulting proof before it is published in its final citable form. Please note that during the production process errors may be discovered which could affect the content, and all legal disclaimers that apply to the journal pertain.
7 Conflict of Interest
None.
References
- Khan MG, editor. Encyclopedia of Heart Diseases. Humana Press; Totowa, NJ: 2011. Echocardiography; pp. 431–437. [Google Scholar]
- Ares GD, Blanco PJ, Urquiza SA, Feijóo RA. Identification of residual stresses in multi-layered arterial wall tissues using a variational framework. Computer Methods in Applied Mechanics and Engineering. 2017;319:287–313. [Google Scholar]
- Avril S, Badel P, Duprey A. Anisotropic and hyperelastic identification of in vitro human arteries from full-field optical measurements. Journal of Biomechanics. 2010;43:2978–2985. doi: 10.1016/j.jbiomech.2010.07.004. [DOI] [PubMed] [Google Scholar]
- Barrett JF, Keat N. Artifacts in CT: Recognition and Avoidance. RadioGraphics. 2004;24:1679–1691. doi: 10.1148/rg.246045065. [DOI] [PubMed] [Google Scholar]
- Bellini C, Ferruzzi J, Roccabianca S, Di Martino ES, Humphrey JD. A Microstructurally Motivated Model of Arterial Wall Mechanics with Mechanobiological Implications. Annals of Biomedical Engineering. 2014;42:488–502. doi: 10.1007/s10439-013-0928-x. [DOI] [PMC free article] [PubMed] [Google Scholar]
- Besl PJ, McKay ND. A method for registration of 3-D shapes. IEEE Transactions on Pattern Analysis and Machine Intelligence. 1992;14:239–256. [Google Scholar]
- Bols J, Degroote J, Trachet B, Verhegghe B, Segers P, Vierendeels J. A computational method to assess the in vivo stresses and unloaded configuration of patient-specific blood vessels. Journal of Computational and Applied Mathematics. 2013;246:10–17. [Google Scholar]
- Chen Y, Medioni G. Object modeling by registration of multiple range images, Proceedings. 1991 IEEE International Conference on Robotics and Automation. 1991;2723:2724–2729. [Google Scholar]
- Choudhury N, Bouchot O, Rouleau L, Tremblay D, Cartier R, Butany J, Mongrain R, Leask RL. Local mechanical and structural properties of healthy and diseased human ascending aorta tissue. Cardiovascular Pathology. 2009;18:83–91. doi: 10.1016/j.carpath.2008.01.001. [DOI] [PubMed] [Google Scholar]
- Compas CB, Wong EY, Huang X, Sampath S, Lin BA, Pal P, Papademetris X, Thiele K, Dione DP, Stacy M, Staib LH, Sinusas AJ, Donnell MO, Duncan JS. Radial Basis Functions for Combining Shape and Speckle Tracking in 4D Echocardiography. IEEE Transactions on Medical Imaging. 2014;33:1275–1289. doi: 10.1109/TMI.2014.2308894. [DOI] [PMC free article] [PubMed] [Google Scholar]
- Davis FM, Luo Y, Avril S, Duprey A, Lu J. Local mechanical properties of human ascending thoracic aneurysms. Journal of the Mechanical Behavior of Biomedical Materials. 2016;61:235–249. doi: 10.1016/j.jmbbm.2016.03.025. [DOI] [PubMed] [Google Scholar]
- Franquet A, Avril S, Le Riche R, Badel P, Schneider FC, Boissier C, Favre JP. Identification of the in vivo elastic properties of common carotid arteries from MRI: A study on subjects with and without atherosclerosis. Journal of the Mechanical Behavior of Biomedical Materials. 2013;27:184–203. doi: 10.1016/j.jmbbm.2013.03.016. [DOI] [PubMed] [Google Scholar]
- Gasser TC, Ogden RW, Holzapfel GA. Hyperelastic modelling of arterial layers with distributed collagen fibre orientations. Journal of The Royal Society Interface. 2006;3:15–35. doi: 10.1098/rsif.2005.0073. [DOI] [PMC free article] [PubMed] [Google Scholar]
- Genet M, Rausch MK, Lee LC, Choy S, Zhao X, Kassab GS, Kozerke S, Guccione JM, Kuhl E. Heterogeneous growth-induced prestrain in the heart. Journal of Biomechanics. 2015;48:2080–2089. doi: 10.1016/j.jbiomech.2015.03.012. [DOI] [PMC free article] [PubMed] [Google Scholar]
- Genovese K, Lee YU, Lee AY, Humphrey JD. An Improved Panoramic Digital Image Correlation Method for Vascular Strain Analysis and Material Characterization. Journal of the mechanical behavior of biomedical materials. 2013;27:132–142. doi: 10.1016/j.jmbbm.2012.11.015. [DOI] [PMC free article] [PubMed] [Google Scholar]
- Grédiac M, Pierron F, Avril S, Toussaint E. The Virtual Fields Method for Extracting Constitutive Parameters From Full-Field Measurements: a Review. Strain. 2006;42:233–253. [Google Scholar]
- Guo X, Kassab GS. Variation of mechanical properties along the length of the aorta in C57bl/6 mice. American Journal of Physiology - Heart and Circulatory Physiology. 2003;285:H2614–H2622. doi: 10.1152/ajpheart.00567.2003. [DOI] [PubMed] [Google Scholar]
- Holzapfel GA, Gasser TC, Ogden RW. A New Constitutive Framework for Arterial Wall Mechanics and a Comparative Study of Material Models. Journal of elasticity and the physical science of solids. 2000;61:1–48. [Google Scholar]
- Humphrey JD. Cardiovascular Solid Mechanics Cells, Tissues, and Organs. Springer; 2002. [Google Scholar]
- Iliopoulos DC, Deveja RP, Kritharis EP, Perrea D, Sionis GD, Toutouzas K, Stefanadis C, Sokolis DP. Regional and directional variations in the mechanical properties of ascending thoracic aortic aneurysms. Medical Engineering & Physics. 2009;31:1–9. doi: 10.1016/j.medengphy.2008.03.002. [DOI] [PubMed] [Google Scholar]
- Jansen Klomp WW, Brandon Bravo Bruinsma GJ, van ’t Hof AW, Grandjean JG, Nierich AP. Imaging Techniques for Diagnosis of Thoracic Aortic Atherosclerosis. International Journal of Vascular Medicine. 2016;2016:4726094. doi: 10.1155/2016/4726094. [DOI] [PMC free article] [PubMed] [Google Scholar]
- Joldes GR, Miller K, Wittek A, Doyle B. A simple, effective and clinically applicable method to compute abdominal aortic aneurysm wall stress. Journal of the Mechanical Behavior of Biomedical Materials. 2016;58:139–148. doi: 10.1016/j.jmbbm.2015.07.029. [DOI] [PubMed] [Google Scholar]
- Karatolios K, Wittek A, Nwe TH, Bihari P, Shelke A, Josef D, Schmitz-Rixen T, Geks J, Maisch B, Blase C, Moosdorf R, Vogt S. Method for Aortic Wall Strain Measurement With Three-Dimensional Ultrasound Speckle Tracking and Fitted Finite Element Analysis. The Annals of Thoracic Surgery. 2013;96:1664–1671. doi: 10.1016/j.athoracsur.2013.06.037. [DOI] [PubMed] [Google Scholar]
- Kerdprasop K, Kerdprasop N, Sattayatham P. Weighted K-Means for Density-Biased Clustering. In: Tjoa AM, Trujillo J, editors. Data Warehousing and Knowledge Discovery: 7th International Conference, DaWaK 2005, Copenhagen, Denmark, August 22–26, 2005. Proceedings. Springer; Berlin Heidelberg, Berlin, Heidelberg: 2005. pp. 488–497. [Google Scholar]
- Kroon M, Holzapfel GA. Elastic properties of anisotropic vascular membranes examined by inverse analysis. Computer Methods in Applied Mechanics and Engineering. 2009;198:3622–3632. [Google Scholar]
- Labrosse MR, Beller CJ, Mesana T, Veinot JP. Mechanical behavior of human aortas: Experiments, material constants and 3-D finite element modeling including residual stress. Journal of Biomechanics. 2009;42:996–1004. doi: 10.1016/j.jbiomech.2009.02.009. [DOI] [PubMed] [Google Scholar]
- LeCun Y, Bengio Y, Hinton GE. Deep Learning. Nature. 2015;521:436–444. doi: 10.1038/nature14539. [DOI] [PubMed] [Google Scholar]
- Liang L, Liu M, Martin C, Elefteriades JA, Sun W. A machine learning approach to investigate the relationship between shape features and numerically predicted risk of ascending aortic aneurysm. Biomechanics and Modeling in Mechanobiology. 2017:1–15. doi: 10.1007/s10237-017-0903-9. [DOI] [PMC free article] [PubMed] [Google Scholar]
- Liu H, Canton G, Yuan C, Yang C, Billiar K, Teng Z, Hoffman AH, Tang D. Using In Vivo Cine and 3D Multi-Contrast MRI to Determine Human Atherosclerotic Carotid Artery Material Properties and Circumferential Shrinkage Rate and Their Impact on Stress/Strain Predictions. Journal of Biomechanical Engineering. 2012;134 doi: 10.1115/1.4005685. 011008-011008-011009. [DOI] [PMC free article] [PubMed] [Google Scholar]
- Liu H, Shi P. Maximum a Posteriori Strategy for the Simultaneous Motion and Material Property Estimation of the Heart. IEEE Transactions on Biomedical Engineering. 2009;56:378–389. doi: 10.1109/TBME.2008.2006012. [DOI] [PubMed] [Google Scholar]
- Liu M, Liang L, Sun W. A new inverse method for estimation of in vivo mechanical properties of the aortic wall. Journal of the Mechanical Behavior of Biomedical Materials. 2017;72:148–158. doi: 10.1016/j.jmbbm.2017.05.001. [DOI] [PMC free article] [PubMed] [Google Scholar]
- Martin C, Sun W, Elefteriades J. Patient-specific finite element analysis of ascending aorta aneurysms. American Journal of Physiology - Heart and Circulatory Physiology. 2015;308:H1306–H1316. doi: 10.1152/ajpheart.00908.2014. [DOI] [PMC free article] [PubMed] [Google Scholar]
- Martin C, Sun W, Pham T, Elefteriades J. Predictive biomechanical analysis of ascending aortic aneurysm rupture potential. Acta Biomaterialia. 2013;9:9392–9400. doi: 10.1016/j.actbio.2013.07.044. [DOI] [PMC free article] [PubMed] [Google Scholar]
- Masson I, Beaussier H, Boutouyrie P, Laurent S, Humphrey JD, Zidi M. Carotid artery mechanical properties and stresses quantified using in vivo data from normotensive and hypertensive humans. Biomechanics and Modeling in Mechanobiology. 2011;10:867–882. doi: 10.1007/s10237-010-0279-6. [DOI] [PubMed] [Google Scholar]
- Masson I, Boutouyrie P, Laurent S, Humphrey JD, Zidi M. Characterization of arterial wall mechanical behavior and stresses from human clinical data. Journal of Biomechanics. 2008;41:2618–2627. doi: 10.1016/j.jbiomech.2008.06.022. [DOI] [PMC free article] [PubMed] [Google Scholar]
- Miller K, Lu J. On the prospect of patient-specific biomechanics without patient-specific properties of tissues. Journal of the Mechanical Behavior of Biomedical Materials. 2013;27:154–166. doi: 10.1016/j.jmbbm.2013.01.013. [DOI] [PMC free article] [PubMed] [Google Scholar]
- Olsson T, Klarbring JSA. Modeling initial strain distribution in soft tissues with application to arteries. Biomechanics and Modeling in Mechanobiology. 2006;5:27–38. doi: 10.1007/s10237-005-0008-8. [DOI] [PubMed] [Google Scholar]
- Pengcheng S, Sinusas AJ, Constable RT, Ritman E, Duncan JS. Point-tracked quantitative analysis of left ventricular surface motion from 3-D image sequences. IEEE Transactions on Medical Imaging. 2000;19:36–50. doi: 10.1109/42.832958. [DOI] [PubMed] [Google Scholar]
- Pierce DM, Fastl TE, Rodriguez-Vila B, Verbrugghe P, Fourneau I, Maleux G, Herijgers P, Gomez EJ, Holzapfel GA. A method for incorporating three-dimensional residual stretches/stresses into patient-specific finite element simulations of arteries. Journal of the Mechanical Behavior of Biomedical Materials. 2015a;47:147–164. doi: 10.1016/j.jmbbm.2015.03.024. [DOI] [PubMed] [Google Scholar]
- Pierce DM, Maier F, Weisbecker H, Viertler C, Verbrugghe P, Famaey N, Fourneau I, Herijgers P, Holzapfel GA. Human thoracic and abdominal aortic aneurysmal tissues: Damage experiments, statistical analysis and constitutive modeling. Journal of the Mechanical Behavior of Biomedical Materials. 2015b;41:92–107. doi: 10.1016/j.jmbbm.2014.10.003. [DOI] [PubMed] [Google Scholar]
- Schulze-Bauer CAJ, Holzapfel GA. Determination of constitutive equations for human arteries from clinical data. Journal of Biomechanics. 2003;36:165–169. doi: 10.1016/s0021-9290(02)00367-6. [DOI] [PubMed] [Google Scholar]
- Smoljkić M, Vander Sloten J, Segers P, Famaey N. Non-invasive, energy-based assessment of patient-specific material properties of arterial tissue. Biomechanics and Modeling in Mechanobiology. 2015;14:1045–1056. doi: 10.1007/s10237-015-0653-5. [DOI] [PubMed] [Google Scholar]
- Sokolis DP, Savva GD, Papadodima SA, Kourkoulis SK. Regional distribution of circumferential residual strains in the human aorta according to age and gender. Journal of the Mechanical Behavior of Biomedical Materials. 2017;67:87–100. doi: 10.1016/j.jmbbm.2016.12.003. [DOI] [PubMed] [Google Scholar]
- Stålhand J. Determination of human arterial wall parameters from clinical data. Biomechanics and Modeling in Mechanobiology. 2009;8:141–148. doi: 10.1007/s10237-008-0124-3. [DOI] [PubMed] [Google Scholar]
- Taylor CA, Figueroa CA. Patient-specific Modeling of Cardiovascular Mechanics. Annual review of biomedical engineering. 2009;11:109–134. doi: 10.1146/annurev.bioeng.10.061807.160521. [DOI] [PMC free article] [PubMed] [Google Scholar]
- Trabelsi O, Duprey A, Favre JP, Avril S. Predictive Models with Patient Specific Material Properties for the Biomechanical Behavior of Ascending Thoracic Aneurysms. Annals of Biomedical Engineering. 2016;44:84–98. doi: 10.1007/s10439-015-1374-8. [DOI] [PubMed] [Google Scholar]
- van Disseldorp EMJ, Hobelman KH, Petterson NJ, van de Vosse FN, van Sambeek MRHM, Lopata RGP. Influence of limited field-of-view on wall stress analysis in abdominal aortic aneurysms. Journal of Biomechanics. 2016;49:2405–2412. doi: 10.1016/j.jbiomech.2016.01.020. [DOI] [PubMed] [Google Scholar]
- Wang Q, Book G, Contreras Ortiz SH, Primiano C, McKay R, Kodali S, Sun W. Dimensional Analysis of Aortic Root Geometry During Diastole Using 3D Models Reconstructed from Clinical 64-Slice Computed Tomography Images. Cardiovascular Engineering and Technology. 2011;2:324–333. [Google Scholar]
- Webb AR, Copsey KD. Statistical Pattern Recognition. Wiley; 2011. [Google Scholar]
- Weisbecker H, Pierce DM, Regitnig P, Holzapfel GA. Layer-specific damage experiments and modeling of human thoracic and abdominal aortas with non-atherosclerotic intimal thickening. Journal of the Mechanical Behavior of Biomedical Materials. 2012;12:93–106. doi: 10.1016/j.jmbbm.2012.03.012. [DOI] [PubMed] [Google Scholar]
- Wittek A, Derwich W, Karatolios K, Fritzen CP, Vogt S, Schmitz-Rixen T, Blase C. A finite element updating approach for identification of the anisotropic hyperelastic properties of normal and diseased aortic walls from 4D ultrasound strain imaging. Journal of the Mechanical Behavior of Biomedical Materials. 2016;58:122–138. doi: 10.1016/j.jmbbm.2015.09.022. [DOI] [PubMed] [Google Scholar]
- Wittek A, Karatolios K, Bihari P, Schmitz-Rixen T, Moosdorf R, Vogt S, Blase C. In vivo determination of elastic properties of the human aorta based on 4D ultrasound data. Journal of the Mechanical Behavior of Biomedical Materials. 2013;27:167–183. doi: 10.1016/j.jmbbm.2013.03.014. [DOI] [PubMed] [Google Scholar]
- Zeinali-Davarani S, Raguin LG, Vorp DA, Baek S. Identification of in vivo material and geometric parameters of a human aorta: toward patient-specific modeling of abdominal aortic aneurysm. Biomechanics and Modeling in Mechanobiology. 2011;10:689–699. doi: 10.1007/s10237-010-0266-y. [DOI] [PubMed] [Google Scholar]
- Zhang F, Kanik J, Mansi T, Voigt I, Sharma P, Ionasec RI, Subrahmanyan L, Lin BA, Sugeng L, Yuh D, Comaniciu D, Duncan J. Towards patient-specific modeling of mitral valve repair: 3D transesophageal echocardiography-derived parameter estimation. Medical Image Analysis. 2017;35:599–609. doi: 10.1016/j.media.2016.09.006. [DOI] [PubMed] [Google Scholar]
- Zhao X, Chen X, Lu J. Pointwise Identification of Elastic Properties in Nonlinear Hyperelastic Membranes—Part II: Experimental Validation. Journal of Applied Mechanics. 2009;76:061014–061014. [Google Scholar]