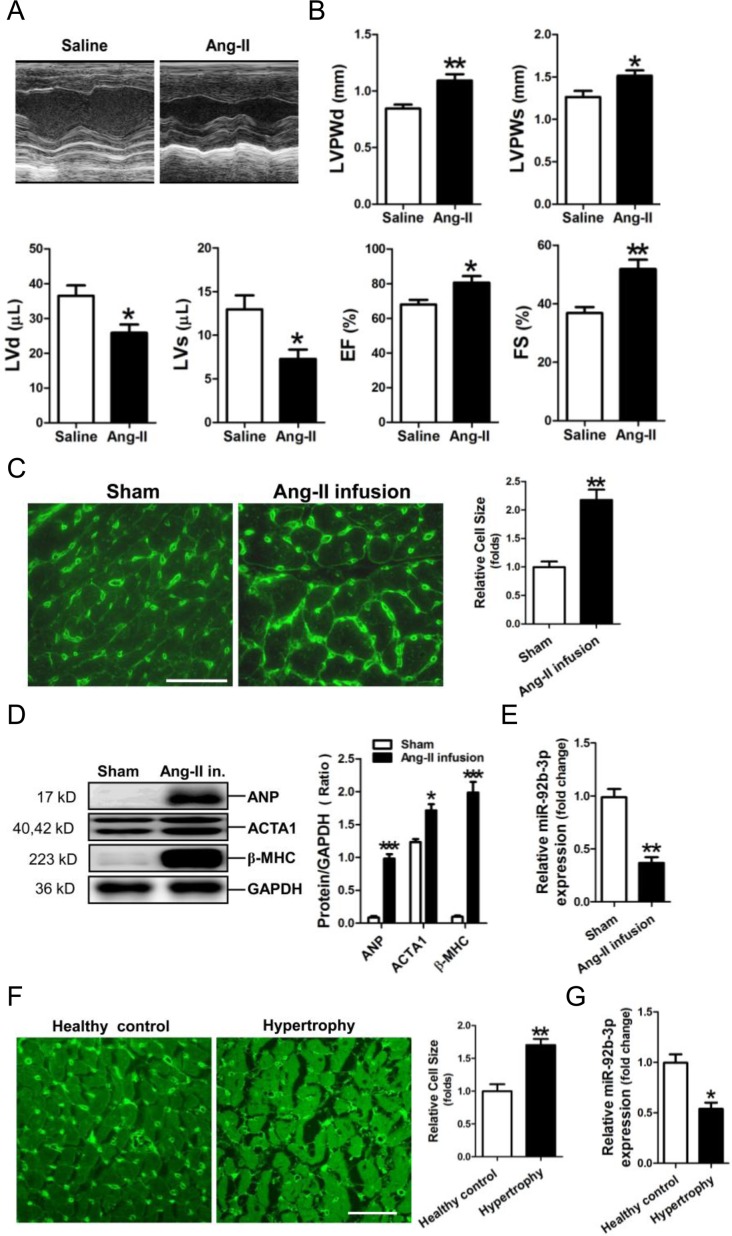
Figure 1. Down-regulation of microRNA-92b-3p (miR-92b-3p) in the hypertrophic myocardium.
(A) Representative echocardiographs of mouse hearts. (B) The representative variables of echocardiograph assay in mice, including LVPWd, LVPWs, LVd, LVs, EF and FS. Data are shown as mean ± sem, *p < 0.05, **p < 0.01, ***p < 0.001 vs saline group. N = 6–8. (C) WGA staining assay of the hypertrophic myocardium of a mouse model of Ang-II-infusion-induced hypertrophy. The scale bar is 50 μm. (D) Expressions of ANP, ACTA1 and β-MHC in mouse myocardium by Western blot assay. (E) Expression of miR-92b-3p in mouse myocardium by RT-qPCR assay. Data are shown as mean ± sem, *p < 0.05, **p < 0.01, ***p < 0.001 vs sham group. N = 5–8. (F) WGA staining assay of the hypertrophic myocardium of patients with cardiac hypertrophy. The scale bar is 50 μm. (G) Expression of miR-92b-3p in human myocardium by RT-qPCR assay. Data are shown as mean ± sem, *p < 0.05, **p < 0.01 vs healthy control. N = 8.

