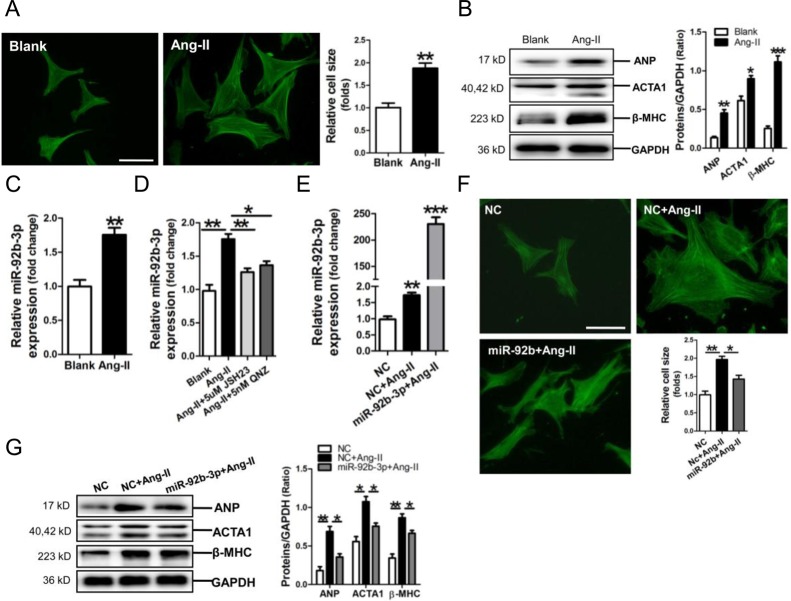
Figure 3. Up-regulation of microRNA-92b-3p (miR-92b-3p) and the suppressive effect of miR-92b-3p on expressions of ANP, ACTA1 and β-MHC in Ang-II-induced mouse cardiomyocytes.
(A) FITC-phalloidin staining of Ang-II-induced hypertrophic NMVCs. (B) Expressions of ANP, ACTA1 and β-MHC in Ang-II-treated NMVCs by Western blot assay. (C) Expression of miR-92b-3p in NMVCs by RT-qPCR assay. Data are shown as mean ± sem, *p < 0.05, **p < 0.01, ***p < 0.001 vs blank control. N = 3. (D) MiR-92b-3p expression in Ang-II-induced NMVCs with pre-treatment with the NF-κB inhibitor JSH23 or QNZ, respectively. Data are shown as mean ± sem, *p < 0.05, **p < 0.01. N = 3. (E) Determination of miR-92b-3p level in NMVCs. Data are shown as mean ± sem, **p < 0.01, ***p < 0.001 vs NC group. N = 3. (F) FITC-phalloidin staining of Ang-II-induced NMVCs with overexpression of miR-92b-3p. The scale bar is 50 μm. (G) Expressions of ANP, ACTA1 and β-MHC in Ang-II-induced NMVCs with overexpression of miR-92b-3p by Western blot assay. Data are shown as mean ± sem, *p < 0.05, **p < 0.01. N = 3.

