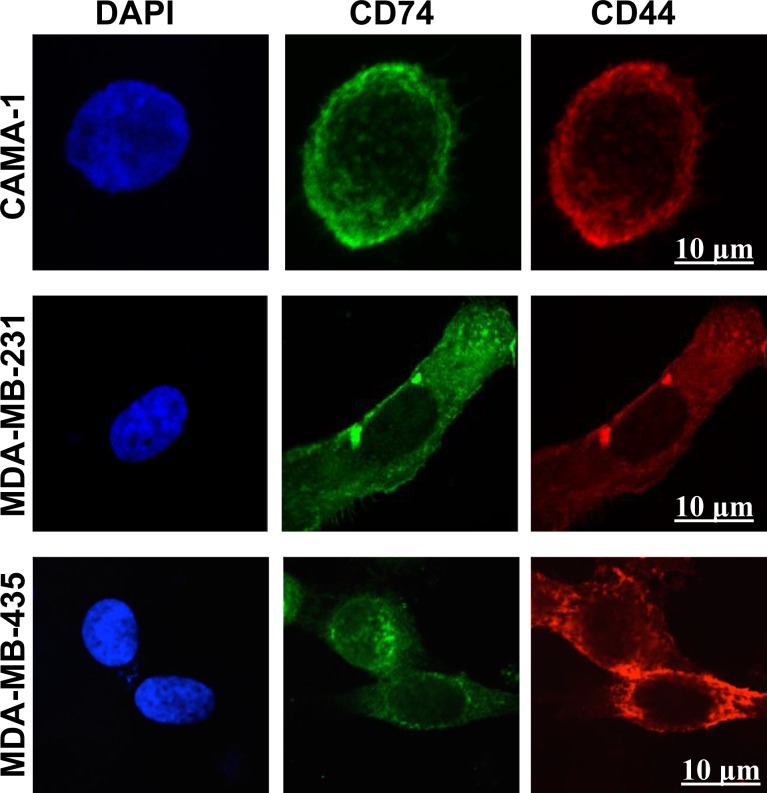
Figure 2. Confocal laser scanning microscopy images of intracellular staining of CD74 and CD44 in CAMA-1, MDA-MB-231 and MDA-MB-435 cells.
The cells were cultured in LabTek 8-well chambers at a density of 6 × 10³ cells per well overnight. CD74 was labelled with Alexa Fluor 488 (green) and CD44 with Alexa Fluor 555 (red). 4′, 6-diamidino-2-phenylindole was used for nuclear staining (blue). Fluorochromes were acquired separately to evaluate the expression of CD74 and CD44 using the image-analysis software platform Fiji. Photomicrographs are representative of three independent experiments. Scale bar 10 μm.

