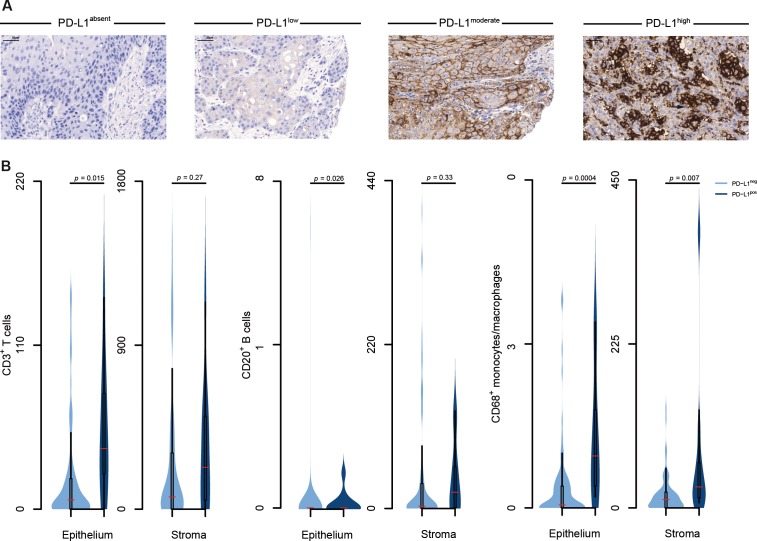
Figure 1. Identification of an immune microenvironment in VSCC.
(A) Representative images depict various expression levels of membranous PD-L1 expression in VSCC (brown cell membrane, arrow) visualized by immunohistochemistry; hematoxylin (blue) was used for nuclear staining (bright field image, 300× magnification). (B) Expression of PD-L1 was determined by immunohistochemistry in 103 patients with VSCC; immune cell populations were enumerated in the tumor (epithelial) and the peri-tumoral micromilieu (stroma) using immunohistochemistry; samples were divided into absent and present PD-L1 expression groups; frequencies of immune cells were calculated and plotted as number of cells per stromal and epithelial fraction, respectively, of the TMA; violin plots show the distribution of data points; the median, 25th and 75th percentiles and whiskers are depicted.

