

Abstract
Background
Influenza vaccination is recommended annually for all persons 6 months and older. Reports of increased influenza-related morbidity and mortality during the 2013–2014 influenza season raised concerns about low adult influenza immunization rates in Puerto Rico. In order to inform public health actions to increase vaccination rates, we surveyed adults in Puerto Rico regarding influenza vaccination-related attitudes and barriers.
Methods
A random-digit-dialing telephone survey (50% landline: 50% cellphone) regarding influenza vaccination, attitudes, practices and barriers was conducted November 19–25, 2013 among adults in Puerto Rico. Survey results were weighted to reflect sampling design and adjustments for non-response.
Results
Among 439 surveyed, 229 completed the survey with a 52% response rate. Respondents’ median age was 55 years; 18% reported receiving 2013–2014 influenza vaccination. Among 180 unvaccinated respondents, 38% reported barriers associated with limited access to vaccination, 24% reported they did not want or need influenza vaccination, and 20% reported safety concerns. Vaccinated respondents were more likely to know if they were recommended for influenza vaccination, to report greater perceived risk of influenza illness, and to report being less concerned about influenza vaccine safety (p-value < 0.05). Of the 175 respondents who saw a healthcare provider (HCP) since July 1, 2013, 38% reported their HCP recommended influenza vaccination and 17% were offered vaccination. Vaccination rates were higher among adults who received a recommendation and/or offer of influenza vaccination (43% vs. 14%; p-value < 0.01).
Conclusions
Failure of HCP to recommend and/or offer influenza vaccination and patient attitudes (low perceived risk of influenza virus infection) may have contributed to low vaccination rates during the 2013–2014 season. HCP and public health practitioners should strongly recommend influenza vaccination and provide vaccinations during clinical encounters or refer patients for vaccination.
Keywords: Influenza vaccination, Attitudes, Barriers
1. Introduction
The 2013–2014 influenza season was a moderately severe season compared to the four previous seasons in the United States; young and middle-aged adults were the most affected age groups [1]. Puerto Rico also experienced a relatively severe 2013–2014 season with the number of influenza-associated deaths and influenza morbidity surpassing previous years [2]. The predominant circulating virus in Puerto Rico during the 2013–2014 influenza season, pandemic H1N1 (pH1N1), was included as a component of the 2013–2014 influenza season vaccine [1,2,4].
Concern regarding reports of severe cases and deaths from influenza in Puerto Rico increased awareness of lower vaccination rates among adults in Puerto Rico compared to the 50 US States [3]. In response to increased influenza activity and low vaccination rates, the Puerto Rico Department of Health augmented the number and diversified locations of mass influenza vaccination clinics they supported across the island. Known predictors of vaccination have been described in the literature, including receiving a doctor’s recommendation for vaccination, and positive beliefs about vaccine safety and effectiveness [4–6]; however, little is known about attitudes and practices regarding influenza vaccination in Puerto Rico. We conducted a telephone survey to assess knowledge, attitudes and practices of Puerto Rico’s adult population regarding influenza vaccination and identify vaccination barriers among non-vaccinated adults.
2. Methods
2.1. Data collection
A random-digit-dialing telephone survey (50% landline:50% cellphone) was conducted November 19–25, 2013 among Puerto Rico residents aged 18 years or older using 2348 random telephone numbers provided by the Behavioral Risk Factor Surveillance System (BRFSS) office in Puerto Rico. A survey sample size of 217 respondents was calculated assuming a normal distribution with a 5% margin of error, 95% confidence level, a population size of 3 million adults [7], and a vaccination coverage estimate of 17% calculated from the 2012 BRFSS data (CDC unpublished data). The first person to answer the phone was interviewed if s/he was ≥18 years. Exclusion criteria included phone numbers that were out of service, unanswered/blocked calls, business phone numbers, and those for which an adult (>18 years) respondent was not available. The response rate was calculated by dividing the number of completed surveys by the number of total eligible households contacted. Informed consent of eligible participants was obtained. The questionnaire was approved by the Office of Management and Budget (OMB), US Government, under OMB no. 0920-0008. This activity was considered public health practice and not considered to be human subjects’ research in accordance with federal human subjects’ protection regulations. Questions about receipt of vaccination since July 1, 2013, reasons for not receiving vaccination during the 2013–2014 influenza season, knowledge regarding influenza vaccination recommendations, perceived risk of influenza illness, attitudes regarding influenza vaccine safety and effectiveness, and whether respondents who visited a health care provider (HCP) since July 1, 2013 had received a recommendation or offer for influenza vaccination were adapted from CDC’s March 2012 National Flu Survey (http://www.cdc.gov/nchs/nis/national_flu_survey.htm). Demographic characteristics included sex, age, health insurance status, and health status (having a HCP diagnosis of asthma, diabetes and/or cardiovascular disease). Ethnicity was not included since approximately 99% of the population in Puerto Rico is Hispanic or Latino [7]. All interviews were conducted in Spanish.
2.2. Data analysis
Age was categorized into three groups: 18–49, 50–64, and ≥65 years. Patients were classified as high-risk (i.e. being at increased risk of influenza-related complications) if they reported having a HCP diagnosis of asthma, diabetes and/or cardiovascular disease, three conditions that are routinely asked about for the BRFSS survey [8]. We stratified the analysis by influenza vaccination status during the 2013–2014 influenza season (from July 1, 2013 through the day of the interview) and present frequencies and weighted proportions for the following variables: demographic characteristics, high risk status, and knowledge and attitudes regarding influenza vaccination. Among unvaccinated persons, we categorized main reasons reported for not being vaccinated into 3 main groups: access issues, not wanting or needing the vaccine, and safety concerns. The access issue categories included: no time, vaccine unavailable, didn’t know where to go to get vaccine, sick when shot was available, and other reasons. We also assessed the categorized main reported reason for not being vaccinated for influenza during the 2013–2014 influenza season by demographic characteristics and high risk status. Receipt of influenza vaccination recommendation and offer were stratified by demographic characteristics and high risk status among those who reported visiting a HCP for any reason since July 1, 2013. We calculated vaccination rates by HCP recommendation and offer of influenza vaccination among those who reported visiting a HCP since July 1, 2013. Finally, we analyzed the relationship of receipt of influenza vaccination with predictors for vaccination (age, gender, high risk conditions, and receipt a vaccination recommendation or offer by HCP) by bivariate and multivariate analyses (multiple logistic regression). We present unadjusted and adjusted odds ratios (ORs and AORs) with 95% confidence intervals. For all descriptive analyses, we present frequencies and weighted percentages. Percentages were weighted by age and sex data from the 2010 US Census Data for Puerto Rico [7] to reflect sampling design and adjustments for non-response. We used Pearson’s chi-squared test and the Fisher’s exact test when appropriate to compare distributions. Data were analyzed using R software (version 3.0.2).
3. Results
3.1. Data
Out of the 2348 telephone numbers that were provided, 1909 were excluded [1302 out of service, 489 no answers, 37 blocked calls, and 81 business numbers]. Of the remaining 439 numbers called, 187 (43%) declined to participate, and 23 (5%) did not complete the survey. A total of 229 of 439 eligible (52%) completed the survey.
Respondents’ median age was 55 years. About half (45%) of the respondents reported having at least one high-risk condition, and 94% reported having health insurance. Overall, the adjusted vaccination rate was 18% (n = 49); 19% and 16% among female and male respondents, respectively. Among respondents who reported having health insurance, the adjusted vaccination rate was 19%. Adults aged 18–49 years reported a lower vaccination rate (11%) compared to adults 50–64 and ≥65 years (28% and 27%, respectively; p-values: 0.02 and 0.03, respectively). Those who reported a high-risk condition reported a higher vaccination rate (24%) than those who did not (13%; p-value = 0.05, Table 1, weighted percentages).
Table 1.
Demographic characteristics by influenza vaccination status (n = 229), Telephone survey among adults in Puerto Rico, November 19–25, 2013.
| All n (weighted %)╪ | Influenza vaccination status (n = 229)
|
|||
|---|---|---|---|---|
| Vaccinated 2013–14 influenza season* n(weighted %)╪ | Unvaccinated 2013–14 influenza season* n (weighted %)╪ | p-Value† | ||
| All | 229 (100) | 49 (17.9) | 180 (82.1) | <0.001 |
| Sex | ||||
| Female | 142 (52.0) | 32 (18.5) | 110 (81.5) | 0.803 |
| Male | 87 (48.0) | 17 (16.4) | 70 (83.6) | |
| Age group | ||||
| 18–49 years | 84 (57.2) | 9 (10.7)§ | 75 (89.3) | 0.011 |
| 50–64 years | 79 (23.6) | 22 (27.8) | 57 (72.2) | |
| ≥65 years | 66 (19.2) | 18 (27.3) | 48 (72.7) | |
| High risk condition** | ||||
| Yes | 118 (45.4) | 31 (23.8) | 87 (76.2) | 0.045 |
| No | 111 (54.6) | 18 (12.9) | 93 (87.1) | |
| Health insurance | ||||
| Yes | 219 (93.9) | 48 (18.6) | 171 (81.4) | 0.694†† |
| No | 10 (6.1) | 1 (7.1) | 9 (92.9) | |
Since July 1, 2013.
Asthma, diabetes, and cardiovascular disease. Note: Numbers and percentages reflect available information.
Percentages have been weighted by age and sex from the 2010 US Census Data for Puerto Rico. Percentages may not sum to 100% due to rounding.
X2 test.
Fisher’s exact test.
Vaccination rate in age group 18–49 was significantly different to vaccination rates in age groups 50–64 and ≥65 years (p-values: 0.02 and 0.03, respectively; pairwise comparison of proportions).This table refers to the following questions from the survey: (1) “Since July 1st, 2013 have you had a flu vaccination? It could have been a shot or a spray, drop, or mist in the nose”; (2) “Now I have some general questions. I am required to ask this. Just to confirm, are you a male or female?”; (3) “Please tell me how old are you”; (4) Has a doctor, nurse or other health professional EVER said that you have: Diabetes, Asthma or Cardiovascular disease”; (5) “Do you have any kind of health coverage, including health insurance, prepaid plans such as HMOs, or government plans such as Medicare?”.
3.2. Influenza and influenza vaccine knowledge and attitudes
Among unvaccinated respondents, 47% reported being unaware that influenza vaccination was recommended for them, compared to 73% of vaccinated respondents. Likewise, vaccinated respondents were more likely to perceive a very high or somewhat high risk of influenza illness (76%) than unvaccinated respondents (34%; p-value < 0.01). Vaccinated respondents perceived the influenza vaccine as very/somewhat safe (93% and 67%, respectively) and as very/somewhat effective in a higher proportion (81% and 61%, respectively) than unvaccinated respondents (p-value < 0.05; Fig. 1, weighted percentages).
Fig. 1.
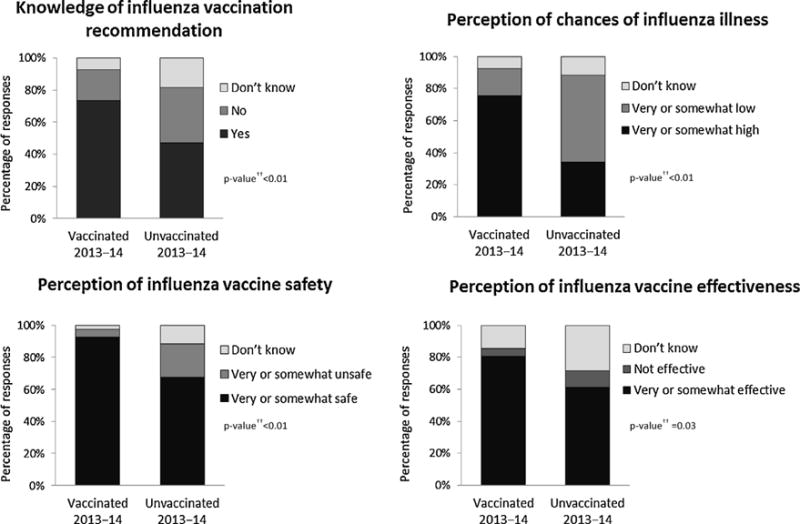
Knowledge and attitudes regarding influenza vaccination by vaccination status (n = 229), Telephone survey among adults in Puerto Rico, November 19–25, 2013. Note: Numbers and percentages reflect available information. †Percentages have been weighted by age and sex from the 2010 US Census Data for Puerto Rico. †† X2 test; ╪Fisher’s exact test. This table refers to the following questions from the survey: (1) “To the best of your knowledge, are you in a group that is recommended to get a flu vaccination this year?”; (2) “In general, if you do not get a flu vaccination during a flu season, what do you think your chances are of getting the flu?”; (3) “How safe do you think the flu vaccine is?”; (4) “How effective do you think the flu vaccination is in preventing the flu?”.
3.3. Reasons for not receiving influenza vaccination
Among the three categories (i.e. access issues, not wanting or needing the vaccine, and safety concerns), the most frequent reason cited for not being vaccinated against influenza during the 2013–2014 season were those associated with access barriers to influenza vaccination (38%). Specific access barriers were: no time to get vaccinated (n = 34), vaccine unavailable (n = 13), didn’t know where to go (n = 8), sick when vaccine was available (n = 2), and other reasons (n = 2). Other common reasons for non-vaccination were: not wanting or needing the vaccine (24%), vaccine safety concerns (20%), and other reasons (16%). The most common reasons for non-vaccination among adults 18–49 years were also related to access barriers (46%; p-value < 0.05), whereas for adults 50–64 and ≥65 years vaccine safety concerns were the most common reasons for non-vaccination (40% and 31%, respectively; p-value > 0.05; Table 2, weighted percentages).
Table 2.
Main reason for not receiving influenza vaccination since July 1, 2013 (n = 180), Telephone survey among adults in Puerto Rico, November 19–25, 2013.
| All n (weighted %)£ | Main reason
|
|||||
|---|---|---|---|---|---|---|
| Vaccine safety concerns n (weighted %)£ | Do not need/want n (weighted %)£ | Access barriers to vaccination n(weighted %)£ | Other** n (weighted %)£ | p-Value† | ||
| All | 180 (100) | 46 (20.3) | 44 (23.7) | 59 (37.9) | 24 (15.8) | <0.001 |
| Sex | ||||||
| Female | 110 (51.3) | 30 (21.7) | 31 (27.2) | 33 (33.7) | 11 (14.1) | 0.518 |
| Male | 70 (48.7) | 16 (18.0) | 13 (20.2) | 26 (41.6) | 13 (18.0) | |
| Age group | ||||||
| 18–49 years | 75 (62.2) | 8 (10.6) | 18 (23.9) | 34 (46.0)§ | 15 (19.5) | 0.003 |
| 50–64 years | 57 (20.7) | 22 (39.5) | 13 (21.1) | 15 (26.3) | 4 (7.9) | |
| ≥65 years | 48 (17.0) | 16 (31.3) | 13 (25.0) | 10 (21.9) | 5 (12.5) | |
| High risk condition╪ | ||||||
| Yes | 87 (42.6) | 27 (27.6) | 18 (18.4) | 27 (34.2) | 9 (14.5) | 0.155 |
| No | 93 (57.4) | 19 (15.4) | 26 (26.9) | 32 (40.4) | 15 (16.3) | |
| Health insurance | ||||||
| Yes | 171 (93.1) | 46 (21.6) | 42 (23.4) | 54 (36.5) | 22 (16.2) | 0.383†† |
| No | 9 (6.9) | 0 (0) | 2 (25.0) | 5 (58.3) | 2 (16.7) | |
Asthma, diabetes, and cardiovascular disease.
X2 test.
Fisher’s exact test.
Among age group 18–49, the proportion of people who answered that access barriers to vaccination was the main reason for not receiving influenza vaccination was significantly higher to those who answered vaccine safety concerns, do not need/want and other reasons (p-values: <0.001, 0.04 and 0.01, respectively; pairwise comparison of proportions). For age groups 50–64 and ≥65 years, we did not find any significant differences by pairwise comparisons of proportions (p-values > 0.05). This table refers to the following questions from the survey: (1)“of the reasons you listed, what is the main reason you will not get a flu vaccination this flu season?”; (2) “Now I have some general questions. I am required to ask this. Just to confirm, are you a male or female?”; (3) “Please tell me how old are you”; (4) Has a doctor, nurse or other health professional EVER said that you have: Diabetes, Asthma or Cardiovascular disease”; (5) “Do you have any kind of health coverage, including health insurance, prepaid plans such as HMOs, or government plans such as Medicare?”. *Access barriers: “No time”, “Vaccine unavailability”, “Didn’t know where to go”, “Sick when shot was available”, and other reasons related to access.
Most common other reasons: “Do not trust the Government”, “Don’t know”, “Lack of info”, “Doctor recommended not to receive the vaccine.” Note: Numbers and percentages reflect available information (refused to answer the question, n = 7).
Percentages have been weighted by age and sex from the 2010 US Census Data for Puerto Rico. Percentages may not sum to 100% due to rounding.
3.4. Provider recommendation and offer of influenza vaccination
Overall, among those who reported visiting a doctor or other HCP since July 1, 2013 (n = 175), 69 (38%) reported that their HCP had recommended that they be vaccinated against influenza infection and 32 (17%) reported that they were offered influenza vaccination. Approximately 30% of those aged 65 and older were offered vaccination compared to 14% and 13% of adults aged 18–49 and 50–64, respectively (p-value = 0.05). Less than half (43%) of those with a high-risk condition reported that their HCP recommended influenza vaccination to them; 15% were offered influenza vaccination at their HCP visit (Table 3, weighted percentages).
Table 3.
Characteristics of those who received medical care since July 1, 2013 (n = 175), by receipt of health care provider recommendation and offer for influenza vaccination, Telephone survey among adults in Puerto Rico, November 19–25, 2013.
| All n (weighted%)╪ | Provider recommendation
|
p-Value† | Provider offer
|
p-Value† | |||
|---|---|---|---|---|---|---|---|
| Received recommendation for influenza vaccination n (weighted %)╪ | Didn’t receive recommendation for influenza vaccination n (weighted %)╪ | Were offered influenza vaccination n (weighted %)╪ | Were not offered influenza vaccination n (weighted %)╪ | ||||
| All | 175 (100) | 69 (37.6) | 104 (62.4) | 0.001 | 32 (17.1) | 143 (82.9) | <0.01 |
| Sex | |||||||
| Female | 108 (52.4) | 43 (37.8) | 63 (62.2) | 1.00 | 20 (18.7) | 88 (81.3) | 0.684 |
| Male | 67 (47.6) | 26 (37.3) | 41 (62.7) | 12 (15.5) | 50 (84.5) | ||
| Age group | |||||||
| 18–49 years | 52 (49.1) | 16 (31.4) | 36 (68.6) | 0.237 | 8 (14.0) | 44 (86.0) | 0.054 |
| 50–64 years | 65 (27.3) | 26 (40.4) | 38 (59.6) | 8 (12.8) | 57 (87.2) | ||
| ≥65 years | 58 (23.6) | 27 (46.3) | 30 (53.7) | 16 (26.8) | 42 (73.2) | ||
| High risk condition* | |||||||
| Yes | 103 (51.8) | 47 (43.3) | 55 (56.7) | 0.110 | 18 (15.4) | 85 (84.6) | 0.637 |
| No | 72 (48.2) | 22 (30.1) | 49 (69.9) | 14 (19.0) | 58 (81.0) | ||
| Health insurance | |||||||
| Yes | 171 (97.0) | 67 (37.1) | 102 (62.9) | 0.628†† | 32 (17.8) | 139 (82.2) | 1.00 |
| No | 4 (3.7) | 2 (50.0) | 2 (50.0) | 0 (0) | 4 (100.0) | ||
Asthma, diabetes, and cardiovascular disease. Note: Numbers and percentages reflect available information.
Percentages have been weighted by age and sex from the 2010 US Census Data for Puerto Rico. Percentages may not sum to 100% due to rounding.
X2 test.
Fisher’s exact test. This table refers to the following questions from the survey: (1) “Since July 1st, 2013 have you visited a doctor or other health care professional about your own health at a doctor’s office, hospital, clinic or some other place?”; (2) “At one or more of these visits, did your doctor or other health professional recommend that you should get a flu vaccination, should not get a flu vaccination, or did not give a recommendation either way?”; (3) “During your visits to the doctor or other health professional, did your doctor or other health professional offer the flu vaccination to you?”; (4) “Now I have some general questions. I am required to ask this. Just to confirm, are you a male or female?”; (5) “Please tell me how old are you”; (6) Has a doctor, nurse or other health professional EVER said that you have: Diabetes, Asthma or Cardiovascular disease”; (7) “Do you have any kind of health coverage, including health insurance, prepaid plans such as HMOs, or government plans such as Medicare?”.
Among those who reported that their HCP recommended and offered influenza vaccination, 43% reported being vaccinated for influenza since July 1, 2013. Among those who reported that their HCP recommended but did not offer influenza vaccination, 21% reported being vaccinated for influenza. Finally, 14% of respondents who reported receiving neither a recommendation nor an offer of influenza vaccination reported being vaccinated (p-value < 0.01, Fig. 2, weighted percentages).
Fig. 2.
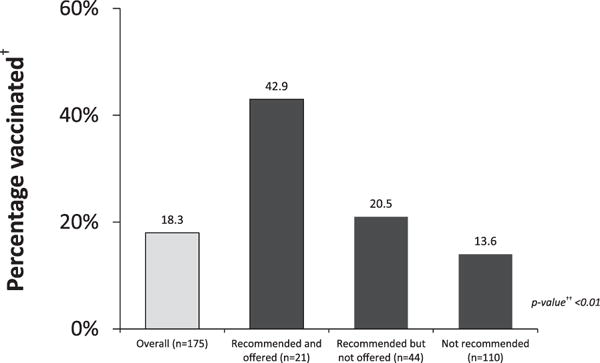
Influenza vaccination by health care provider recommendation or offer of influenza vaccination among those receiving care since July 1, 2013 (n = 175), Telephone survey among adults in Puerto Rico, November 19–25, 2013.
Note: Numbers and percentages reflect available information. †Percentages have been weighted by age and sex from the 2010 US Census Data for Puerto Rico. ††X2 test. This table refers to the following questions from the survey: (1) “Since July 1st, 2013 have you had a flu vaccination? It could have been a shot or a spray, drop, or mist in the nose”; (2) “Since July 1st, 2013 have you visited a doctor or other health care professional about your own health at a doctor’s office, hospital, clinic or some other place?”; (3) “At one or more of these visits, did your doctor or other health professional recommend that you should get a flu vaccination, should not get a flu vaccination, or did not give a recommendation either way?”; (4) “During your visits to the doctor or other health professional, did your doctor or other health professional offer the flu vaccination to you?” (Those who answered that received a recommendation to no get a flu vaccination were considered in the group that was not recommended influenza vaccination).
We did not see any association between the receipt of influenza vaccination and sex, high risk condition and provider offer of vaccination. However, age and provider recommendation of vaccination were associated with receipt of influenza vaccination and these bivariate associations persisted (p-values <0.05) in a multivariate model that adjusted for the other predictors: age, sex, high risk condition and provider recommendation and offer. Specifically, the odds of influenza vaccination were 2.5 times greater for those who received a provider recommendation than for those who did not, when controlling for other predictors (AOR: 2.52; 95% CI: 1.11, 5.83). On the other hand, the odds of being vaccinated were significantly lower for adults aged 18–49 years as compared to older adults when controlling for other predictors (AOR: 0.23; 95% CI: 0.06, 0.59; see Table 4).
Table 4.
Relationship between predictors and vaccination among those who received medical care since July 1, 2013 (n = 175), bivariate and multivariate analysis, Telephone survey among adults in Puerto Rico, November 19–25, 2013.
| Influenza vaccination 2013–2014
|
||||
|---|---|---|---|---|
| Unadjusted OR | 95% CI | Adjusted OR†† | 95% CI | |
| Age (ref = age group ≥65 years) | ||||
| 18–49 years | 0.19 | (0.06,0.61)† | 0.23 | (0.06,0.59)† |
| 50–64 years | 0.97 | (0.44,2.12) | 1.08 | (0.47,2.54) |
| Sex (ref = Male) | ||||
| Female | 1.21 | (0.58,2.52) | 1.14 | (0.52,2.53) |
| High risk condition* (ref = No) | ||||
| Yes | 1.89 | (0.88,4.03) | 1.16 | (0.50,2.77) |
| Provider recommendation (ref = No) | ||||
| Yes | 3.00 | (1.45,6.22)† | 2.52 | (1.11,5.83)† |
| Provider offer (ref = No) | ||||
| Yes | 2.04 | (0.87,4.63) | 1.27 | (0.46,3.36) |
Asthma, diabetes, and cardiovascular disease.
p-Value < 0.05.
Adjusted for age, sex, high risk condition, provider recommendation and offer.
4. Discussion
Our survey found low vaccination rates among adults of all ages in Puerto Rico and identified a number of barriers that might contribute to low vaccination. Consistent with other studies [6,9–11], those who were vaccinated were more aware of influenza vaccination recommendations, perceived themselves to be at risk of becoming infected with influenza, and generally perceived influenza vaccination as safe and effective compared to unvaccinated adults. Importantly, our study also suggests that among unvaccinated adults, issues related to access to influenza vaccination, such as time needed to get vaccinated and vaccine availability, appeared to be major barriers to getting vaccinated. Furthermore, of those who saw a HCP during the 2013–2014 influenza season, less than half received a recommendation for influenza vaccination and less than a quarter were offered vaccination.
The adult influenza vaccination rate observed in this survey was very similar to that obtained by BRFSS in Puerto Rico for 2012 (17%; CDC unpublished data) and coverage was less than half of the adult vaccination coverage estimated early in the 2013–2014 influenza season for the 50 US States (39%) [12]. However, influenza vaccination coverage among adults in Puerto Rico shows similar trends to the 50 US States with higher coverage among older adults and among adults with high risk conditions [12]. However, for those adults with a high risk condition, the vaccination rate among adults aged 18–64 years in Puerto Rico was half of that observed in the 50 US States [12].
In the continental U.S., having a HCP recommend influenza vaccination is strongly associated with higher influenza vaccination coverage; and influenza vaccination coverage is even higher among adults who report both a recommendation and an offer of vaccination [6,10,13,14]. Our results suggest similar trends among Puerto Ricans. However, only a small proportion of adults in our sample (12%) reported a receipt and offer of influenza vaccination. The Adult Immunization Practice Standards call on all healthcare professionals to take steps to help ensure that their adult patients are fully immunized, including routinely assessing patients for vaccine needs, strongly recommending needed vaccines, and providing needed immunizations or, if the provider does not stock needed vaccines, referring patients to a vaccination provider. Working to improve providers’ practices regarding vaccination needs assessment, recommendation and offer will be key to increasing vaccination rates in Puerto Rico [15]. Addressing providers’ barriers for implementing vaccination services are also critical in order to improve vaccination rates in Puerto Rico [14].
Adults who reported perceiving the influenza vaccine as safe and effective were more likely to report vaccination. Likewise, a higher percentage of those who reported knowing that influenza vaccination was recommended for them or who reported that their risk of influenza illness was high or somewhat high were more likely to be vaccinated [6,9–11]. The second most commonly reported reason for not receiving vaccination during the 2013–2014 season was vaccine safety concern. Efforts to educate adults in Puerto Rico regarding the safety and effectiveness of influenza vaccination and the impact of influenza illness may be helpful towards improving vaccination coverage.
Many unvaccinated respondents reported that they were not vaccinated because they had difficulty accessing the vaccine. Many reported that the influenza vaccine was unavailable, but others also reported they had no time to get vaccinated. This barrier was especially important for younger adults, the age group with the lowest vaccination rates. In the 50 US States, pharmacies and workplaces have become much more common places for adult vaccinations and have increased the overall access to influenza vaccination [16–19]. For instance, a study found that employees were 5.7 times more likely to receive influenza vaccination if offered at work [20]. However, data from BRFSS shows that adults in Puerto Rico receive influenza vaccination primarily in the health care setting (49%) and only 17% at a store or workplace (CDC unpublished data). Therefore, providing vaccination at convenient times and locations, such as in pharmacies and at workplaces, may improve also vaccination coverage in Puerto Rico.
We acknowledge study limitations. First, the telephone survey took place during a severe influenza season when a large media campaign focusing on influenza and influenza vaccination took place; this could have resulted in higher awareness regarding influenza vaccination and higher vaccination rates than during prior influenza seasons. Nevertheless, the vaccination rate reported in our evaluation was similar to the vaccination rates in Puerto Rico from 2012 BRFSS data, and also similar to early estimates for the 2013–2014 season [3]. Likewise, our findings about knowledge, attitudes and practices regarding influenza vaccination are consistent with other studies [6,10]. Second, vaccination status was self-reported. Self-reported vaccination is susceptible to recall bias. However, we conducted the survey in mid-November, during the influenza season, thus, minimizing the likelihood of recall bias [21]. Finally, non-response bias and bias introduced by excluding those without telephone service or coverage may remain after weighting.
In summary, numerous challenges existed that likely contributed to low vaccination rates among adults in Puerto Rico. Increasing access to vaccination at HCPs or other convenient locations, such as workplaces and pharmacies, and improving the public’s knowledge about influenza illness and influenza vaccine safety and effectiveness could improve overall adult influenza vaccination coverage. Perhaps most importantly, efforts are needed to work with HCPs to ensure that all patients are afforded the opportunity of prevention through routine assessment of patients vaccination needs, a strong recommendation from their provider for needed vaccination, and either an offer of vaccination or, if they do not stock the vaccine, a referral to a specific vaccine provider in accordance with the standards of practice for adult immunization [22]. Policy makers and public health partners in Puerto Rico should consider these findings when planning for future influenza immunization campaigns and implementing strategies to improve adult vaccination overall.
Acknowledgments
We would like to thank the student volunteers from the University of Puerto Rico (Miguel J. Anzalota-Del Toro, Enny De Jesús, Karla E. Medina-Colón, Krizia Santos-Rodríguez), the Ponce School of Medicine and Health Sciences (Priscilla M. Báez-Merced, Nadya I. Pérez-Batista, Carol M. Rivera-Sánchez, Juan C. Vargas), and the Metropolitan University (Daniel W. Stovall-Cordero); and the Puerto Rico Department of Health BRFSS staff (Viviana C. González-Seda, Carlos G. Grana-Morales, Luis A. Roldán) who served as volunteer interviewers during this study, as well as the study participants for their time and insight.
Footnotes
Disclaimer
The findings and conclusions in this publication are those of the authors and do not necessarily represent the views of the Centers for Disease Control and Prevention. The content of this article has not been previously presented.
Conflict of interest statement
The authors do not have an association that might pose a conflict of interest.
References
- 1.Epperson S, Blanton L, Kniss K, Mustaquim D, Steffens C, Wallis T, et al. Influenza activity—United States, 2013–14 season and composition of the 2014–15 influenza vaccines. MMWR Morb Mortal Wkly Rep. 2014 Jun;63(22):483–90. [PMC free article] [PubMed] [Google Scholar]
- 2.Estado Libre Asociado de Puerto Rico—Departamento de Salud. Influenza, Estadísticas Recientes. 2014 [cited 10/15/2014] Available from: 〈 http://www.salud.gov.pr〉.
- 3.Centers for Disease Control and Prevention. 2013–14 Influenza season vaccination coverage estimates for local areas and territories. 2015 [cited 02/11/2015]; Available from: 〈 http://www.cdc.gov/flu/fluvaxview/local-areas-estimates.htm〉.
- 4.Bjorkman I, Sanner MA. The Swedish A(H1N1) vaccination campaign—why did not all Swedes take the vaccination? Health Policy. 2013;109(1):63–70. doi: 10.1016/j.healthpol.2012.09.004. [DOI] [PubMed] [Google Scholar]
- 5.Ward J, Raude J. Understanding influenza vaccination behaviors: a comprehensive sociocultural framework. Expert Rev Vaccines. 2014;13(1):17–29. doi: 10.1586/14760584.2014.863156. [DOI] [PubMed] [Google Scholar]
- 6.Santibanez TA, Mootrey GT, Euler GL, Janssen AP. Behavior and beliefs about influenza vaccine among adults aged 50–64 years. Am J Health Behav. 2010;34(1):77–89. doi: 10.5993/ajhb.34.1.10. [DOI] [PubMed] [Google Scholar]
- 7.U.S. Census Bureau. 2010 Census data. 2010 [cited 10/13/2014]; Available from: 〈 http://www.census.gov/2010census/data/〉.
- 8.Coffin SE, Zaoutis TE, Rosenquist AB, Heydon K, Herrera G, Bridges CB, et al. Incidence, complications, and risk factors for prolonged stay in children hospitalized with community-acquired influenza. Pediatrics. 2007;119(4):740–8. doi: 10.1542/peds.2006-2679. [DOI] [PubMed] [Google Scholar]
- 9.Bonfiglioli R, Vignoli M, Guglielmi D, Depolo M, Violante FS. Getting vaccinated or not getting vaccinated? Different reasons for getting vaccinated against seasonal or pandemic influenza. BMC Public Health. 2013;13:1221. doi: 10.1186/1471-2458-13-1221. [DOI] [PMC free article] [PubMed] [Google Scholar]
- 10.Santibanez TA, Singleton JA, Santibanez SS, Wortley P, Bell BP. Socio-demographic differences in opinions about 2009 pandemic influenza A (H1N1) and seasonal influenza vaccination and disease among adults during the 2009–2010 influenza season. Influenza Other Respir Viruses. 2013 May;7(3):383–92. doi: 10.1111/j.1750-2659.2012.00374.x. [DOI] [PMC free article] [PubMed] [Google Scholar]
- 11.Yaqub O, Castle-Clarke S, Sevdalis N, Chataway J. Attitudes to vaccination: a critical review. Soc Sci Med. 2014 Jul;112:1–11. doi: 10.1016/j.socscimed.2014.04.018. [DOI] [PubMed] [Google Scholar]
- 12.Centers for Disease Control and Prevention. 2013–14 Flu season. 2014 [cited 10/13/2014]; Available from: 〈 http://www.cdc.gov/flu/fluvaxview/1314season.htm〉.
- 13.Ding H, Black CL, Ball S, Donahue S, Izrael D, Williams WW, et al. Influenza vaccination coverage among pregnant women—United States, 2013–14 influenza season. MMWR Morb Mortal Wkly Rep. 2014 Sep;63(37):816–21. [PMC free article] [PubMed] [Google Scholar]
- 14.Stone EG, Morton SC, Hulscher ME, Maglione MA, Roth EA, Grimshaw JM, et al. Interventions that increase use of adult immunization and cancer screening services: a meta-analysis. Ann Intern Med. 2002 May;136(9):641–51. doi: 10.7326/0003-4819-136-9-200205070-00006. [DOI] [PubMed] [Google Scholar]
- 15.Flicoteaux R, Pulcini C, Carrieri P, Schwarzinger M, Leport C, Verger P. Correlates of general practitioners’ recommendations to patients regarding vaccination for the 2009–2010 pandemic influenza (A/H1N1) in France: implications for future vaccination campaigns. Vaccine. 2014 Apr;32(20):2281–7. doi: 10.1016/j.vaccine.2014.02.074. [DOI] [PubMed] [Google Scholar]
- 16.Anderson C, Thornley T. It’s easier in pharmacy: why some patients prefer to pay for flu jabs rather than use the National Health Service. BMC Health Serv Res. 2014;14:35. doi: 10.1186/1472-6963-14-35. [DOI] [PMC free article] [PubMed] [Google Scholar]
- 17.Centers for Disease Control and Prevention. National early season flu vaccination coverage—United States. 2012–13 Flu season. 2013 [cited 10/15/2014]; Available from: 〈 http://www.cdc.gov/flu/pdf/fluvaxview/nifs-estimates-nov2012.pdf〉.
- 18.Murphy PA, Frazee SG, Cantlin JP, Cohen E, Rosan JR, Harshburger DE. Pharmacy provision of influenza vaccinations in medically underserved communities. J Am Pharm Assoc: JAPhA. 2012;52(1):67–70. doi: 10.1331/JAPhA.2012.10070. [DOI] [PubMed] [Google Scholar]
- 19.Ofstead CL, Sherman BW, Wetzler HP, Dirlam Langlay AM, Mueller NJ, Ward JM, et al. Effectiveness of worksite interventions to increase influenza vaccination rates among employees and families. J Occup Environ Med/Am Coll Occup Environ Med. 2013;55(2):156–63. doi: 10.1097/JOM.0b013e3182717d13. [DOI] [PubMed] [Google Scholar]
- 20.Shahrabani S, Benzion U. Workplace vaccination and other factors impacting influenza vaccination decision among employees in Israel. Int J Environ Res Public Health. 2010 Mar;7(3):853–69. doi: 10.3390/ijerph7030853. [DOI] [PMC free article] [PubMed] [Google Scholar]
- 21.Burger AE, Reither EN. Monitoring receipt of seasonal influenza vaccines with BRFSS and NHIS data: challenges and solutions. Vaccine. 2014 Jun;32(31):3950–4. doi: 10.1016/j.vaccine.2014.05.032. [DOI] [PubMed] [Google Scholar]
- 22.National Vaccine Advisory Committee. Standards for adult immunization practice. 2014 doi: 10.1177/003335491412900203. [cited 01/22/2015]; Available from: 〈 http://www.cdc.gov/vaccines/hcp/patient-ed/adults/for-practice/standards/〉. [DOI] [PMC free article] [PubMed]