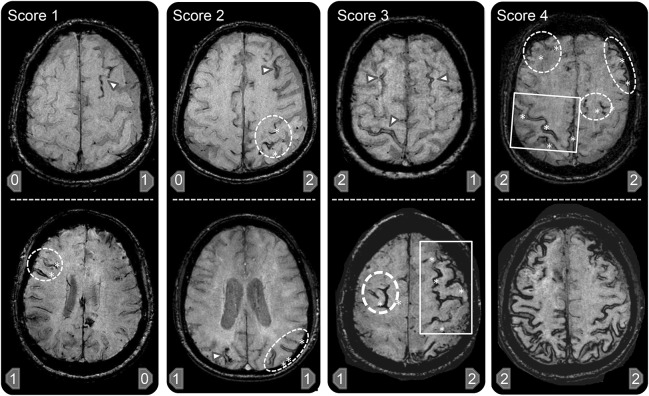
Figure 1. Representative examples of the cortical superficial siderosis (cSS) multifocality scale.
A score of 0 represents no cSS and is not exemplified here. Examples of T2* MRI scans representing different combinations that can total cSS multifocality scores of 1–4 are provided. The arrowhead represents single sulcus cSS whereas involvement of multiple sulci in one region is demonstrated by the oval (2 or 3 sulci) and rectangular (>3 sulci) shapes that also include asterisks denoting the discrete sulci with cSS within these shapes. The cSS scores for the right and left hemispheres are given respectively at the bottom of each individual picture. In brief, presence of 1–3 adjacent sulci with cSS counts as 1 point, whereas more than 3 adjacent sulci counts as 2 points for each hemisphere. Each hemisphere has a score range of 0–2, with a total cSS multifocality score range of 0–4 for the patient.

