

Abstract
Background
The association between body composition (e.g. sarcopenia or visceral obesity) and treatment outcomes, such as survival, using single‐slice computed tomography (CT)‐based measurements has recently been studied in various patient groups. These studies have been conducted with different software programmes, each with their specific characteristics, of which the inter‐observer, intra‐observer, and inter‐software correlation are unknown. Therefore, a comparative study was performed.
Methods
Fifty abdominal CT scans were randomly selected from 50 different patients and independently assessed by two observers. Cross‐sectional muscle area (CSMA, i.e. rectus abdominis, oblique and transverse abdominal muscles, paraspinal muscles, and the psoas muscle), visceral adipose tissue area (VAT), and subcutaneous adipose tissue area (SAT) were segmented by using standard Hounsfield unit ranges and computed for regions of interest. The inter‐software, intra‐observer, and inter‐observer agreement for CSMA, VAT, and SAT measurements using FatSeg, OsiriX, ImageJ, and sliceOmatic were calculated using intra‐class correlation coefficients (ICCs) and Bland–Altman analyses. Cohen's κ was calculated for the agreement of sarcopenia and visceral obesity assessment. The Jaccard similarity coefficient was used to compare the similarity and diversity of measurements.
Results
Bland–Altman analyses and ICC indicated that the CSMA, VAT, and SAT measurements between the different software programmes were highly comparable (ICC 0.979–1.000, P < 0.001). All programmes adequately distinguished between the presence or absence of sarcopenia (κ = 0.88–0.96 for one observer and all κ = 1.00 for all comparisons of the other observer) and visceral obesity (all κ = 1.00). Furthermore, excellent intra‐observer (ICC 0.999–1.000, P < 0.001) and inter‐observer (ICC 0.998–0.999, P < 0.001) agreement for all software programmes were found. Accordingly, excellent Jaccard similarity coefficients were found for all comparisons (mean ≥ 0.964).
Conclusions
FatSeg, OsiriX, ImageJ, and sliceOmatic showed an excellent agreement for CSMA, VAT, and SAT measurements on abdominal CT scans. Furthermore, excellent inter‐observer and intra‐observer agreement were achieved. Therefore, results of studies using these different software programmes can reliably be compared.
Keywords: Body composition, Skeletal muscle mass, Adipose tissue mass, Comparability, Software, Computed tomography
Introduction
Biological frailty and analytic morphomics (i.e. body composition) have increasingly gained interest in recent years in relation to treatment outcomes, such as complications and (disease‐free) survival.1, 2 Frailty, a state of increased vulnerability towards stressors, leads to an increased risk of developing adverse health outcomes3 and is an important predictor of complications after interventional procedures, such as surgery and chemotherapy.4, 5, 6, 7 For example, frail patients undergoing colorectal surgery have a fourfold increased risk to develop major post operative complications.5 One of the hallmark signs of frailty is sarcopenia, the involuntary depletion of skeletal muscle mass.8, 9, 10, 11 It is estimated that up to 25% of persons under 70 years of age and over 50% of persons of 80 years and older experience sarcopenia.12 In addition, up to 80% of patients with advanced cancer are affected by cancer‐induced cachexia, a clinical condition that also results in skeletal muscle wasting with or without the loss of body fat.13, 14, 15 Patients with cachexia are more prone to a reduced therapy effect,16 and patients with low skeletal muscle mass experience increased chemotherapy toxicity.17, 18 This ultimately results in death in nearly one‐third of all cancer patients.19, 20, 21, 22
Over the last years, numerous studies have used abdominal computed tomography (CT) scans to quantify skeletal muscle mass, for example, in clinical17, 18, 23, 24, 25 and surgical26 oncology, vascular surgery,27 and transplantation surgery28, 29 patients. Furthermore, multiple studies measured visceral and/or subcutaneous adipose tissue on CT scans.30, 31, 32, 33 However, different software programmes have been used to perform these body composition analyses, such as FatSeg,33 OsiriX,7 ImageJ,24 and sliceOmatic.23 To be able to adequately compare study results, the comparability of these various software programmes should be known. Therefore, the aim of this study was to investigate the agreement of these four different software packages for the assessment of cross‐sectional skeletal muscle and subcutaneous and visceral adipose tissue measurements on abdominal CT scans.
Materials and Methods
Patients
Fifty abdominal CT scans of patients who were scheduled for rectal cancer resection at Erasmus MC University Medical Centre (Rotterdam, the Netherlands) between 2005 and 2012 were randomly selected. All CT scans were routinely performed as part of the pre‐operative diagnostic work up or assessment of down staging after neo‐adjuvant therapy. Only one CT scan was used per patient. None of the patients had an ostomy, abdominal wall deformity, abdominal wall tumour, or a CT scan with artefacts at the level of L3 that could potentially influence measurements. Self‐reported weight and height in the pre‐operative workup were retrospectively collected from electronic patient files.
Skeletal muscle and adipose tissue area measurements
The cross‐sectional skeletal muscle area (CSMA), subcutaneous adipose tissue area (SAT), and visceral adipose tissue area (VAT) (cm2), including renal adipose tissue, were measured at the mid third lumbar vertebra (L3) level on a slice showing both transversal processes. The CSMA measurements included the following muscles: psoas, paraspinal, transverse abdominal, external oblique, internal oblique, and rectus abdominis. All abdominal CT scans were assessed on identical slices in a random order by two medically trained observers [AG (observer A) and JLAvV (observer B)], with great knowledge about radiological anatomy and extensive experience in skeletal muscle and adipose tissue area measurements using various software programmes. Observer A performed measurements twice on identical a priori selected slices, whereas observer B performed a second reading without a priori selected slice numbers. The observers were blinded for each other's measurements and for patient details. For each observer, the time interval between two readings in the same patient with different software programmes was at least 1 week. This resulted in an interval of at least 4 weeks between two readings within one patient with the same software programme. Only the first reading of observer B was used for the inter‐software and inter‐observer comparisons.
The CSMA was corrected for height squared (m2), resulting in the L3 muscle index (SMI, cm2/m2). Patients were classified as having sarcopenia or not having sarcopenia according to previously described cut‐off values (52.4 cm2/m2 for men and 38.5 cm2/m2 for women).23 Predefined cut‐off values for VAT to define visceral obesity of 163.8 cm2 for men and 80.1 cm2 for women were used.34 For subcutaneous adipose tissue, no cut‐off values have been reported in the literature.
Four software programmes were compared: FatSeg [developed by the Biomedical Imaging Group Rotterdam of Erasmus MC, Rotterdam, the Netherlands, using MeVisLab (Mevis Medical Solutions, Bremen, Germany)], OsiriX (Pixmeo SARL, Geneva, Switzerland), ImageJ (National Institutes of Health, Bethesda, MD, USA), and sliceOmatic (TomoVision, Magog, Canada). The CSMA, VAT, and SAT were segmented using standard Hounsfield unit (HU) thresholds in all four software programmes. An intensity window between −30 and +150 HU was used for skeletal muscle tissue.35 For adipose tissue, an intensity window between −190 and −30 HU was used.36 Because the tissue of interest is manually selected, competency in anatomic radiology is a prerequisite for these measurements.
FatSeg
FatSeg is an in‐house developed software programme to perform soft tissue measurements on CT scans and was developed using the MeVisLab development environment for medical image processing and visualization version 2.4 (available from http://www.mevislab.de). Inner and outer contours of aforementioned skeletal muscle and adipose tissue regions were manually traced. The skeletal muscle and adipose tissue areas were computed automatically using the preset HU intensity thresholds and expressed in square centimetre. Intraluminal contents initially marked as adipose tissue were manually erased. Cutaneous tissue was included in the SAT measurement. Measurements were performed on a 3.2 GHz Intel® Core™ i5 Dell (Dell Inc., Round Rock, TX, USA) personal computer.
OsiriX
The open‐source 32‐bit edition of OsiriX version 5.8.5 (available from http://www.osirix‐viewer.com) was used. The ‘Grow Region (2D/3D Segmentation)’ tool was used to semi‐automatically select skeletal muscle and adipose tissue regions within our preset HU intensity thresholds. Non‐skeletal muscle tissue regions adjacent to skeletal muscle were manually removed from the area selection using the brush option. The brush option was also used to manually erase intraluminal areas with contents having radiological density between −190 and −30 HU, resembling fatty content. Cutaneous tissue was not included in the SAT measurement. The skeletal muscle and adipose tissue areas were computed automatically and expressed in square centimetre using a 1.3 GHz Intel® Core™ i5 MacBook Air (Apple Inc., Cupertino, CA, USA) and computer mouse.
ImageJ
ImageJ version 1.48 is a freely downloadable public domain software programme developed by the National Institutes of Health for image processing and analyzing (available from http://rsbweb.nih.gov/ij/download.html). First, manual delineation of the outer contour of the abdominal wall and paraspinal muscles was performed, and the surface area of tissue with an attenuation between −30 and +150 HU was computed automatically (mm2) and manually divided by 100, resulting in square centimetre. Second, delineation of the inner contour of the abdominal wall, paraspinal, and psoas muscles was performed in a similar fashion to allow for subsequent correction of intra‐abdominal content with attenuation between the preset HU intensity thresholds. The inner contour was manually subtracted from the outer contour surface area, resulting in the cross‐sectional skeletal muscle area (cm2).37 The SAT measurements were performed in a similar manner as the muscle measurements, whereas VAT measurements were performed by delineating a contour through the inner contour of the abdominal wall muscles, psoas muscles, and vertebrae followed by manual erasing of intraluminal fatty content. Cutaneous tissue was included in the SAT measurement. A 3.2 GHz Intel® Core™ i5 Dell personal computer was used.
SliceOmatic
SliceOmatic (TomoVIsion, Magog, Canada) version 5.0 (64 bit; available from http://www.tomovision.com) was used. Tissue was semi‐automatically selected with the ‘Region Growing’ mode using the ‘Grow 2D’ and ‘Paint’ tools. Non‐skeletal muscle tissue regions adjacent to skeletal muscle having radiological density between the predefined HU thresholds were manually erased using the ‘Paint’ tool. Cutaneous tissue was included in the SAT measurement. A 3.2 GHz Intel® Core™ i5 Dell personal computer was used.
Cutaneous tissue disclosure
In OsiriX, cutaneous tissue is not included in the SAT measurement, because this is not automatically selected using the ‘Grow Region (2D/3D Segmentation)’ tool. SliceOmatic also allows to exclude encompassed skin. However, not all software programmes allow to reliably exclude cutaneous tissue from SAT as a consequence of their measurement method: the delineation of tissue of interest using inner and outer contours. Consequently, to ensure highly comparable measurements in three rather than two software programmes, cutaneous tissue was included in the SAT measurements with sliceOmatic. A comparison of SAT measurements using sliceOmatic with and without the inclusion of cutaneous tissue resulted in a median difference of 2.3% (interquartile range 0.8–3.8) and was considered acceptable.
Statistical analysis
Continuous data are presented as mean with the standard error of the mean. Normality was tested using the Shapiro–Wilk test. Differences between the different software packages and within and between observers were compared using the paired samples t‐test for normally distributed data and the Wilcoxon signed rank test for data that were not normally distributed. The inter‐software and inter‐observer and intra‐observer agreement for the cross‐sectional skeletal muscle, visceral adipose tissue, and subcutaneous adipose tissue measurements were calculated using intra‐class correlation coefficients (ICCs) with 95% confidence interval using a two‐way mixed single measures model with absolute agreement. For the inter‐observer correlation, reading 1 of observer B was compared with reading 1 of observer A. Ninety‐five per cent limits of agreement were determined to investigate the agreement between the various software programmes, according to the method described by Bland and Altman.38 The presence of proportional systematic bias was determined by linear regression analysis of the difference and mean of two measurements. The inter‐software, inter‐observer and intra‐observer agreement of the assessment of sarcopenia and visceral obesity were analyzed using Cohen's κ coefficients. The ICCs and Cohen's κ coefficients were interpreted as poor (0.00–0.49), fair to good (0.50–0.74), and excellent (0.75–1.00), as proposed by Shrout and Fleiss.39 The Jaccard similarity coefficient, ranging from 0 to 1, was used to compare the similarity and diversity of measurements by dividing the area of the intersection by the size of the union of two measurements.40 An overlay of two measurements was created, and the Jaccard similarity coefficient was calculated using MeVisLab version 2.7.1 (MeVis Medical Solutions AG, Bremen, Germany). A Jaccard similarity coefficient of 1 represents perfect overlap of two samples, whereas 0 represents no overlap. Two‐tailed P‐values <0.05 were considered statistically significant. All statistical analyses were performed using IBM SPSS Statistics for Windows version 21.0 (IBM Corp. Armonk, NY, USA).
Results
Patients
The study population consisted of 29 men (58%) and 21 women (42%) with a median age of 62 years (range 33–81) and a median body mass index of 24.6 kg/m2 (range 16.5–38.8). Ten patients had stage II (20.0%), 24 stage III (48.0%), and 15 stage IV (30.0%) rectal cancer. Tumour stage was unknown for one patient. The mean CSMA, VAT, and SAT for all measurements are provided in Tables 1 and 2.
Table 1.
Mean cross‐sectional skeletal muscle and visceral and subcutaneous adipose tissue area (cm2) measurements and intra‐observer agreement indices (i.e. ICC) using FatSeg, OsiriX, ImageJ, and sliceOmatic of observer A
| Software | Observer A | ||||||
|---|---|---|---|---|---|---|---|
| Reading 1 (cm 2 ) | SEM | Reading 2 (cm 2 ) | SEM | Mean difference (95% CI) | P‐value | ICC (95% CI) | |
| Skeletal muscle area | |||||||
| FatSeg | 139.0 | 5.2 | 139.3 | 5.2 | −0.3 (−0.6; 0.0) | 0.072a | 0.999 (0.999–1.000) |
| OsiriX | 139.4 | 5.2 | 138.7 | 5.1 | 0.7 (0.4; 1.0) | <0.001a | 0.999 (0.999–1.000) |
| ImageJ | 139.0 | 5.2 | 139.3 | 5.1 | −0.3 (−0.6; −0.1) | 0.013a | 1.000 (0.999–1.000) |
| sliceOmatic | 138.7 | 5.2 | 138.6 | 5.2 | 0.1 (−0.2; 0.4) | 0.441a | 1.000 (0.999–1.000) |
| Visceral adipose tissue area | |||||||
| FatSeg | 149.9 | 13.1 | 149.2 | 13.1 | 0.7 (0.3; 1.0) | <0.001b | 1.000 (1.000–1.000) |
| OsiriX | 147.6 | 13.0 | 147.3 | 13.0 | 0.3 (−0.3; 0.8) | 0.220b | 1.000 (1.000–1.000) |
| ImageJ | 148.6 | 13.0 | 150.8 | 12.8 | −2.2 (−7.5; 3.1) | 0.003b | 0.979 (0.964–0.988) |
| sliceOmatic | 147.1 | 13.0 | 146.6 | 13.0 | 0.5 (0.2; 0.9) | 0.004b | 1.000 (1.000–1.000) |
| Subcutaneous adipose tissue area | |||||||
| FatSeg | 158.9 | 11.2 | 158.9 | 11.2 | 0.1 (−0.2; 0.3) | 0.359b | 1.000 (1.000–1.000) |
| OsiriX | 155.9 | 11.2 | 155.7 | 11.3 | 0.2 (−0.1; 0.4) | 0.137b | 1.000 (1.000–1.000) |
| ImageJ | 158.9 | 11.2 | 159.1 | 11.3 | −0.2 (−0.5; 0.0) | 0.201b | 1.000 (1.000–1.000) |
| sliceOmatic | 158.8 | 11.3 | 158.8 | 11.3 | 0.0 (−0.3; 0.2) | 0.448b | 1.000 (1.000–1.000) |
CI confidence interval; ICC, intra‐class correlation coefficient; SEM, standard error of the mean.
Calculated with paired sample t‐test.
Calculated with Wilcoxon signed rank test.
Table 2.
Mean cross‐sectional skeletal muscle and visceral and subcutaneous adipose tissue area (cm2) measurements and inter‐observer agreement indices (i.e. ICC) using FatSeg, OsiriX, ImageJ, and sliceOmatic of reading 1 of observers A and B
| Software | Observer A | Observer B | Mean difference (95% CI) | P‐value | ICC (95% CI) | ||
|---|---|---|---|---|---|---|---|
| Reading 1 (cm 2 ) | SEM | Reading 1 (cm 2 ) | SEM | ||||
| Skeletal muscle area (CSMA) | |||||||
| FatSeg | 139.0 | 5.2 | 140.1 | 5.2 | −1.1 (−1.4; −0.8) | <0.001a | 0.999 (0.989–1.000) |
| OsiriX | 139.4 | 5.2 | 139.7 | 5.1 | −0.3 (−0.5; 0.0) | 0.047a | 1.000 (0.999–1.000) |
| ImageJ | 139.0 | 5.2 | 139.8 | 5.2 | −0.8 (−1.0; −0.5) | <0.001a | 0.999 (0.997–1.000) |
| sliceOmatic | 138.7 | 5.2 | 139.3 | 5.2 | −0.6 (−0.9; −0.2) | 0.006a | 0.999 (0.998–1.000) |
| Visceral adipose tissue area (VAT) | |||||||
| FatSeg | 149.9 | 13.1 | 148.7 | 13.1 | 1.2 (0.8; 1.5) | <0.001b | 1.000 (0.999–1.000) |
| OsiriX | 147.6 | 13.0 | 147.3 | 13.0 | 0.3 (−0.3; 0.8) | 0.133b | 1.000 (1.000–1.000) |
| ImageJ | 148.6 | 13.0 | 148.4 | 13.1 | 0.3 (−0.1; 0.6) | 0.015b | 1.000 (1.000–1.000) |
| sliceOmatic | 147.1 | 13.0 | 146.9 | 13.0 | 0.2 (−0.1; 0.5) | 0.412b | 1.000 (1.000–1.000) |
| Subcutaneous adipose tissue area (SAT) | |||||||
| FatSeg | 158.9 | 11.2 | 159.2 | 11.3 | −0.3 (−0.5; −0.1) | 0.005b | 1.000 (1.000–1.000) |
| OsiriX | 155.9 | 11.2 | 155.8 | 11.3 | 0.1 (−0.3; 0.5) | 0.918b | 1.000 (1.000–1.000) |
| ImageJ | 158.9 | 11.2 | 158.7 | 11.2 | 0.2 (−0.2; 0.5) | 0.306b | 1.000 (1.000–1.000) |
| sliceOmatic | 158.8 | 11.3 | 158.5 | 11.2 | 0.2 (0.0; 0.5) | 0.183b | 1.000 (1.000–1.000) |
CI confidence interval; ICC, intra‐class correlation coefficient; SEM, standard error of the mean.
Calculated with paired sample t‐test.
Calculated with Wilcoxon signed rank test.
Inter‐software agreement
The inter‐software ICCs were excellent (≥0.999) for the CSMA, VAT, and SAT for all software programmes with P‐values <0.001 (Table 3). Figure 1 and Supporting Information, Figures S1 and S2 show the Bland–Altman 95% limits of agreement plots, with the mean difference and 95% limits of agreement for the CSMA, VAT, and SAT for both observers. All plots show a good agreement between the various software programmes. Small limits of agreement are observed in the CSMA measurements, whereas these limits of agreement are greater for the VAT and SAT measurements. Proportional systematic bias was observed between FatSeg and OsiriX for CSMA (P = 0.049) for observer B (Figure 1A) and between FatSeg and sliceOmatic for SAT (P = 0.031) for observer A (Supporting Information, Figure S2C). Furthermore, proportional systematic bias was frequently observed between programmes for VAT measurements (Supporting Information, Figure S1). Comparable results were achieved when non a priori selected slices of observer B (reading 2) were analyzed (data not shown). The mean Jaccard similarity coefficients for the inter‐software comparisons are summarized in Table 4 and depicted in Figure 2.
Table 3.
Mean cross‐sectional skeletal muscle and visceral and subcutaneous adipose tissue area (cm2) measurements and inter‐software agreement indices (i.e. ICC) using FatSeg, OsiriX, ImageJ, and sliceOmatic of reading 1 of observer B
| Software programme | Mean difference (cm 2 ) (95% CI) | SEM | P ‐value | ICC (95% CI) |
|---|---|---|---|---|
| Skeletal muscle area (CSMA) | ||||
| FatSeg–OsiriX | −0.4 (−0.8; 0.0) | 0.184 | 0.047 | 0.999 (0.999–1.000) |
| FatSeg–ImageJ | 0.0 (−0.3; 0.3) | 0.151 | 0.992 | 1.000 (0.999–1.000) |
| FatSeg–sliceOmatic | 0.3 (−0.2; 0.8) | 0.230 | 0.207 | 0.999 (0.998–0.999) |
| OsiriX–ImageJ | 0.4 (0.1; 0.7) | 0.161 | 0.023 | 0.999 (0.999–1.000) |
| OsiriX–sliceOmatic | 0.7 (0.3; 1.1) | 0.189 | 0.001 | 0.999 (0.998–1.000) |
| ImageJ–sliceOmatic | 0.3 (−0.1; 0.7) | 0.208 | 0.165 | 0.999 (0.999–1.000) |
| Visceral adipose tissue area (VAT) | ||||
| FatSeg–OsiriX | 2.3 (1.6; 2.9) | 0.326 | <0.001 | 0.999 (0.995–1.000) |
| FatSeg–ImageJ | 1.2 (0.8; 1.7) | 0.203 | <0.001 | 1.000 (0.999–1.000) |
| FatSeg–sliceOmatic | 2.8 (2.3; 3.2) | 0.238 | <0.001 | 0.999 (0.971–1.000) |
| OsiriX–ImageJ | −1.0 (−1.5; −0.6) | 0.237 | <0.001 | 1.000 (0.999–1.000) |
| OsiriX–sliceOmatic | 0.5 (0.0; 0.9) | 0.229 | 0.044 | 1.000 (1.000–1.000) |
| ImageJ–sliceOmatic | 1.5 (1.2; 1.8) | 0.158 | <0.001 | 1.000 (0.995–1.000) |
| Subcutaneous adipose tissue area (SAT) | ||||
| FatSeg–OsiriX | 3.0 (2.5; 3.6) | 0.256 | <0.001 | 0.999 (0.948–1.000) |
| FatSeg–ImageJ | 0.1 (–0.3; 0.4) | 0.180 | 0.698 | 1.000 (1.000–1.000) |
| FatSeg–sliceOmatic | 0.2 (−0.1; 0.5) | 0.141 | 0.240 | 1.000 (1.000–1.000) |
| OsiriX–ImageJ | −3.0 (−3.5; −2.5) | 0.260 | <0.001 | 0.999 (0.956–1.000) |
| OsiriX–sliceOmatic | −2.9 (−3.3; −2.5) | 0.211 | <0.001 | 0.999 (0.932–1.000) |
| ImageJ–sliceOmatic | 0.1 (−0.2; 0.4) | 0.139 | 0.485 | 1.000 (1.000–1.000) |
The results of observer A are comparable with those of observer B.
CI confidence interval; ICC, inter‐class and intra‐class correlation coefficients; SEM, standard error of the mean.
Figure 1.
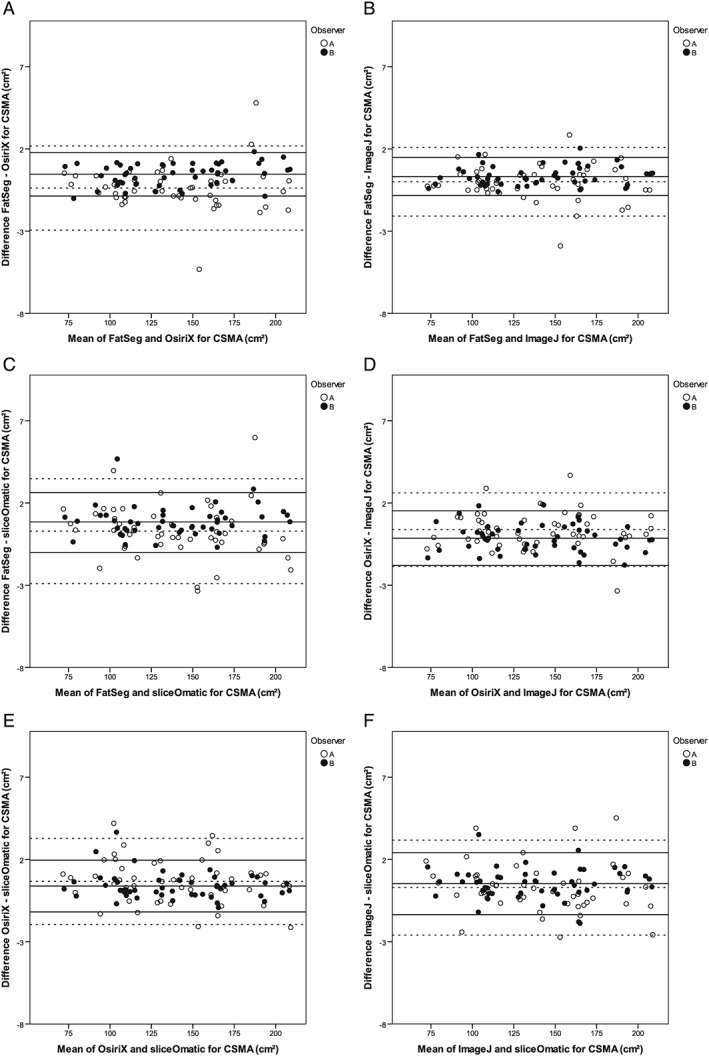
Bland–Altman 95% limits of agreement plots for the agreement between the various software programmes (provided on the x‐axes and y‐axes) for CSMA (cm2). The dotted lines are the mean of the difference and the 95% limits of agreement (±2 SD) between the CSMA of reading 1 of observer A and the solid lines of reading 1 of observer B. (A) There was no proportional systematic bias for observer A (P = 0.908), whereas there was significant bias for observer B (P = 0.049). (B) There was no proportional systematic bias for any observer (P = 0.738 and P = 0.359). (C) There was no proportional systematic bias for any observer (P = 0.238 and P = 0.704). (D) There was no proportional systematic bias for any observer (P = 0.857 and P = 0.363). (E) There was no proportional systematic bias for any observer (P = 0.185 and P = 0.228). (F) There was no proportional systematic bias for any observer (P = 0.289 and P = 0.843).
Table 4.
Mean Jaccard indices for inter‐software comparisons of reading 1 of observer A and reading 1 of observer B
| Mean Jaccard similarity coefficients | ||||||
|---|---|---|---|---|---|---|
| Observer A (reading 1) (range) | Observer B (reading 1) (range) | |||||
| CSMA | VAT | SAT | CSMA | VAT | SAT | |
| FatSeg–OsiriX | 0.978 (0.940–0.997) | 0.964 (0.825–0.996) | 0.965 (0.928–0.976) | 0.983 (0.948–0.997) | 0.973 (0.886–0.997) | 0.965 (0.926–0.998) |
| FatSeg–ImageJ | 0.982 (0.935–0.996) | 0.981 (0.912–0.999) | 0.988 (0.900–0.999) | 0.987 (0.959–0.998) | 0.981 (0.903–0.998) | 0.990 (0.968–0.998) |
| FatSeg–sliceOmatic | 0.978 (0.937–0.996) | 0.970 (0.908–0.997) | 0.989 (0.964–0.998) | 0.981 (0.927–0.996) | 0.972 (0.860–0.997) | 0.987 (0.960–0.998) |
| OsiriX–ImageJ | 0.982 (0.935–0.996) | 0.968 (0.856–0.995) | 0.964 (0.900–0.998) | 0.983 (0.948–0.997) | 0.976 (0.891–0.998) | 0.966 (0.927–0.997) |
| OsiriX–sliceOmatic | 0.979 (0.941–0.997) | 0.974 (0.876–0.997) | 0.988 (0.900–0.998) | 0.985 (0.944–0.997) | 0.973 (0.884–0.998) | 0.967 (0.923–0.998) |
| ImageJ–sliceOmatic | 0.979 (0.950–0.994) | 0.967 (0.809–0.995) | 0.966 (0.928–0.997) | 0.983 (0.932–0.997) | 0.975 (0.855–0.998) | 0.988 (0.965–0.999) |
CSMA, cross‐sectional muscle area; SAT, subcutaneous adipose tissue area; VAT, visceral adipose tissue area.
Figure 2.
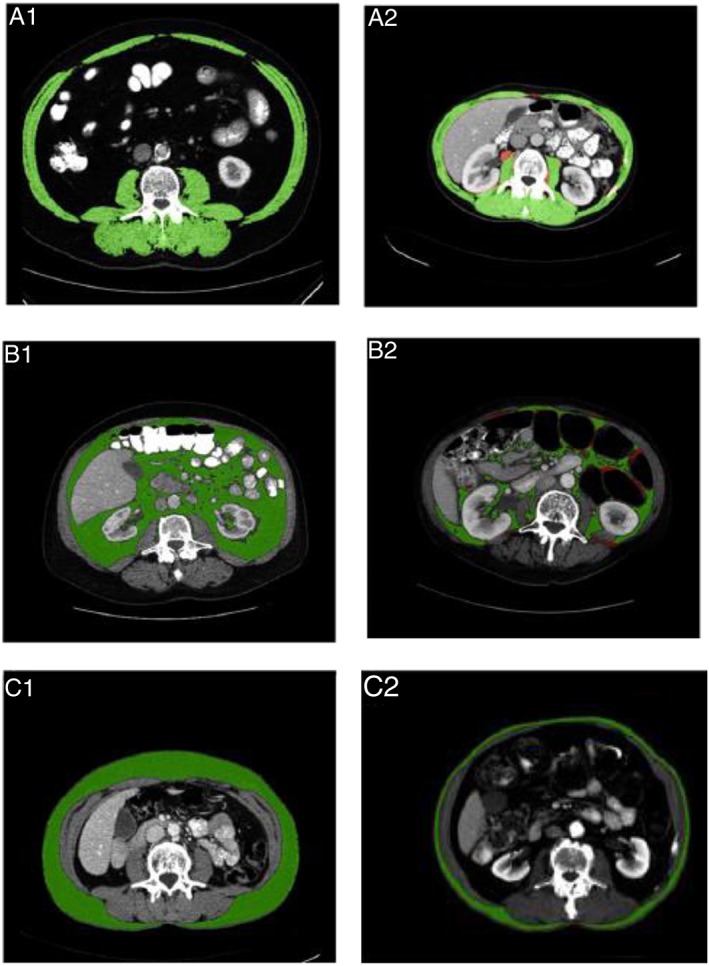
Jaccard similarity coefficients (lowest and highest are shown) for inter‐software comparisons of CSMA, VAT, and SAT (cm2) measurements (reading 1 of observer B). The green area represents similarity, whereas the red area represents discrepancy in measurements. (A) The CSMA measured with FatSeg and ImageJ (1) and FatSeg and sliceOmatic (2), resulting in Jaccard similarity coefficients of 0.998 and 0.927, respectively. (B) The VAT measured with ImageJ and sliceOmatic (1, 2), resulting in Jaccard similarity coefficients of 0.998 and 0.855, respectively. (C) The SAT measured with ImageJ and sliceOmatic (1) and OsiriX and sliceOmatic (2), resulting in Jaccard similarity coefficients of 0.999 and 0.923, respectively.
Intra‐observer and inter‐observer agreement
The ICCs for the intra‐observer agreement of observer A were all 0.979 or higher for the different software programmes, approaching perfect correlation (Table 1). The ICCs for the inter‐observer agreement also approached perfect agreement (all ≥0.999, Table 2). The mean CSMA was significantly lower for observer A compared with observer B for all software programmes. A significantly higher mean VAT of observer A was found using FatSeg (149.9 cm2 vs. 148.7 cm2, P < 0.001) and ImageJ (148.6 cm2 vs. 148.4 cm2, P = 0.015) compared with observer B, whereas the mean VAT of both observers did not significantly differ for OsiriX (P = 0.133) and sliceOmatic (P = 0.412). The mean SAT did significantly differ for FatSeg (158.9 cm2 vs. 159.2 cm2, P = 0.005) between the observers. Comparable results were observed when non a priori selected slices of reading 2 of observer B were used for analyses (data not shown). The mean Jaccard similarity coefficients for the inter‐observer and intra‐observer comparisons are summarized in Table 5 and depicted in Supporting Information, Figures S3 and S4. All remaining worst Jaccard similarity coefficients are provided in Supporting Information, Figure S5.
Table 5.
Mean Jaccard indices for inter‐observer (reading 1 of observer A vs. reading 1 of observer B) and intra‐observer comparisons (reading 1 vs. reading 2 of observer A)
| Mean Jaccard similarity coefficients | ||||||
|---|---|---|---|---|---|---|
| Inter‐observer (range) | Intra‐observer (range) | |||||
| CSMA | VAT | SAT | CSMA | VAT | SAT | |
| FatSeg | 0.981 (0.949–0.997) | 0.976 (0.908–0.998) | 0.991 (0.969–0.999) | 0.982 (0.961–1.000) | 0.984 (0.916–0.999) | 0.991 (0.956–1.000) |
| OsiriX | 0.985 (0.960–0.997) | 0.973 (0.835–0.997) | 0.989 (0.960–1.000) | 0.984 (0.953–0.997) | 0.975 (0.838–0.998) | 0.990 (0.967–1.000) |
| ImageJ | 0.982 (0.931–0.993) | 0.980 (0.905–0.997) | 0.988 (0.899–0.999) | 0.985 (0.948–1.000) | 0.982 (0.891–0.998) | 0.990 (0.900–1.000) |
| sliceOmatic | 0.981 (0.939–0.997) | 0.976 (0.876–0.996) | 0.989 (0.959–0.999) | 0.986 (0.961–0.997) | 0.980 (0.901–0.998) | 0.993 (0.967–1.000) |
CSMA, cross‐sectional muscle area; SAT, subcutaneous adipose tissue area; VAT, visceral adipose tissue area.
The classification of sarcopenia and visceral obesity
The inter‐software Cohen's κ's of the first reading of observer A for the classification of sarcopenia were 0.96 (between FatSeg and Osirix, OsiriX and ImageJ, and ImageJ and sliceOmatic), 0.92 (between FatSeg and ImageJ, and Osirix and sliceOmatic), and 0.88 (between FatSeg and sliceOmatic). No inter‐software differences were found in the classification of patients with and without sarcopenia for observer B. According to the cut‐off values used, all software programmes diagnosed sarcopenia in 16 men (55.2%) and 8 women (38.1%). This resulted in a Cohen's κ of 1.00 for all comparisons between software programmes (P < 0.001).
The Cohen's κ for the intra‐observer agreement of sarcopenia assessment of observer A was 0.96 using FatSeg and ImageJ and 1.00 for OsiriX and sliceOmatic (all P < 0.001).
The Cohen's κ for the inter‐observer agreement (reading 1 of observer A vs. reading 1 of observer B) of sarcopenia assessment was 0.92 for sliceOmatic, 0.96 for FatSeg and ImageJ, and 1.00 for Osirix (all P < 0.001).
The classification of visceral obesity
In total, 17 men (58.6%) and 9 women (42.9%) were classified as visceral obese using FatSeg, OsiriX, ImageJ, and sliceOmatic in all readings. This resulted in a Cohen's κ of 1.00 for all comparisons (all P < 0.001).
Discussion
This study shows that the inter‐software agreement was excellent for all software programmes. Furthermore, the inter‐observer and intra‐observer agreements were excellent for four distinct software programmes to assess CSMA, VAT, and SAT on abdominal CT scans with high Jaccard similarity coefficients.
Body composition analyses using abdominal CT scans are increasingly being performed. In multiple surgical populations, such as vascular,27 gastrointestinal,7, 33 urological,41, 42, 43 gynaecological,44 and transplantation surgery,29 the association between low skeletal muscle mass and an increased risk of post operative complications, recurrent disease, or impaired survival has been shown. Low skeletal muscle mass is also related to discharge destination in elderly trauma patients,45 associated with an increased risk of dose‐limiting chemotherapy toxicity17, 24, 25, 46 and with morbidity and mortality in various oncologic populations, such as lung cancer and melanoma patients.47, 48 Furthermore, CT‐assessed visceral obesity is associated with worse short‐term and long‐term outcome in distinct patient populations undergoing surgery.30 Various software programmes have been used to measure body composition in these studies. The current study shows that the results of these studies can reliably be compared. Based on our findings, it is likely that this is also true for other software programmes, which similarly compute skeletal muscle area by quantifying selected voxels within preset HU intensity thresholds [e.g. studies that used software programmes designed in MATLAB (MathWorks, Natick, MA, USA)49].
Software programmes for various body composition measurements on CT images, such as adipose tissue surface area, skeletal muscle tissue surface area, and liver volumetric measurements, have been compared in multiple previous studies, demonstrating high levels of agreement.50, 51, 52, 53 Excellent agreement levels between sliceOmatic and ImageJ,54 as well as between observers using sliceOmatic55 for CSMA measurements have previously been reported. Furthermore, excellent agreement levels between OsiriX and ImageJ have been observed for paraspinal muscle measurements on magnetic resonance images.56 Nevertheless, this is the first study to compare multiple software programmes for the measurement of CSMA, VAT, and SAT, showing that previous studies investigating the association between skeletal muscle mass on the one side and visceral or subcutaneous adipose tissue on the other side, and patient outcomes can reliably be compared.
The skeletal muscle area (cm2) measured at a single cross‐sectional CT image at the level of the third lumbar vertebra (L3) is linearly related to total body skeletal muscle mass57 and is therefore corrected for height squared (m2), as is conventional for body composition measures. This results in the L3 muscle index (cm2/m2).18 Another frequently used method is measuring the total psoas area (TPA).27 The principle of TPA measurements is identical to L3 muscle area measurements, using single cross‐sectional CT images. Therefore, the findings of this study may be extrapolated to TPA measurements as well. Nevertheless, this should be confirmed in a future study.
Significant differences were observed between the mean skeletal muscle areas within and between observers. However, these mean differences are small and consequently could be considered as not clinically relevant. Differences in individual measurements resulted, for instance, from the incorrect annotation of skeletal muscle tissue (see Figure 2A2 for an example of an intra‐observer difference). However, we decided not to correct measurements in retrospect to show inter‐observer and intra‐observer agreements. In our opinion, this study reflects daily practice, with observers who have excellent (radiological) anatomical knowledge performing body composition measurements. Regardless of these human errors and some inter‐observer and intra‐observer differences, high comparability between software programmes was observed.
Significant differences between VAT measurements were also observed with greater mean differences between software. This could be due to the greater complexity of the measurement technique, as intraluminal content (i.e. fat in stool) needs to be manually erased. The greatest significant mean differences in SAT could partly been explained by the fact that in OsiriX the cutaneous adipose tissue in not included in the SAT, in contrast to the other software programmes. Furthermore, every tissue of interest needs to be manually selected in OsiriX, in contrast to the other programmes in which methods of delineating or a painting brush can be used to select regions of interest.
Significant differences in the mean VAT (FatSeg and ImageJ) within observer A and in the mean VAT (FatSeg, OsiriX, and sliceOmatic) and SAT (FatSeg, OsiriX, and ImageJ) between observers (reading 2 of observer A with non a priori selected slices; data not shown) were found, whereas the CSMA did not significantly differ. One explanation for the differences in VAT and SAT could be the random slice selection. After all, the distribution of the intra‐abdominal content (e.g. bowel) can greatly differ between slices. Consequently, single slice measurement of visceral adipose tissue would not be clinical applicable and should be reserved for clinical research of patient cohorts rather than individual patients. For SAT, the variance of subcutaneous adipose tissue distribution could have led to the observed differences. Nevertheless, all differences are relatively small and could therefore be considered as not clinically relevant. The inter‐observer agreement levels for OsiriX and sliceOmatic are in line with previous studies that showed a strong and significant correlation between CSMA measurements of two observers.7, 55 The inter‐observer agreements for FatSeg and ImageJ have never been reported before, whereas a high agreement for the classification of patients with sarcopenia, as expressed in Cohen's κ, has previously been reported.7
Several limitations apply to the current study and the used software programmes. First, both observers in the current study were experienced in quantifying skeletal muscle mass using these software programmes prior to conducting this study. Therefore, the agreement rates that were obtained may not apply to less experienced users. Second, OsiriX is only compatible with Macintosh, which is less commonly used in clinical practice. Furthermore, FatSeg is not freely downloadable as it is an in‐house developed software programme that has not been made publically available, in contrast to OsiriX and ImageJ. A license is required for the use of sliceOmatic. Third, this study could only assess the agreement of the measurement with different software programmes on the same data. Intra‐scanner and inter‐scanner reproducibility of the measurement could not be assessed with the current study design. Last, previous studies reported an approximate time of 8 min to quantify skeletal muscle, visceral, and subcutaneous adipose tissue in liver transplant patients using sliceOmatic.55 Although some differences in user‐friendliness were observed while performing the measurements, these were not objectively observed and scored in the current study. Consequently, these are not described.
Conclusions
In conclusion, this study showed that four different software programmes have an excellent agreement to measure VAT and SAT, and CSMA in particular on abdominal CT scans, which enables reliable comparison of results of studies that use these different software programmes. Multiple slice analysis is preferred for VAT and SAT measurements.
Conflict of interest
J.L.A. van Vugt, S. Levolger, A. Gharbharan, M. Koek, J.W.A. Burger, S.P. Willemsen, R.W.F. de Bruin and J.N.M IJzermans have no conflicts of interest. W.J. Niessen is co‐founder and shareholder of Quantib BV.
Supporting information
Supplementary figure 1. Bland‐Altman 95% limits of agreement plots for the agreement between the various software programs (provided on the X‐axes and Y‐axes) for VAT (cm2). The dotted lines are the mean of the difference and the 95% limits of agreement (±2 SD) between the VAT of reading 1 of observer A and the solid lines of reading 1 of observer B
Supplementary figure 1a. There was proportional systematic bias for both observers (p = 0.004 and p = 0.043, respectively).
Supplementary figure 1b. There was proportional systematic bias for observer A (p = 0.038), but not for observer B (p = 0.154).
Supplementary figure 1c. There was proportional systematic bias for both observers (both p = 0.002).
Supplementary figure 1d. There was proportional systematic bias for observer A (p = 0.045), whereas there was no proportional systematic bias for observer B (p = 0.202).
Supplementary figure 1e. There was no proportional systematic bias for any observer (p = 0.412 and p = 0.114, respectively).
Supplementary figure 1f. There was no proportional systematic bias for observer A (p = 0.068), whereas there was significant bias for observer B (p = 0.014).
Supplementary figure 2. Bland‐Altman 95% limits of agreement plots for the agreement between the various software programs (provided on the X‐axes and Y‐axes) for SAT (cm2). The dotted lines are the mean of the difference and the 95% limits of agreement (±2 SD) between the SAT of reading 1 of observer A and the solid lines of reading 1 of observer B.
Supplementary figure 2a. There was no proportional systematic bias for any observer (p = 0.534 and p = 0.801, respectively).
Supplementary figure 2b. There was no proportional systematic bias for any observer (p = 0.538 and p = 0.112, respectively).
Supplementary figure 2c. There was proportional systematic bias for observer A (p = 0.031), whereas there was no proportional systematic bias for observer B (p = 0.134).
Supplementary figure 2d. There was no proportional systematic bias for any observer (p = 0.853 and p = 0.344, respectively).
Supplementary figure 2e. There was no proportional systematic bias for any observer (p = 0.511 and p = 0.305, respectively).
Supplementary figure 2f. There was no proportional systematic bias for any observer (p = 0.175 and p = 0.939, respectively).
Supplementary figure 3. Jaccard similarity coefficients (lowest and highest are shown) for inter‐observer comparisons of CSMA, VAT, and SAT (cm2) measurements (reading 1 of observer A versus reading 1 of observer B). The green area represents similarity, whereas the red area represents discrepancy in measurements.
Supplementary figure 3a. The CSMA measured with FatSeg (1) and ImageJ (2), resulting in Jaccard similarity coefficients of 0.997 and 0.931, respectively.
Supplementary figure 3b. The VAT measured with FatSeg (1) and OsiriX (2), resulting in Jaccard similarity coefficients of 0.998 and 0.835, respectively.
Supplementary figure 3c. The SAT measured with OsiriX (1) and ImageJ (2), resulting in Jaccard similarity coefficients of 1.000 and 0.899, respectively.
Supplementary figure 4. Jaccard similarity coefficients (lowest and highest are shown) for intra‐observer comparisons of CSMA, VAT, and SAT (cm2) measurements (reading 1 versus reading 2 of observer A). The green area represents similarity, whereas the red area represents discrepancy in measurements.
Supplementary figure 4a. The CSMA measured with FatSeg (1) and OsiriX (2), resulting in Jaccard similarity coefficients of 1.000 and 0.953, respectively.
Supplementary figure 4b. The VAT measured with FatSeg (1) and OsiriX (2), resulting in Jaccard similarity coefficients of 0.999 and 0.838, respectively.
Supplementary figure 4c. The SAT measured with ImageJ (1, 2), resulting in Jaccard similarity coefficients of 1.000 and 0.900, respectively. Furthermore, a Jaccard similarity coefficient of 1.000 was also observed in two other patients measured with FatSeg and OsiriX.
Supplementary figure 5. All worst Jaccard similarity coefficients for the inter‐software (5a), inter‐observer (5b) and intra‐observer (5c) agreement for the three body composition analyses except the ones that are shown in figure 2 and supplementary figures 2 and 3.
Supplementary figure 5a1a. CSMA measured with FatSeg and Image resulting in a Jaccard similarity coefficient of 0.959.
Supplementary figure 5a1b. CSMA measured with FatSeg and OsiriX resulting in a Jaccard similarity coefficient of 0.948.
Supplementary figure 5a1c. CSMA measured with ImageJ and OsiriX resulting in a Jaccard similarity coefficient of0.948.
Supplementary figure 5a1d. CSMA measured with ImageJ and sliceOmatic resulting in a Jaccard similarity coefficient of 0.932.
Supplementary figure 5a1e. CSMA measured with OsiriX and sliceOmatic resulting in a Jaccard similarity coefficient of0.944.
Supplementary figure 5a2a. VAT measured with FatSeg and ImageJ resulting in a Jaccard similarity coefficient of0.903.
Supplementary figure 5a2b. VAT measured with FatSeg and OsiriX resulting in a Jaccard similarity coefficient of 0.886.
Supplementary figure 5a2c. VAT measured with FatSeg and sliceOmatic resulting in a Jaccard similarity coefficient of 0.860.
Supplementary figure 5a2d. VAT measured with ImageJ and OsiriX resulting in a Jaccard similarity coefficient of 0.891.
Supplementary figure 5a2e. VAT measured with OsiriX and sliceOmatic resulting in a Jaccard similarity coefficient of 0.884.
Supplementary figure 5a3a. SAT measured with FatSeg and ImageJ resulting in a Jaccard similarity coefficient of0.968.
Supplementary figure 5a3b. SAT measured with FatSeg and OsiriX resulting in a Jaccard similarity coefficient of 0.926.
Supplementary figure 5a3c. SAT measured with FatSeg and sliceOmatic resulting in a Jaccard similarity coefficient of 0.960.
Supplementary figure 5a3d. SAT measured with ImageJ and OsiriX resulting in a Jaccard similarity coefficient of 0.927.
Supplementary figure 5a3e. SAT measured with ImageJ and sliceOmatic resulting in a Jaccard similarity coefficient of 0.965.
Supplementary figure 5b1a. CSMA measured with FatSeg resulting in a Jaccard similarity coefficient of 0.949.
Supplementary figure 5b1b. CSMA measured with OsiriX resulting in a Jaccard similarity coefficient of 0.931.
Supplementary figure 5b1c. CSMA measured with sliceOmatic resulting in a Jaccard similarity coefficient of 0.939.
Supplementary figure 5b2a. VAT measured with FatSeg resulting in a Jaccard similarity coefficient of 0.908.
Supplementary figure 5b2b. VAT measured with ImageJ resulting in a Jaccard similarity coefficient of 0.905.
Supplementary figure 5b2c. VAT measured with sliceOmatic resulting in a Jaccard similarity coefficient of 0.876.
Supplementary figure 5b3a. SAT measured with FatSeg resulting in a Jaccard similarity coefficient of 0.969.
Supplementary figure 5b3b. SAT measured with OsiriX resulting in a Jaccard similarity coefficient of 0.961.
Supplementary figure 5b3c. SAT measured with sliceOmatic resulting in a Jaccard similarity coefficient of 0.959.
Supplementary figure 5c1a. CSMA measured with FatSeg resulting in a Jaccard similarity coefficient of 0.961.
Supplementary figure 5c1b. CSMA measured with ImageJ resulting in a Jaccard similarity coefficient of 0.948.
Supplementary figure 5c1c. CSMA measured with sliceOmatic resulting in a Jaccard similarity coefficient of 0.961.
Supplementary figure 5c2a. VAT measured with FatSeg resulting in a Jaccard similarity coefficient of 0.916.
Supplementary figure 5c2b. VAT measured with ImageJ resulting in a Jaccard similarity coefficient of 0.891.
Supplementary figure 5c2c. VAT measured with sliceOmatic resulting in a Jaccard similarity coefficient of 0.901.
Supplementary figure 5c3a. SAT measured with FatSeg resulting in a Jaccard similarity coefficient of 0.956.
Supplementary figure 5c3b. SAT measured with OsiriX resulting in a Jaccard similarity coefficient of 0.967.
Supplementary figure 5c3c. SAT measured with sliceOmatic resulting in a Jaccard similarity coefficient of 0.967.
Supporting info item
Acknowledgements
The authors would like to thank Laurens Groenendijk and Elsaline Rijkse of the Imaging Trial Office, department of Radiology and Nuclear Medicine, Erasmus MC University Medical Centre, Rotterdam, the Netherlands, for anonymizing and providing the CT scans, and Yves Martel of sliceOmatic (TomoVision, Magog, Canada) for providing a temporary free license to use the software package. The authors certify that they comply with the ethical guidelines for publishing in the Journal of Cachexia, Sarcopenia and Muscle: update 2015.58
JLAvV designed the study, performed the measurements (observer B), analyzed and interpreted the data, and wrote the manuscript. SL designed the study, interpreted the data, and wrote the manuscript. AG performed the measurements (observer A) and analyzed the data. MK and WJN developed and provided the FatSeg software programme and provided technical advice and support for the measurements and the calculation of the Jaccard similarity coefficients. SPW provided statistical and methodological advice and interpreted the data. JWA Burger provided the clinical data. RWFdB and JNMIJ interpreted the data and supervised the study. All authors critically revized the manuscript and approved the manuscript for publication.
van Vugt, J. L. A. , Levolger, S. , Gharbharan, A. , Koek, M. , Niessen, W. J. , Burger, J. W. A. , Willemsen, S. P. , de Bruin, R. W. F. , and IJzermans, J. N. M. (2017) A comparative study of software programmes for cross‐sectional skeletal muscle and adipose tissue measurements on abdominal computed tomography scans of rectal cancer patients. Journal of Cachexia, Sarcopenia and Muscle, 8: 285–297. doi: 10.1002/jcsm.12158.
Contributor Information
Jeroen L.A. van Vugt, Email: j.l.a.vanvugt@erasmusmc.nl
Jan N.M. IJzermans, Email: j.ijzermans@erasmusmc.nl
References
- 1. Leo S, Accettura C, Gnoni A, Licchetta A, Giampaglia M, Mauro A, Saracino V, Carr BI. Systemic treatment of gastrointestinal cancer in elderly patients. J Gastrointest Cancer 2013;44:22–32. [DOI] [PubMed] [Google Scholar]
- 2. Englesbe MJ, Lee JS, He K, Fan L, Schaubel DE, Sheetz KH, Harbaugh CM, Holcombe SA, Campbell DA Jr, Sonnenday CJ, Wang SC. Analytic morphomics, core muscle size, and surgical outcomes. Ann Surg 2012;256:255–61. [DOI] [PubMed] [Google Scholar]
- 3. Fried LP, Hadley EC, Walston JD, Newman AB, Guralnik JM, Studenski S, Harris TB, Ershler WB, Ferrucci L. From bedside to bench: research agenda for frailty. Sci Aging Knowledge Environ 2005;2005:pe24. [DOI] [PubMed] [Google Scholar]
- 4. Robinson TN, Wu DS, Stiegmann GV, Moss M. Frailty predicts increased hospital and six‐month healthcare cost following colorectal surgery in older adults. Am J Surg 2011;202:511–4. [DOI] [PMC free article] [PubMed] [Google Scholar]
- 5. Tan KY, Kawamura YJ, Tokomitsu A, Tang T. Assessment for frailty is useful for predicting morbidity in elderly patients undergoing colorectal cancer resection whose comorbidities are already optimized. Am J Surg 2012;204:139–43. [DOI] [PubMed] [Google Scholar]
- 6. Tegels JJ, de Maat MF, Hulsewe KW, Hoofwijk AG, Stoot JH. Value of geriatric frailty and nutritional status assessment in predicting postoperative mortality in gastric cancer surgery. J Gastrointest Surg 2014. [DOI] [PubMed] [Google Scholar]
- 7. Reisinger KW, van Vugt JL, Tegels JJ, Snijders C, Hulsewe KW, Hoofwijk AG, Stoot JH, Von Meyenfeldt MF, Beets GL, Derikx JP, Poeze M. Functional compromise reflected by sarcopenia, frailty, and nutritional depletion predicts adverse postoperative outcome after colorectal cancer surgery. Ann Surg 2015;261:345–52. [DOI] [PubMed] [Google Scholar]
- 8. Rolland Y. Abellan van Kan G, Gillette‐Guyonnet S, and Vellas B. Cachexia versus sarcopenia. Curr Opin Clin Nutr Metab Care 2011;14:15–21. [DOI] [PubMed] [Google Scholar]
- 9. Cooper C, Dere W, Evans W, Kanis JA, Rizzoli R, Sayer AA, Sieber CC, Kaufman JM. Abellan van Kan G, Boonen S, Adachi J, Mitlak B, Tsouderos Y, Rolland Y, and Reginster JY. Frailty and sarcopenia: definitions and outcome parameters. Osteoporos Int 2012;23:1839–48. [DOI] [PubMed] [Google Scholar]
- 10. Marzetti E, Leeuwenburgh C. Skeletal muscle apoptosis, sarcopenia and frailty at old age. Exp Gerontol 2006;41:1234–8. [DOI] [PubMed] [Google Scholar]
- 11. Roubenoff R. Sarcopenia: a major modifiable cause of frailty in the elderly. J Nutr Health Aging 2000;4:140–2. [PubMed] [Google Scholar]
- 12. Baumgartner RN, Koehler KM, Gallagher D, Romero L, Heymsfield SB, Ross RR, Garry PJ, Lindeman RD. Epidemiology of sarcopenia among the elderly in New Mexico. Am J Epidemiol 1998;147:755–63. [DOI] [PubMed] [Google Scholar]
- 13. Fearon K, Strasser F, Anker SD, Bosaeus I, Bruera E, Fainsinger RL, Jatoi A, Loprinzi C, MacDonald N, Mantovani G, Davis M, Muscaritoli M, Ottery F, Radbruch L, Ravasco P, Walsh D, Wilcock A, Kaasa S, Baracos VE. Definition and classification of cancer cachexia: an international consensus. Lancet Oncol 2011;12:489–95. [DOI] [PubMed] [Google Scholar]
- 14. Evans WJ. Skeletal muscle loss: cachexia, sarcopenia, and inactivity. Am J Clin Nutr 2010;91:1123S–7S. [DOI] [PubMed] [Google Scholar]
- 15. Evans WJ, Morley JE, Argiles J, Bales C, Baracos V, Guttridge D, Jatoi A, Kalantar‐Zadeh K, Lochs H, Mantovani G, Marks D, Mitch WE, Muscaritoli M, Najand A, Ponikowski P, Rossi Fanelli F, Schambelan M, Schols A, Schuster M, Thomas D, Wolfe R, Anker SD. Cachexia: a new definition. Clin Nutr 2008;27:793–9. [DOI] [PubMed] [Google Scholar]
- 16. Bachmann J, Heiligensetzer M, Krakowski‐Roosen H, Buchler MW, Friess H, Martignoni ME. Cachexia worsens prognosis in patients with resectable pancreatic cancer. J Gastrointest Surg 2008;12:1193–201. [DOI] [PubMed] [Google Scholar]
- 17. Antoun S, Baracos VE, Birdsell L, Escudier B, Sawyer MB. Low body mass index and sarcopenia associated with dose‐limiting toxicity of sorafenib in patients with renal cell carcinoma. Ann Oncol 2010;21:1594–8. [DOI] [PubMed] [Google Scholar]
- 18. Prado CM, Baracos VE, McCargar LJ, Reiman T, Mourtzakis M, Tonkin K, Mackey JR, Koski S, Pituskin E, Sawyer MB. Sarcopenia as a determinant of chemotherapy toxicity and time to tumor progression in metastatic breast cancer patients receiving capecitabine treatment. Clin Cancer Res 2009;15:2920–6. [DOI] [PubMed] [Google Scholar]
- 19. Fearon KC. Cancer cachexia: developing multimodal therapy for a multidimensional problem. Eur J Cancer 2008;44:1124–32. [DOI] [PubMed] [Google Scholar]
- 20. Tisdale MJ. Mechanisms of cancer cachexia. Physiol Rev 2009;89:381–410. [DOI] [PubMed] [Google Scholar]
- 21. Acharyya S, Butchbach ME, Sahenk Z, Wang H, Saji M, Carathers M, Ringel MD, Skipworth RJ, Fearon KC, Hollingsworth MA, Muscarella P, Burghes AH, Rafael‐Fortney JA, Guttridge DC. Dystrophin glycoprotein complex dysfunction: a regulatory link between muscular dystrophy and cancer cachexia. Cancer Cell 2005;8:421–32. [DOI] [PubMed] [Google Scholar]
- 22. Loberg RD, Bradley DA, Tomlins SA, Chinnaiyan AM, Pienta KJ. The lethal phenotype of cancer: the molecular basis of death due to malignancy. CA Cancer J Clin 2007;57:225–41. [DOI] [PubMed] [Google Scholar]
- 23. Prado CM, Lieffers JR, McCargar LJ, Reiman T, Sawyer MB, Martin L, Baracos VE. Prevalence and clinical implications of sarcopenic obesity in patients with solid tumours of the respiratory and gastrointestinal tracts: a population‐based study. Lancet Oncol 2008;9:629–35. [DOI] [PubMed] [Google Scholar]
- 24. Huillard O, Mir O, Peyromaure M, Tlemsani C, Giroux J, Boudou‐Rouquette P, Ropert S, Delongchamps NB, Zerbib M, Goldwasser F. Sarcopenia and body mass index predict sunitinib‐induced early dose‐limiting toxicities in renal cancer patients. Br J Cancer 2013;108:1034–41. [DOI] [PMC free article] [PubMed] [Google Scholar]
- 25. Antoun S, Borget I, Lanoy E. Impact of sarcopenia on the prognosis and treatment toxicities in patients diagnosed with cancer. Curr Opin Support Palliat Care 2013;7:383–9. [DOI] [PubMed] [Google Scholar]
- 26. Levolger S, van Vugt JL, de Bruin RW, IJzermans JN. Systematic review of sarcopenia in patients operated on for gastrointestinal and hepatopancreatobiliary malignancies. Br J Surg 2015;102:1448–58. [DOI] [PubMed] [Google Scholar]
- 27. Lee JS, He K, Harbaugh CM, Schaubel DE, Sonnenday CJ, Wang SC, Englesbe MJ, Eliason JL, Michigan Analytic Morphomics G . Frailty, core muscle size, and mortality in patients undergoing open abdominal aortic aneurysm repair. J Vasc Surg 2011;53:912–7. [DOI] [PubMed] [Google Scholar]
- 28. Carey EJ. Sarcopenia in solid organ transplantation. Nutr Clin Pract 2014;29:159–70. [DOI] [PubMed] [Google Scholar]
- 29. van Vugt JL, Levolger S, de Bruin RW, van Rosmalen J, Metselaar HJ, IJzermans JN. Systematic review and meta‐analysis of the impact of computed tomography assessed skeletal muscle mass on outcome in patients awaiting or undergoing liver transplantation. Am J Transplant 2016. Aug;16:2277–2292. [DOI] [PubMed] [Google Scholar]
- 30. Cakir H, Heus C, van der Ploeg TJ, Houdijk AP. Visceral obesity determined by CT scan and outcomes after colorectal surgery; a systematic review and meta‐analysis. Int J Colorectal Dis 2015;30:875–82. [DOI] [PubMed] [Google Scholar]
- 31. Cecchini S, Cavazzini E, Marchesi F, Sarli L, Roncoroni L. Computed tomography volumetric fat parameters versus body mass index for predicting short‐term outcomes of colon surgery. World J Surg 2011;35:415–23. [DOI] [PubMed] [Google Scholar]
- 32. Jung M, Volonte F, Buchs NC, Gayet‐Ageron A, Pugin F, Gervaz P, Ris F, Morel P. Perirenal fat surface area as a risk factor for morbidity after elective colorectal surgery. Dis Colon Rectum 2014;57:201–9. [DOI] [PubMed] [Google Scholar]
- 33. van Vledder MG, Levolger S, Ayez N, Verhoef C, Tran TC, Ijzermans JN. Body composition and outcome in patients undergoing resection of colorectal liver metastases. Br J Surg 2012;99:550–7. [DOI] [PubMed] [Google Scholar]
- 34. Doyle SL, Bennett AM, Donohoe CL, Mongan AM, Howard JM, Lithander FE, Pidgeon GP, Reynolds JV, Lysaght J. Establishing computed tomography‐defined visceral fat area thresholds for use in obesity‐related cancer research. Nutr Res 2013;33:171–9. [DOI] [PubMed] [Google Scholar]
- 35. Mitsiopoulos N, Baumgartner RN, Heymsfield SB, Lyons W, Gallagher D, Ross R. Cadaver validation of skeletal muscle measurement by magnetic resonance imaging and computerized tomography. J Appl Physiol (1985) 1998;85:115–22. [DOI] [PubMed] [Google Scholar]
- 36. Yoshizumi T, Nakamura T, Yamane M, Islam AH, Menju M, Yamasaki K, Arai T, Kotani K, Funahashi T, Yamashita S, Matsuzawa Y. Abdominal fat: standardized technique for measurement at CT. Radiology 1999;211:283–6. [DOI] [PubMed] [Google Scholar]
- 37. Gomez‐Perez SL, Haus JM, Sheean P, Patel B, Mar W, Chaudhry V, McKeever L, Braunschweig C. Measuring abdominal circumference and skeletal muscle from a single cross‐sectional computed tomography image: a step‐by‐step guide for clinicians using National Institutes of Health ImageJ. JPEN J Parenter Enteral Nutr 2016;40:308–18. [DOI] [PMC free article] [PubMed] [Google Scholar]
- 38. Bland JM, Altman DG. Statistical methods for assessing agreement between two methods of clinical measurement. Lancet 1986;1:307–10. [PubMed] [Google Scholar]
- 39. Shrout PE, Fleiss JL. Intraclass correlations: uses in assessing rater reliability. Psychol Bull 1979;86:420–8. [DOI] [PubMed] [Google Scholar]
- 40. Jaccard P. Étude comparative de la distribution florale dans une portion des alpes et des jura. Bulletin de la Société Vaudoise des Sciences Naturelles 1901;37:547–79. [Google Scholar]
- 41. Sharma P, Zargar‐Shoshtari K, Caracciolo JT, Richard GJ, Poch MA, Pow‐Sang J, Sexton WJ, Spiess PE. Sarcopenia as a predictor of complications in penile cancer patients undergoing inguinal lymph node dissection. World J Urol 2015;33:1585–1592. [DOI] [PubMed] [Google Scholar]
- 42. Wan F, Zhu Y, Gu C, Yao X, Shen Y, Dai B, Zhang S, Zhang H, Cheng J, Ye D. Lower skeletal muscle index and early complications in patients undergoing radical cystectomy for bladder cancer. World J Surg Oncol 2014;12:14. [DOI] [PMC free article] [PubMed] [Google Scholar]
- 43. Miller BS, Ignatoski KM, Daignault S, Lindland C, Doherty M, Gauger PG, Hammer GD, Wang SC. Doherty GM, and University of Michigan Analytical Morphomics G. Worsening central sarcopenia and increasing intra‐abdominal fat correlate with decreased survival in patients with adrenocortical carcinoma. World J Surg 2012;36:1509–16. [DOI] [PubMed] [Google Scholar]
- 44. Kuroki LM, Mangano M, Allsworth JE, Menias CO, Massad LS, Powell MA, Mutch DG, Thaker PH. Pre‐operative assessment of muscle mass to predict surgical complications and prognosis in patients with endometrial cancer. Ann Surg Oncol 2015;22:972–979. [DOI] [PMC free article] [PubMed] [Google Scholar]
- 45. Fairchild B, Webb TP, Xiang Q, Tarima S, Brasel KJ. Sarcopenia and frailty in elderly trauma patients. World J Surg 2014;39:373–379. [DOI] [PMC free article] [PubMed] [Google Scholar]
- 46. Mir O, Coriat R, Blanchet B, Durand JP, Boudou‐Rouquette P, Michels J, Ropert S, Vidal M, Pol S, Chaussade S, Goldwasser F. Sarcopenia predicts early dose‐limiting toxicities and pharmacokinetics of sorafenib in patients with hepatocellular carcinoma. PLoS One 2012;7:e37563:. [DOI] [PMC free article] [PubMed] [Google Scholar]
- 47. Collins J, Noble S, Chester J, Coles B, Byrne A. The assessment and impact of sarcopenia in lung cancer: a systematic literature review. BMJ Open 2014;4:e003697:. [DOI] [PMC free article] [PubMed] [Google Scholar]
- 48. Sabel MS, Lee J, Cai S, Englesbe MJ, Holcombe S, Wang S. Sarcopenia as a prognostic factor among patients with stage III melanoma. Ann Surg Oncol 2011;18:3579–85. [DOI] [PubMed] [Google Scholar]
- 49. Englesbe MJ, Patel SP, He K, Lynch RJ, Schaubel DE, Harbaugh C, Holcombe SA, Wang SC, Segev DL, Sonnenday CJ. Sarcopenia and mortality after liver transplantation. J Am Coll Surg 2010;211:271–8. [DOI] [PMC free article] [PubMed] [Google Scholar]
- 50. Irving BA, Weltman JY, Brock DW, Davis CK, Gaesser GA, Weltman A. NIH ImageJ and Slice‐O‐Matic computed tomography imaging software to quantify soft tissue. Obesity (Silver Spring) 2007;15:370–6. [DOI] [PubMed] [Google Scholar]
- 51. Wu GA, Bogie K. Assessment of gluteus maximus muscle area with different image analysis programs. Arch Phys Med Rehabil 2009;90:1048–54. [DOI] [PubMed] [Google Scholar]
- 52. Strandberg S, Wretling ML, Wredmark T, Shalabi A. Reliability of computed tomography measurements in assessment of thigh muscle cross‐sectional area and attenuation. BMC Med Imaging 2010;10:18. [DOI] [PMC free article] [PubMed] [Google Scholar]
- 53. Dello SA, Stoot JH, van Stiphout RS, Bloemen JG, Wigmore SJ, Dejong CH, van Dam RM. Prospective volumetric assessment of the liver on a personal computer by nonradiologists prior to partial hepatectomy. World J Surg 2011;35:386–92. [DOI] [PMC free article] [PubMed] [Google Scholar]
- 54. Richards CH, Roxburgh CS, MacMillan MT, Isswiasi S, Robertson EG, Guthrie GK, Horgan PG, McMillan DC. The relationships between body composition and the systemic inflammatory response in patients with primary operable colorectal cancer. PLoS One 2012;7:e41883:. [DOI] [PMC free article] [PubMed] [Google Scholar]
- 55. Cruz RJ Jr, Dew MA, Myaskovsky L, Goodpaster B, Fox K, Fontes P, DiMartini A. Objective radiologic assessment of body composition in patients with end‐stage liver disease: going beyond the BMI. Transplantation 2013;95:617–22. [DOI] [PMC free article] [PubMed] [Google Scholar]
- 56. Fortin M, Battie MC. Quantitative paraspinal muscle measurements: inter‐software reliability and agreement using OsiriX and ImageJ. Phys Ther 2012;92:853–64. [DOI] [PubMed] [Google Scholar]
- 57. Shen W, Punyanitya M, Wang Z, Gallagher D, St‐Onge MP, Albu J, Heymsfield SB, Heshka S. Total body skeletal muscle and adipose tissue volumes: estimation from a single abdominal cross‐sectional image. J Appl Physiol (1985) 2004;97:2333–8. [DOI] [PubMed] [Google Scholar]
- 58. von Haehling S, Morley JE, Coats AJS, Anker SD. Ethical guidelines for publishing in the Journal of Cachexia, Sarcopenia and Muscle: update 2015. J Cachexia Sarcopenia Muscle 2015;6:315–6. [DOI] [PMC free article] [PubMed] [Google Scholar]
Associated Data
This section collects any data citations, data availability statements, or supplementary materials included in this article.
Supplementary Materials
Supplementary figure 1. Bland‐Altman 95% limits of agreement plots for the agreement between the various software programs (provided on the X‐axes and Y‐axes) for VAT (cm2). The dotted lines are the mean of the difference and the 95% limits of agreement (±2 SD) between the VAT of reading 1 of observer A and the solid lines of reading 1 of observer B
Supplementary figure 1a. There was proportional systematic bias for both observers (p = 0.004 and p = 0.043, respectively).
Supplementary figure 1b. There was proportional systematic bias for observer A (p = 0.038), but not for observer B (p = 0.154).
Supplementary figure 1c. There was proportional systematic bias for both observers (both p = 0.002).
Supplementary figure 1d. There was proportional systematic bias for observer A (p = 0.045), whereas there was no proportional systematic bias for observer B (p = 0.202).
Supplementary figure 1e. There was no proportional systematic bias for any observer (p = 0.412 and p = 0.114, respectively).
Supplementary figure 1f. There was no proportional systematic bias for observer A (p = 0.068), whereas there was significant bias for observer B (p = 0.014).
Supplementary figure 2. Bland‐Altman 95% limits of agreement plots for the agreement between the various software programs (provided on the X‐axes and Y‐axes) for SAT (cm2). The dotted lines are the mean of the difference and the 95% limits of agreement (±2 SD) between the SAT of reading 1 of observer A and the solid lines of reading 1 of observer B.
Supplementary figure 2a. There was no proportional systematic bias for any observer (p = 0.534 and p = 0.801, respectively).
Supplementary figure 2b. There was no proportional systematic bias for any observer (p = 0.538 and p = 0.112, respectively).
Supplementary figure 2c. There was proportional systematic bias for observer A (p = 0.031), whereas there was no proportional systematic bias for observer B (p = 0.134).
Supplementary figure 2d. There was no proportional systematic bias for any observer (p = 0.853 and p = 0.344, respectively).
Supplementary figure 2e. There was no proportional systematic bias for any observer (p = 0.511 and p = 0.305, respectively).
Supplementary figure 2f. There was no proportional systematic bias for any observer (p = 0.175 and p = 0.939, respectively).
Supplementary figure 3. Jaccard similarity coefficients (lowest and highest are shown) for inter‐observer comparisons of CSMA, VAT, and SAT (cm2) measurements (reading 1 of observer A versus reading 1 of observer B). The green area represents similarity, whereas the red area represents discrepancy in measurements.
Supplementary figure 3a. The CSMA measured with FatSeg (1) and ImageJ (2), resulting in Jaccard similarity coefficients of 0.997 and 0.931, respectively.
Supplementary figure 3b. The VAT measured with FatSeg (1) and OsiriX (2), resulting in Jaccard similarity coefficients of 0.998 and 0.835, respectively.
Supplementary figure 3c. The SAT measured with OsiriX (1) and ImageJ (2), resulting in Jaccard similarity coefficients of 1.000 and 0.899, respectively.
Supplementary figure 4. Jaccard similarity coefficients (lowest and highest are shown) for intra‐observer comparisons of CSMA, VAT, and SAT (cm2) measurements (reading 1 versus reading 2 of observer A). The green area represents similarity, whereas the red area represents discrepancy in measurements.
Supplementary figure 4a. The CSMA measured with FatSeg (1) and OsiriX (2), resulting in Jaccard similarity coefficients of 1.000 and 0.953, respectively.
Supplementary figure 4b. The VAT measured with FatSeg (1) and OsiriX (2), resulting in Jaccard similarity coefficients of 0.999 and 0.838, respectively.
Supplementary figure 4c. The SAT measured with ImageJ (1, 2), resulting in Jaccard similarity coefficients of 1.000 and 0.900, respectively. Furthermore, a Jaccard similarity coefficient of 1.000 was also observed in two other patients measured with FatSeg and OsiriX.
Supplementary figure 5. All worst Jaccard similarity coefficients for the inter‐software (5a), inter‐observer (5b) and intra‐observer (5c) agreement for the three body composition analyses except the ones that are shown in figure 2 and supplementary figures 2 and 3.
Supplementary figure 5a1a. CSMA measured with FatSeg and Image resulting in a Jaccard similarity coefficient of 0.959.
Supplementary figure 5a1b. CSMA measured with FatSeg and OsiriX resulting in a Jaccard similarity coefficient of 0.948.
Supplementary figure 5a1c. CSMA measured with ImageJ and OsiriX resulting in a Jaccard similarity coefficient of0.948.
Supplementary figure 5a1d. CSMA measured with ImageJ and sliceOmatic resulting in a Jaccard similarity coefficient of 0.932.
Supplementary figure 5a1e. CSMA measured with OsiriX and sliceOmatic resulting in a Jaccard similarity coefficient of0.944.
Supplementary figure 5a2a. VAT measured with FatSeg and ImageJ resulting in a Jaccard similarity coefficient of0.903.
Supplementary figure 5a2b. VAT measured with FatSeg and OsiriX resulting in a Jaccard similarity coefficient of 0.886.
Supplementary figure 5a2c. VAT measured with FatSeg and sliceOmatic resulting in a Jaccard similarity coefficient of 0.860.
Supplementary figure 5a2d. VAT measured with ImageJ and OsiriX resulting in a Jaccard similarity coefficient of 0.891.
Supplementary figure 5a2e. VAT measured with OsiriX and sliceOmatic resulting in a Jaccard similarity coefficient of 0.884.
Supplementary figure 5a3a. SAT measured with FatSeg and ImageJ resulting in a Jaccard similarity coefficient of0.968.
Supplementary figure 5a3b. SAT measured with FatSeg and OsiriX resulting in a Jaccard similarity coefficient of 0.926.
Supplementary figure 5a3c. SAT measured with FatSeg and sliceOmatic resulting in a Jaccard similarity coefficient of 0.960.
Supplementary figure 5a3d. SAT measured with ImageJ and OsiriX resulting in a Jaccard similarity coefficient of 0.927.
Supplementary figure 5a3e. SAT measured with ImageJ and sliceOmatic resulting in a Jaccard similarity coefficient of 0.965.
Supplementary figure 5b1a. CSMA measured with FatSeg resulting in a Jaccard similarity coefficient of 0.949.
Supplementary figure 5b1b. CSMA measured with OsiriX resulting in a Jaccard similarity coefficient of 0.931.
Supplementary figure 5b1c. CSMA measured with sliceOmatic resulting in a Jaccard similarity coefficient of 0.939.
Supplementary figure 5b2a. VAT measured with FatSeg resulting in a Jaccard similarity coefficient of 0.908.
Supplementary figure 5b2b. VAT measured with ImageJ resulting in a Jaccard similarity coefficient of 0.905.
Supplementary figure 5b2c. VAT measured with sliceOmatic resulting in a Jaccard similarity coefficient of 0.876.
Supplementary figure 5b3a. SAT measured with FatSeg resulting in a Jaccard similarity coefficient of 0.969.
Supplementary figure 5b3b. SAT measured with OsiriX resulting in a Jaccard similarity coefficient of 0.961.
Supplementary figure 5b3c. SAT measured with sliceOmatic resulting in a Jaccard similarity coefficient of 0.959.
Supplementary figure 5c1a. CSMA measured with FatSeg resulting in a Jaccard similarity coefficient of 0.961.
Supplementary figure 5c1b. CSMA measured with ImageJ resulting in a Jaccard similarity coefficient of 0.948.
Supplementary figure 5c1c. CSMA measured with sliceOmatic resulting in a Jaccard similarity coefficient of 0.961.
Supplementary figure 5c2a. VAT measured with FatSeg resulting in a Jaccard similarity coefficient of 0.916.
Supplementary figure 5c2b. VAT measured with ImageJ resulting in a Jaccard similarity coefficient of 0.891.
Supplementary figure 5c2c. VAT measured with sliceOmatic resulting in a Jaccard similarity coefficient of 0.901.
Supplementary figure 5c3a. SAT measured with FatSeg resulting in a Jaccard similarity coefficient of 0.956.
Supplementary figure 5c3b. SAT measured with OsiriX resulting in a Jaccard similarity coefficient of 0.967.
Supplementary figure 5c3c. SAT measured with sliceOmatic resulting in a Jaccard similarity coefficient of 0.967.
Supporting info item