Abstract
OBJECTIVE
Tumor quantification is essential for determining the clinical efficacy and response to established and evolving therapeutic agents in cancer trials. The purpose of this study was to seek the opinions of oncologists and radiologists about quantitative interactive and multimedia reporting.
SUBJECTS AND METHODS
Questionnaires were distributed to 253 oncologists and registrars and to 35 radiologists at our institution through an online survey application. Questions were asked about current reporting methods, methods for Response Evaluation Criteria in Solid Tumors (RECIST) tumor measurement, and preferred reporting format.
RESULTS
The overall response rates were 43.1% (109/253) for oncologists and 80.0% (28/35) for radiologists. The oncologists treated more than 40 tumor types. Most of the oncologists (65.7% [67/102]) and many radiologists (44.4% [12/27]) (p = 0.020) deemed the current traditional qualitative radiology reports insufficient for reporting tumor burden and communicating measurements. Most of the radiologists (77.8% [21/27]) and oncologists (85.5% [71/83]) (p = 0.95) agreed that key images with measurement annotations helped in finding previously measured tumors; however, only 43% of radiologists regularly saved key images. Both oncologists (64.2% [70/109]) and radiologists (67.9% [19/28]) (p = 0.83) preferred the ability to hyperlink measurements from reports to images of lesions as opposed to text-only reports. Approximately 60% of oncologists indicated that they handwrote tumor measurements on RECIST forms, and 40% used various digital formats. Most of the oncologists (93%) indicated that managing tumor measurements within a PACS would be superior to handwritten data entry and retyping of data into a cancer database.
CONCLUSION
Oncologists and radiologists agree that quantitative interactive reporting would be superior to traditional text-only qualitative reporting for assessing tumor burden in cancer trials. A PACS reporting system that enhances and promotes collaboration between radiologists and oncologists improves quantitative reporting of tumors.
Keywords: productivity, quality improvement, radiology reports, tumor metrics, work flow
The most common form of radiologist report has not changed substantially since the first radiology report in 1896 [1]. Reports remain text only and qualitative and contain a body of findings followed by an impression [2, 3]. Technology is available, however, for media-rich quantitative reporting that includes hyperlinks from measurements of specific lesions to the annotated image and tables and graphs of measurements over time.
Current radiology reports typically provide a few example tumor measurements (e.g., the largest lesions). The image number of the tumor measurement may also be indicated. In addition, an overall impression of metastatic disease burden and the presence or absence of new disease is typically reported. At our institution (NIH Clinical Center), the histories on oncology imaging requests often lack important details that would otherwise allow more precise reporting, including primary tumor type, measurement criteria (e.g., Response Evaluation Criteria in Solid Tumors [RECIST], World Health Organization), and baseline imaging for reference. Subsequent communication gaps and lack of quantification of key tumor deposits lessen the information content of the radiology report and radiologist ethos [4]. As a result, oncologists at our institution undertake separate consultations with radiologists to show them the measurements most relevant to the patient. Considerable time is thus spent in consultation owing to inadequate communication during the initial reporting phase, often resulting in amended reports. One survey [5] showed that referring clinicians asked most radiologists to write addenda to radiology reports on oncology patients because the original reports did not contain measurements.
Advances in PACS technology allow semiautomated tumor measurements that are now integrated with our radiologist reports and provide the capability to find measurements easily, produce tables, make graphs, and manage data. These newer systems include features such as automated lesion identification, tumor segmentation, 2D and volumetric measurements, bookmarking of measurements for ease of navigation, and structured reporting capability. These capabilities, if carefully applied, are expected to substantially improve the quality of radiology reports for oncology patients.
The variety of tumor assessment criteria, measurement techniques, and work flows depend on type of cancer, institution, research study, and the oncology and radiology departments. In a survey of oncologists, Jaffe et al. [6] found that radiology departments could improve tumor reporting to optimize treatment efficacy. However, in a similar survey of radiologists [5], the same authors found that incorporating quantitative measurements and RECIST calculations into radiology reports can be time-consuming, tedious, and often limited in the assessment of tumor burden for oncologists providing patient care.
The purpose of this study was to identify specific reporting needs at our center so that we could help development of a PACS that improves quantification and composition of interactive media-rich reports based on oncologists’ and radiologists’ opinions. We aimed to identify areas in which to improve imaging services and implement new capabilities within the PACS to improve communication between the oncology and radiology departments.
Subjects and Methods
The study design was determined to be exempt from institutional review board oversight. Educational sessions were initially held for oncologists regarding new PACS technologic capabilities. We then used the SurveyMonkey online application to distribute questionnaires to 253 medical and surgical oncologists and oncology registrars (research nurses, oncology fellows) and 35 radiologists at our institution. The survey was developed according to published recommendations for Internet-based survey performance [7]. For example, we included Likert scale questions when appropriate for consistent comparisons. Oncology providers were identified through our radiology information system from imaging ordering histories to identify individuals using imaging services most frequently.
A draft survey was constructed and tested after interviews with several oncologists and radiologists to develop and refine question content. Oncologists and radiologists were asked the tumor measurements they expected from radiologists in a manner similar to that used in another single-institution oncologist survey [8]. Questions in our survey included current satisfaction, expected quantitative measurements and calculations (such as RECIST), use of key images, and opinions on the inclusion of graphs, tables, and hyperlinks from reports to images. Appendixes 1 and 2 show the complete questionnaires.
Newer capabilities, such as semiautomated lesion segmentation (including volumes) and quantified structured reporting within a PACS upgrade (Vue PACS version 12.0, Carestream Health, now installed in our clinical center) were presented to oncologists in conferences and made available online. An example of methods for presentation of tumor measurements, tables, and graphs in our PACS is shown in Figure 1. To detect response bias, we performed a subanalysis with oncologists attending the educational session [9].
Fig. 1.
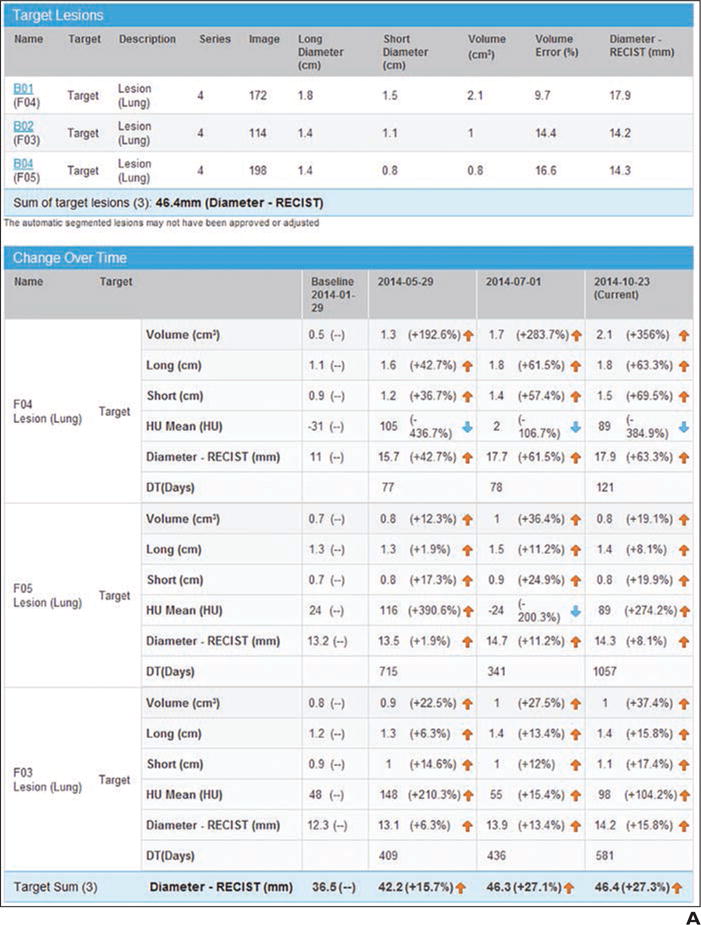
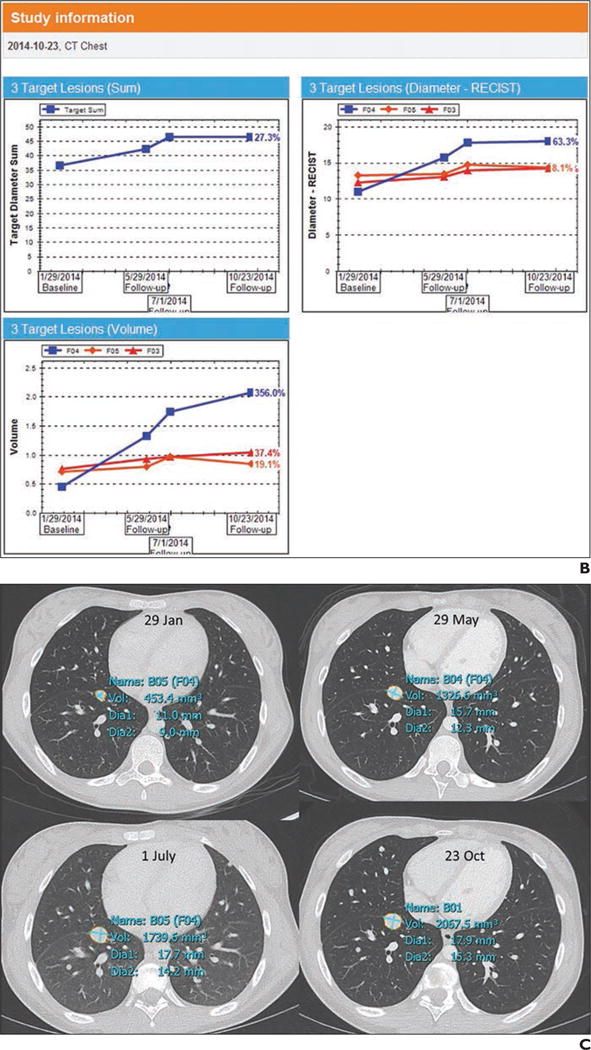
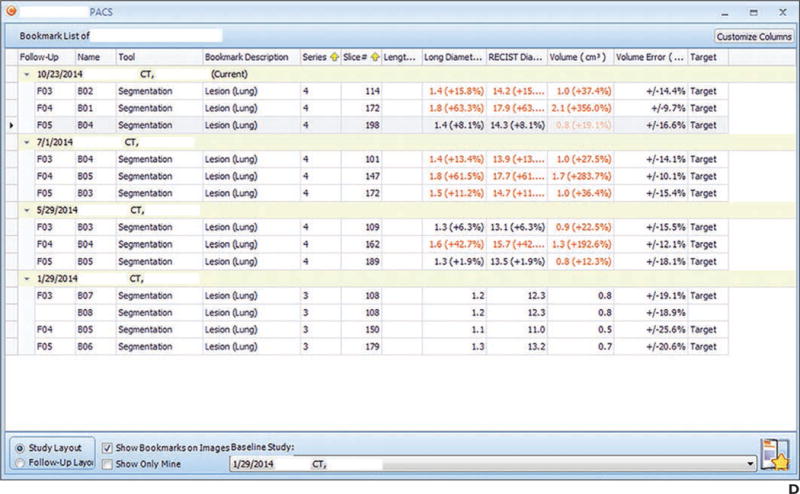
Example of presentation in PACS.
A, Screen shot shows quantitative tumor report generated in PACS. Tumor measurements are automatically exported to report after radiologist obtains measurements.
B, Screen shot shows tumor data tabulated and graphs of tumor trajectory (change in tumor size over time). In this example, tumors became larger during one therapy and then stabilized between time points 3 and 4.
C, Screen shot shows key images saved and their measurement annotations.
D, Screen shot shows bookmark list of measurements and trajectory of each lesion linked to key images.
Our PACS software allows storage and tabulation of measurements directly from DICOM data within the PACS. This feature may obviate handwritten extraction of data from radiology reports followed by manual data entry into the electronic health record and cancer databases.
Survey questions statistically analyzed fell into one of three types: comparison of simple proportions between oncologists and radiologists; comparison of Likert scale (five ordered categories of level of agreement) questions between these groups; or comparison of ordered categories between these groups (e.g., frequency of measurement of tumors). To simplify the reporting of some of the Likert scale questions, the results were often collapsed into a dichotomy (e.g., strongly agree and agree became one category, the other three responses the second category). However, the p values for comparing the two groups were always based on comparing the groups on the five ordered categories by use of the Kruskal-Wallis tests for contingency tables with ordered columns (equivalent to the nonparametric Wilcoxon rank sum test). Proportions were compared by Fisher exact test.
Results
We received 109 responses from the 253 oncologists (response rate, 43%) and 28 responses from the 35 radiologists (response rate, 80%) (p < 0.001). One half of oncology survey respondents were medical oncologists, 10% were surgical oncologists, 18% were research nurses, and 22% were senior oncology fellows. In total, the responding oncologists treated more than 40 primary tumor types (Table 1) and related conditions. Of the radiology respondents to the radiology survey, 47% were body imagers, 21% were neuroradiologists, and 7% were nuclear medicine physicians.
TABLE 1.
Survey Responses Regarding Numbers of Cancers Treated by Oncologists
| Type | Percentage |
|---|---|
|
| |
| Primary | |
| Prostate cancer | 20 |
| Renal cancer | 18 |
| Lymphoma | 16 |
| Small bowel or colon cancer | 14 |
| Lung cancer | 14 |
| Pancreatic cancer | 12 |
| Liver cancer | 12 |
| Pediatric oncology | 11 |
| Breast cancer | 10 |
| Gynecologic cancer | 10 |
| Melanoma | 10 |
| Early stage, phase 1 | 10 |
| Sarcoma | 8 |
| Bladder cancer | 7 |
| Leukemia | 7 |
| Head and neck cancer | 3 |
| Testicular cancer | 3 |
| Othera | |
| Mesothelioma | |
| Multiple myeloma | |
| Thoracic malignancies | |
| Dermatologic malignancies | |
| Endocrine and neuroendocrine tumors | |
| Human papilloma virus–associated cancers | |
| CNS tumors | |
| Adenoid cystic carcinoma | |
| Myeloma | |
| Thymic epithelial tumors | |
| HIV-associated cancers | |
| Kaposi sarcoma | |
| Renal cell carcinoma | |
| Gastrointestinal cancer | |
Additional cancer types not specifically asked about appearing in the comments section of the response “Other cancer types not listed.”
Radiologist Report: History, Content, Format
Oncologists and radiologists were asked to assess the adequacy of the current radiology report for making tumor assessments. Most oncologists agreed (mean score, 3.8 on 5-point Likert agreement scale) that traditional text-only and qualitative reports are not sufficient for assessing tumor burden (Fig. 2). Radiologists also agreed, though not quite so strongly (65.7%; mean score, 3.3 of 5; p = 0.020) that the traditional text-only radiology report is not adequate for oncologists to assess tumor burden.
Fig. 2.

Responses to “Current radiologist report is adequate for making tumor assessments.”
A and B, Graphs show oncologists (A) and radiologists (B) agree that current qualitative reporting systems are inadequate for reporting tumor burden.
Most radiologists found the current clinical history insufficient for effectively selecting and measuring target lesions (44.4%; mean score, 4.1) (Fig. 3). They indicated additional important information that should be provided, such as primary cancer type, assessment criteria, target lesions identified, and baseline or best response date. Most radiologists (87%) were recording tumor measurements in the body of the report. A few included tables and lists (7%) or mentioned the measurements in the impression (7%). Only approximately one half (53%) of the radiologists considered it important for radiology reports to have a consistent and predictable format (mean score, 3.6).
Fig. 3.
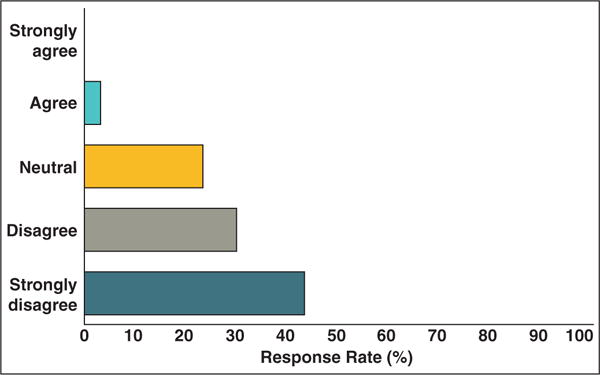
Graph shows responses to “Current clinical history in imaging request is satisfactory for radiologists to provide tumor assessments.”
Tumor Measurements
Oncology and radiology respondents were questioned about how often they measure tumors and target lesions. The daily and weekly frequency of measurements is shown in Figure 4. Most oncologists (87%) measured target lesions on a weekly basis, as did 80% of radiologists. One half of the radiologists indicated they were asked to help measure tumors or lymph nodes for oncologists on a regular basis (30%, 1–5 times weekly; 19%, 1–5 times daily).
Fig. 4.
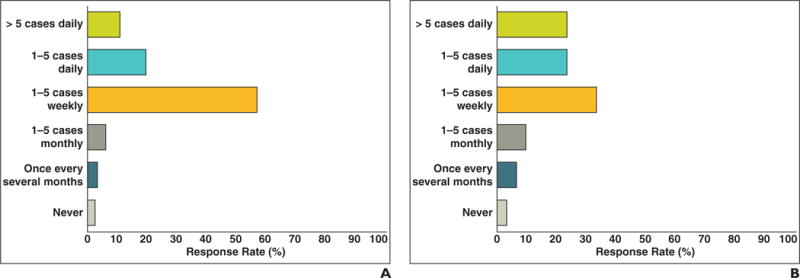
Responses to “How often do you or your team measure tumors?”
A and B, Frequency of oncologist (A) and radiologist (B) measurement of tumor burden. Approximately one half of oncologists and radiologists perform measurements in more than one to five cases weekly, some more than five cases per day.
Most oncologists (75%) thought that target lesion selection and follow-up measurements should be accomplished with multidisciplinary reading sessions (oncologist with radiologist) as opposed to the current situation in which oncologists select and measure target lesions on their own. These responses support collaboration or a system that enhances communication between the oncologists and radiologists when selecting and following target lesions.
Oncologists were asked which tumor assessment criteria they currently use for tumor assessments. Most (59%) of the oncologists used RECIST 1.1, and 27% used RECIST 1.0 (Fig. 5). Other criteria used included World Health Organization, modified RECIST, volumetric analysis, Cheson criteria [10], and immune-related response criteria [11].
Fig. 5.
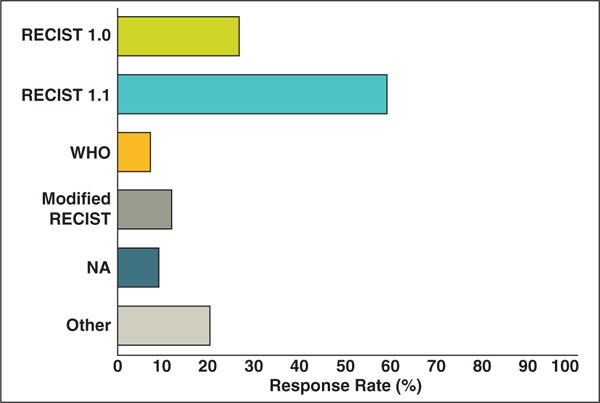
Responses to “Which measurement criteria do you currently use for tumor assessment?” Bar graph shows distribution of tumor assessment criteria oncologist respondents currently use for tumor assessment. Most oncologists (59%) use Response Evaluation Criteria in Solid Tumors (RECIST) 1.1. WHO = World Health Organization, NA = not applicable.
New PACS Capabilities, Key Images, Imaging Services
Oncology and radiology respondents were asked how they would like to have tumor measurements presented in radiologist reports in an upgraded PACS. The preferences are shown in Figure 6. Most of the oncologists (64.2% [70/109]) and radiologists (67.9% [19/28]) (p = 0.83) preferred reports that have measurements hyperlinked to images of lesions. Our radiology department provides an image-processing service (clinical information-processing service) that includes a radiologist and provides tumor measurements for oncologists and creates quantitative reports based on radiologist-defined key images. An interesting finding was that 63% of oncologists were unaware of this service.
Fig. 6.

Responses to “How would you like to have tumor measurements presented in radiologist reports?”
A and B, Oncologist (A) and radiologist (B) preferences for presentation of tumor measurements in radiologist reports. Most (64.2% of oncologists, 67.9% of radiologists) responded that hyperlinks from report to annotated images would be desirable. Approximately one half would like to have graphs and tables included that are possible with our new PACS.
The clinical information-processing service staff and several of our radiologists save key images that include target lesion measurement annotations regarding cancer patients participating in clinical trials. Oncologists’ and radiologists’ opinions concerning key images and their effect on finding measurements and previously measured tumors are shown in Figure 7. Oncologists agreed (85.5%; mean score, 4.18 on 5-point Likert agreement scale) that key images make finding measurements easier. Radiologists also agreed (77.8%; mean score, 4.07; p = 0.95 compared with oncologists) that saving key images with measurement annotations helps find previously measured tumors faster. However, only 43% of radiologists reported that they regularly use the key image capability of the PACS.
Fig. 7.
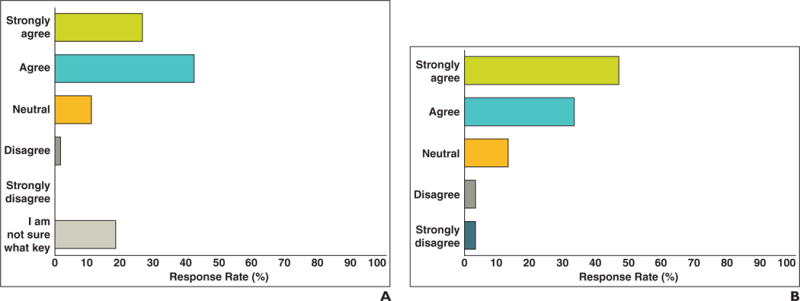
Responses to “Finding tumor measurements is easier when radiologists save key images in PACS that include tumor measurements from previous examinations.” A and B, Oncologist (A) and radiologist (B) responses regarding ease of finding tumor measurements when key image feature is used.
Data Management
When asked how they currently record and manage tumor measurements, oncology respondents were asked to select all that apply. The results showed that 60% of oncologists still handwrite measurements on RECIST forms or handwrite measurements on scrap paper before transferring the information to an electronic RECIST form. When asked what data management system they use for clinical trials, most (81%) of oncologists responded that they use the Cancer Central Clinical Database (C3D) [12]. Other databases included Medidata Rave (Medidata Solutions), InForm (Eclipse), Crimson (The Advisory Board), and external sponsor databases for industry trials.
Most (93%) of the oncologists stated that they would prefer to manage measurements and calculations within the PACS rather than handwriting the measurements and later typing them into both the electronic health record and the cancer database. Seventy-eight percent preferred this method as long as the measurements could be validated, updated, and changed by oncologists.
Additional Comments
We performed a separate subanalysis in which we compared the oncologists who attended the educational session (n = 28) with the oncologists who did not attend (n = 81) and found a few minor differences. For example, 22% of oncologists who did not attend the session were not aware of key images whereas only 7% of oncologists who did attend were not aware of key images. The other differences are shown in Appendix 3. Each questionnaire had several questions providing individualized responses. For example, the last question asked for input on improving radiologist reports and tumor assessment services (such as our clinical information-processing service). Example responses included the need for more quantification in our reports and more combined multidisciplinary sessions with oncologists and radiologists.
Discussion
Traditional radiology reports are largely descriptive, having little standardization of quantitative metrics that are otherwise needed by oncology teams. The survey respondents expressed a desire for information that may not be included in traditional radiology reports, including target tumor measurements and tumor response assessment calculations, such as RECIST. Furthermore, our results indicate a lack of quantification that may be remedied with process improvement and features present in our PACS upgrade.
Radiologist responses indicated lack of adequate clinical histories and assessment criteria to use in imaging requests. Radiologists need the tumor history to provide informative, quantitative oncology reports. For example, histories may include notes as simple as “restaging” or “compare with baseline examination.” Lack of indication of primary cancer type, type of criteria to use, and baseline treatment examination results in inability to provide complete tumor reporting. Lack of tumor information is the start of a communication gap between oncology and radiology that results in incomplete assessments. The incomplete assessments may necessitate additional consultation and tumor measurement. Our results highlight the need for multidisciplinary learning sessions that should close communication gaps while improving collaboration. We have begun implementing these sessions and have had positive responses. We believe that implementation of image-processing advances can increase the speed and efficiency of this process. In particular, a system that enhances collaboration between oncologists and radiologists and allows both to measure, review, and discuss measurements of lesions will enhance both reporting efficiency and accuracy.
Our results show the need to support use of interactive radiology reports that provide quantitative tumor metrics. Tumor tables within the PACS that can be directly imported into oncology databases are inherently feasible but currently do not exist. Preliminary results, however, support systematic management of measurements from a PACS [13]. Such an approach would greatly increase the efficiency of both the radiology and the oncology services. We expect that our initial quantification reports will be separate from our qualitative radiologist reports, which are also seen by the patient, who should not necessarily see indications of tumor progression, according to the results of Travis et al. [14].
The strengths of this study include a fairly large number of survey respondents (109 oncologists, 28 radiologists). In addition, the average level experience of the oncologists and radiologists was more than 5 years in clinical practice. In particular, a high response rate by radiologists (80%) may indicate a potential desire for improvement of radiology services through the reporting process. The oncologist response rate of 43% was approximately double the response to other surveys [6, 8, 14]. The overall good response rates were likely due to high-profile participation of clinical and cancer center leadership in the overall survey process combined with educational sessions regarding PACS and informatics capabilities in radiology. We also carefully identified oncology registrars through CT orders, cancer branches (e.g., medical, surgical, pediatric), and internal networks. Our branch chiefs were enthusiastic about sending and otherwise supporting the survey introductory message and link, followed by two reminders over 1 month. Last, we believe there could have been a form of the Hawthorne effect in that our oncologists were enthusiastic about our interest in obtaining opinions about an important area in need of improvement [15].
There were several limitations to this study. Our results are limited to one clinical center (although across many cancer disciplines) and may not be generalizable to other cancer centers. Although we attempted to match oncologist and radiologist topic areas, some areas are not comparable or are too vague for application of improvements. Our aim was to address oncologists’ needs through a survey directed at imaging services and radiologist reporting before implementation of a PACS native reporting upgrade that includes quantified structured reports. There also was a possibility of response bias of the oncologists who attended the educational session on new PACS capabilities. Our subanalysis comparing them with oncologists who did not attend showed differences. Follow-up survey results would be helpful after implementation of better quantitative reporting methods to determine whether oncology and radiology needs have been adequately met and whether current deficiencies have been addressed.
Conclusion
Tumor quantification is essential for determining clinical efficacy in oncology. There is broad agreement among oncologists and radiologists that traditional radiology reports do not support clinical needs in oncology, supported by our results. Our survey addressed specific areas for mitigating these deficiencies with suggestions and opinions on how to best leverage emerging technologies. These results should be useful in the design of future reporting systems that may include PACS-based semiautomated lesion segmentation, increased quantification with interactive reporting that is more media rich, and enhanced metadata management of lesions.
Acknowledgments
We thank Lisa Krueger for helping with and managing the surveys and Robert Wesley for statistical analysis and expertise.
L. R. Folio has a cooperative research and development agreement with Carestream that includes funding.
Supported by Intramural Research Program, National Institutes of Health Clinical Center. The content is solely the responsibility of the authors and does not necessarily represent the official views of the National Institutes of Health.
APPENDIX 1: Quantitative Oncology Report Survey
Name (for internal tracking purposes only)
- How many years have you been practicing oncology (after training, if complete)?
- I am still in fellowship
- < 5 years
- 5–10 years
- > 10 years
- Your subspecialty (select all that apply)
- Head and neck cancer
- Bladder cancer
- Renal cancer
- Testicular cancer
- Breast cancer
- Small bowel or colon cancer
- Pancreatic cancer
- Liver cancer
- Lung cancer
- Prostate cancer
- Gynecologic cancer
- Melanoma
- Sarcoma
- Lymphoma
- Leukemia
- Early stage, phase 1
- Pediatric oncology
- Other (please specify)
- It is easy to find tumor measurements in radiologists’ reports.
- Strongly agree
- Agree
- Neutral
- Disagree
- Strongly disagree
- How often do you or your team measure tumors?
- More than five cases daily
- One to five cases daily
- One to five cases weekly
- One to five cases monthly
- Once every several months
- Never
- The current radiologist report (text only, minimal quantification) is adequate for making tumor assessments.
- Strongly agree
- Agree
- Neutral
- Disagree
- Strongly disagree
- When radiologists save key images that include tumor measurements in the PACS, it makes finding tumor measurements easier.
- Strongly agree
- Agree
- Neutral
- Disagree
- Strongly disagree
- I am not sure what key images are or have not used them
- Which measurement criteria do you currently use for tumor assessment? (select all that apply)
- RECIST 1.0 (maximum 10 target lesions, up to five per organ)
- RECIST 1.1 (maximum five target lesions, up to two per organ)
- World Health Organization (maximum 10 target lesions, up to five per organ)
- Modified RECIST (Choi, size and attenuation on CT [SACT], volumes, mesothelioma method, other)
- Not applicable (e.g., I do not use measurements for assessment)
- Other (please specify)
- Are you aware that the clinical center radiology and imaging sciences (CRIS) department has a dedicated service to assist you in making tumor measurements and saving and printing key images for your patients? The department is called clinical imaging processing services (CIPS).
- Yes
- No
- Target lesion selection and measurement
- Who currently chooses target lesions?
- Radiologist (only)
- Oncologist and oncology staff (only)
- Radiologist and oncologist together
- Clinical imaging processing services (CIPS)
- Other
- Who should choose target lesions?
- Radiologist (only)
- Oncologist and oncology staff (only)
- Radiologist and oncologist together
- Clinical imaging processing services (CIPS)
- Other
- Who currently measures target lesions?
- Radiologist (only)
- Oncologist and oncology staff (only)
- Radiologist and oncologist together
- Clinical imaging processing services (CIPS)
- Other
- Who should measure target lesions?
- Radiologist (only)
- Oncologist and oncology staff (only)
- Radiologist and oncologist together
- Clinical imaging processing services (CIPS)
- Other
- How often is there a need to change target lesions?
- Commonly
- Sometimes
- Rarely
- Never
- How would you like to have tumor measurements presented in radiologist reports? (select all that apply)
- In the report text (how it is currently done)
- Reports with hyperlinked text linked to select annotated image slices (one clicks on a tumor measurement described in the report, and the link opens that image showing the measurement)
- Tables
- Graphs
- Other (please specify)
- If you selected graphs in question 12, how would you like them presented in the oncology report? (select all that apply)
- A trend line on each tumor over time
- A trend line for the sum of target lesion diameters or other summary measure
- Separate graphs for target and nontarget lesions
- Other (please specify)
- Which previous examinations should be compared with current and follow-up examinations? (select all that apply)
- Most recent previous
- Baseline
- Nadir or best response (scan with lowest sum of diameters)
- None
- Other (please specify)
- How do you currently record tumor measurements? (select all that apply)
- Handwriting on RECIST forms
- Handwriting on scrap paper, then transferred to a RECIST form
- Typing into Microsoft Excel or other spreadsheet (e.g., for calculating or record keeping)
- Typing into Cancer Center Clinical Database (C3D) or other cancer or similar database
- Other (please specify)
- How do you prefer the order of findings in the body of an oncology imaging report? (select all that apply)
- Anatomic from superior (chest) to inferior (pelvis)
- By examination region (chest, abdomen, pelvis)
- List of individual organs (lungs, liver, kidneys, etc.)
- By organ groups (e.g., liver, gallbladder, spleen, pancreas section)
- The most important finding first and then the pertinent negative or stable findings
- A combination of anatomic and most important findings or impression
- Does not matter as long as it is consistent
- Narrative paragraph form without lists or outline
- Other (please specify)
- Which items should be in the radiologist report impression? (select all that apply)
- Whether or not there are new lesions
- Select tumor measurements
- Target lesion measurements
- Disease progression, response or stability
- Clinically significant but unrelated findings
- Clinically significant related findings
- Other (please specify)
- What data management system do you use for clinical trials?
- Cancer Center Clinical Database (C3D)
- Other (please specify)
- When our PACS is upgraded later this year, it will be able to store and tabulate measurements directly from the images, obviating the need to write them down and retype. Provided that clinical center radiology and imaging sciences (CRIS) has a link (or is otherwise integrated) to these and measurements and calculations are easily exported to Cancer Center Clinical Database (C3D) and other databases, would you prefer that measurements and calculations be managed within the PACS in the radiology department?
- Yes
- Yes, provided the measurements are validated by oncology or can be updated or changed
- No
Do you have specific recommendations for improving the radiologist or quantitative oncology report?
APPENDIX 2: Radiologist Survey: Oncology Reporting and Quantitative Tumor Assessment
Name (for internal tracking purposes only)
- Approximately how many years have you been practicing radiology?
- < 5 years
- 5–10 years
- > 10 years
- Your subspecialty (select all that apply)
- Body radiology
- Neuroradiology
- Interventional radiology
- Nuclear medicine
- Other (please specify)
- How often do you measure tumors on CT when reporting?
- More than five cases daily
- One to five cases daily
- One to five cases weekly
- One to five cases monthly
- Once every several months
- Never
- Our current radiologist report is sufficient for oncologists to assess tumor burden (note: this is not addressing clinical content that our radpeer system verifies is meeting the highest standards).
- Strongly agree
- Agree
- Neutral
- Disagree
- Strongly disagree
- Finding tumor measurements is easier when radiologists or the clinical image processing service (CIPS) save key images in the PACS that include tumor measurements from previous examinations.
- Strongly agree
- Agree
- Neutral
- Disagree
- Strongly disagree
- Which measurements do you most often use for metastatic tumors? (select all that apply)
- Longest diameter on axial images
- Short axis on axial images
- Measurement on coronal or other reformatted series
- Volumes
- Other (please specify)
- Which clinical history specifications would be helpful for radiologists when assessing tumors? (select all that apply)
- Primary cancer type
- Target metastatic lesions
- Research protocol number
- Medical conditions
- Response criteria (e.g., World Health Organization, RECIST 1.0 vs 1.1, morphology, attenuation, size, and structure [MASS]) used
- Baseline study date
- Best response study date, primary
- Current clinical history in the imaging request is satisfactory for radiologists to provide tumor assessments.
- Strongly agree
- Agree
- Neutral
- Disagree
- Strongly disagree
- How often do oncologists ask you to help measure tumors or lymph nodes?
- More than five cases daily
- One to five cases daily
- One to five cases weekly
- One to five cases monthly
- Once every several months
- Rarely or never
- How would you like to have tumor measurements—for clinical or response criteria purposes—presented in radiology reports for ease of comparison? (select all that apply)
- Report text (how it is currently done)
- Reports with hyperlinked text, associated with a select image
- Tables
- Graphs
- Other (please specify)
- Tumor assessment reports and reports that include key images, tables of measurements, and graphs should be kept separate from traditional radiology reports.
- Strongly agree
- Agree
- Neutral
- Disagree
- Strongly disagree
- Follow-up CT examinations are common for oncology patients. Which previous examinations do you use most often for comparison? (select all that apply)
- Most recent study
- Baseline study
- Best response study
- Several previous examinations
- Depends on the clinical question
- Other (please specify)
- How do you currently report tumor measurements? (select all that apply)
- In the text of the report body
- In the impression
- In a list or table
- Other (please specify)
- What is your preference on the order of findings in the body of reports? (select all that apply)
- Anatomic from superior (chest or brain) to inferior (pelvis or spine)
- By examination region: head, neck, spine, chest, abdomen, pelvis
- List of individual organs: brain, pharynx, lung, liver, kidneys, spine, etc
- By organ group: e.g., a liver-gallbladder-spleen-pancreas section or head, neck, spine
- The most important finding first and then the pertinent negative or stable findings
- Narrative, paragraph form without lists or outline
- Other (please specify)
- Which items should be in the radiologist report impression? (select all that apply)
- Whether or not there are new lesions
- Select tumor measurements
- Target lesion measurements
- Disease progression, response or stability
- RECIST or other response criteria
- Clinically significant but unrelated findings
- Clinically significant related findings
- Other (please specify)
- How often do you use the key image capability in the PACS?
- More than five cases daily
- One to five cases daily
- One to five cases weekly
- One to five cases monthly
- Once every several months
- Never
- It is important that radiology reports have a consistent, predictable format, as opposed to a unique structure that is determined individually.
- Strongly agree
- Agree
- Neutral
- Disagree
- Strongly disagree
Do you have specific recommendations for improving our oncology reports?
APPENDIX 3: Subanalysis of Oncology Survey Respondents
| Question | Response | Attended Educational Session (n = 28) | Did Not Attend (n = 81) |
|---|---|---|---|
|
| |||
| 6. The current radiologist report is adequate for making tumor assessments. | Disagree or strongly disagree | 67 | 68 |
| 10. Who should choose target lesions? | Radiologists and oncologists together | 68 | 72 |
| 12. How would you like to have tumor measurements presented in radiologist reports? | Reports with hyperlinked text | 68 | 64 |
| 7. When radiologists save key images that include tumor measurements in the PACS, it makes finding tumor measurements easier. | Agree or strongly agree | 75 | 67 |
| 7. When radiologists save key images that include tumor measurements in the PACS, it makes finding tumor measurements easier. | I am not sure what key images are or have not used them | 7 | 22 |
| 15. How do you currently record tumor measurements? | Handwrite on RECIST forms or handwrite on scrap paper then transfer | 64 | 52 |
| 19. Would you prefer measurements and calculations to be managed within the PACS? | Yes or yes provided the measurements are validated by oncology | 82 | 79 |
Note—Results are percentages. RECIST = Response Evaluation Criteria in Solid Tumors.
Footnotes
WEB
This is a web exclusive article.
References
- 1.Röntgen WK. Eine neue Art von Strahlen. Würzburg, Germany: Medicophysical Institute of the University of Würzburg; 1896. [Google Scholar]
- 2.Reiner BI, Knight N, Siegel EL. Radiology reporting, past, present, and future: the radiologist’s perspective. J Am Coll Radiol. 2007;4:313–319. doi: 10.1016/j.jacr.2007.01.015. [DOI] [PubMed] [Google Scholar]
- 3.Danton GH. Radiology reporting: changes worth making are never easy. Appl Radiol. 2010;39:19–23. [Google Scholar]
- 4.Baker SR. The dictated report and the radiologist’s ethos: an inextricable relationship—pitfalls to avoid. Eur J Radiol. 2014;83:236–238. doi: 10.1016/j.ejrad.2013.10.019. [DOI] [PubMed] [Google Scholar]
- 5.Jaffe TA, Wickersham NW, Sullivan DC. Quantitative imaging in oncology patients. Part 1. Radiology practice patterns at major U.S. cancer centers. AJR. 2010;195:101–106. doi: 10.2214/AJR.09.2850. [DOI] [PubMed] [Google Scholar]
- 6.Jaffe TA, Wickersham NW, Sullivan DC. Quantitative imaging in oncology patients. Part 2. Oncologists’ opinions and expectations at major U.S. cancer centers. AJR. 2010;195:W19–W30. doi: 10.2214/AJR.09.3541. [web] [DOI] [PubMed] [Google Scholar]
- 7.Eysenbach G. Improving the quality of web surveys: the checklist for reporting results of internet e-surveys (CHERRIES) J Med Internet Res. 2004;6:e34i. doi: 10.2196/jmir.6.3.e34. [DOI] [PMC free article] [PubMed] [Google Scholar]
- 8.Nayak L, Beaulieu CF, Rubin DL, Lipson JA. A picture is worth a thousand words: needs assessment for multimedia radiology reports in a large tertiary care medical center. Acad Radiol. 2013;20:1577–1583. doi: 10.1016/j.acra.2013.09.002. [DOI] [PubMed] [Google Scholar]
- 9.Furnham A. Response bias, social desirability and dissimulation. Pers Individ Dif. 1986;7:385–400. [Google Scholar]
- 10.Cheson BD, Horning SJ, Coiffier B, et al. Report of an international workshop to standardize response criteria for non-Hodgkin’s lymphomas. J Clin Oncol. 1999;17:1244. doi: 10.1200/JCO.1999.17.4.1244. [DOI] [PubMed] [Google Scholar]
- 11.Wolchok JD, Hoos A, O’Day S, et al. Guidelines for the evaluation of immune therapy activity in solid tumors: immune-related response criteria. Clin Cancer Res. 2009;15:7412–7420. doi: 10.1158/1078-0432.CCR-09-1624. [DOI] [PubMed] [Google Scholar]
- 12.National Cancer Institute website. Cancer biomedical informatics grid: cancer central clinical database (C3D) cabig.nci.nih.gov/community/tools/c3d. Accessed October 17 2014.
- 13.Huang J, Bluemke DA, Zhang X, Summers RM, Folio LR, Yao J. A cross-platform and distributive database system for cumulative tumor measurement. Conf Proc IEEE Eng Med Biol Soc. 2012;2012:1266–1269. doi: 10.1109/EMBC.2012.6346168. [DOI] [PMC free article] [PubMed] [Google Scholar]
- 14.Travis AR, Sevenster M, Ganesh R, Peters JF, Chang PJ. Preferences for structured reporting of measurement data: an institutional survey of medical oncologists, oncology registrars, and radiologists. Acad Radiol. 2014;21:785–796. doi: 10.1016/j.acra.2014.02.008. [DOI] [PubMed] [Google Scholar]
- 15.Landsberger HA. Hawthorne revisited. Ithaca, NY: Cornell University; 1958. [Google Scholar]


