

Abstract
Background
Low blood 25‐hydroxyvitamin D (25(OH)D) concentrations have been associated with cancer in dogs. Little research has examined what other factors may affect 25(OH)D concentrations.
Objectives
(1) To determine whether the presence of cancer (lymphoma, osteosarcoma, or mast cell tumor [MCT]) in dogs is associated with plasma 25(OH)D concentrations and (2) identify other factors related to plasma 25(OH)D concentrations in dogs.
Animals
Dogs newly diagnosed with osteosarcoma (n = 21), lymphoma (n = 27), and MCT (n = 21) presented to a tertiary referral oncology center, and healthy, client‐owned dogs (n = 23).
Methods
An observational study design was used. Dietary vitamin D intake, sex, age, body condition score (BCS), muscle condition score (MCS), and plasma concentrations of 25(OH)D, 24,25‐dihydroxyvitamin D (24,25(OH)2D) (a marker of CYP24A1 activity), as well as ionized calcium (ICa), parathyroid hormone, and parathyroid hormone‐related protein concentrations were measured. An analysis of covariance was used to model plasma 25(OH)D concentrations.
Results
Cancer type (P = 0.004), plasma 24,25(OH)2D concentrations (P < 0.001), and plasma ICa concentrations (P = 0.047) had significant effects on plasma 25(OH)D concentrations. Effects of age, sex, body weight, BCS, MCS, and plasma PTH concentrations were not identified. A significant interaction between ICa and cancer was found (P = 0.005). Plasma 25(OH)D concentrations increased as ICa concentrations increased in dogs with cancer, whereas plasma 25(OH)D concentrations decreased as ICa concentrations increased in healthy dogs.
Conclusions and Clinical Importance
Results support a relationship between cancer and altered vitamin D metabolism in dogs, mediated by plasma ICa concentrations. The CYP24A1 activity and plasma ICa should be measured in studies examining plasma 25(OH)D concentrations in dogs.
Keywords: 24,25‐dihydroxyvitamin D; 25‐hydroxyvitamin D; Lymphoma; Osteosarcoma
Abbreviations
- 24,25(OH)2D
24,25‐dihydroxyvitamin D
- 25(OH)D
25‐hydroxyvitamin D
- BCS
body condition score
- CYP24A1
25‐hydroxy vitamin D‐24‐hydroxylase enzyme
- ICa
ionized calcium
- LSA
lymphoma
- MCS
muscle condition score
- MCT
mast cell tumor
- OSA
osteosarcoma
- PTH
parathyroid hormone
- PTHrP
parathyroid hormone‐related protein
One in 4 dogs will be diagnosed with cancer in their lifetime, and cancer has been reported as the cause of death for almost half of all dogs >10 years of age.1, 2 Similar cancer rates are reported in humans.3 Researchers have acknowledged the important role nutrition may play in cancer development and progression in humans,4, 5, 6 but this area has received little attention in companion animals.
Numerous studies of cancer in humans have focused on vitamin D. The active metabolite of vitamin D, 1,25‐dihydroxyvitamin D (1,25(OH)2D) induces cellular apoptosis and differentiation, inhibits cellular proliferation and metastasis, and enhances DNA repair.7, 8, 9, 10 Studies have linked low 25‐hydroxyvitamin D (25(OH)D) concentrations (the accepted indicator of vitamin D status)11 to increased risk of cancer in humans (eg, breast and prostate cancer).12, 13 These associations found in humans may be applicable to dogs. Several studies have provided supporting evidence, reporting decreased 25(OH)D in dogs with mast cell tumors (MCT), hemangiosarcoma, lymphoma, and neoplastic spirocercosis,14, 15, 16, 17, 18 warranting further research in this area.
Decreased blood 25(OH)D concentrations also have been reported in dogs with several other diseases19, 20, 21; however, a key limitation shared by many of these studies15, 16, 17, 18, 19, 20, 21 is that the study designs did not account for other factors that may influence blood 25(OH)D concentrations, such as dietary vitamin D intake. Importantly, little evidence‐based research exists as to which factors may influence blood 25(OH)D concentrations in the dog.22 Research identifying these factors in healthy dogs and in dogs with disease is needed to inform the design of future studies.
Factors shown to influence blood 25(OH)D concentrations in humans include the following: sex, sex hormone concentrations, age, race, body condition score (BCS), muscle condition score (MCS), dietary vitamin D intake, blood ionized calcium concentrations (ICa), and blood parathyroid hormone concentrations (PTH).23, 24 Additionally, blood concentrations of another vitamin D metabolite, 24,25(OH)2D, have been reported to be much higher in dogs than in other species.25 Thus, activity of the 25‐hydroxyvitamin D‐24‐hydroxylase enzyme (CYP24A1), which is responsible for converting 25(OH)D to 24,25(OH)2D, may be an important factor determining blood 25(OH)D concentrations.
The above factors also may impact 25(OH)D concentrations in dogs with cancer. There is additional merit to measurement of the 24,25(OH)2D metabolite in these dogs because researchers have suggested decreased 25(OH)D concentrations observed in patients with cancer may be caused by up‐regulation of CYP24A1, resulting in increased formation of the excretory metabolite, 24,25‐dihydroxyvitamin D (24,25(OH)2D).14 Furthermore, measurement of blood parathyroid hormone‐related protein (PTHrP), a molecule that acts similarly to PTH that has been shown to be produced by malignant tumors,26 may be relevant when investigating blood 25(OH)D concentrations in dogs with cancer.
The objectives of our study were to: (1) determine whether the presence of 1 of 3 common types of cancer in dogs (lymphoma, osteosarcoma, or MCT) had a significant relationship with plasma 25(OH)D concentrations; and, (2) identify other factors that are significantly related to plasma 25(OH)D concentrations in adult dogs. It was hypothesized that cancer, dietary vitamin D intake, and CYP24A1 activity (using plasma 24,25(OH)2D concentrations as a marker) would have significant relationships (negative, positive and positive, respectively) with plasma 25(OH)D concentrations in dogs.
Materials and Methods
Animals
An observational study design was used. Both healthy dogs and dogs newly diagnosed with cancer were included in the study. Newly diagnosed, client‐owned dogs presented to the Mona Campbell Centre for Animal Cancer at the Ontario Veterinary College's Health Sciences Centre with osteosarcoma (n = 21), lymphoma (n = 27), and MCT (n = 21) were enrolled. Cancer diagnosis was confirmed by cytology, histology or both. Healthy, client‐owned dogs (n = 23) from the Guelph, Ontario area served as controls. Healthy dogs were followed for 1 year after enrollment to ensure continued health during this time. Animals were deemed healthy by normal medical history, physical examination, CBC, and serum biochemical profile. These measures also were performed in the cancer group to ensure absence of any disease states other than cancer. Exclusion criteria were as follows: <2 years of age; receiving corticosteroids within 2 weeks of enrollment; receiving any supplements containing vitamin D, calcium or both; or, clinically relevant systemic or infectious disease (other than cancer in the cancer group). The breed, age, sex, neuter status, body weight, BCS,27 and MCS28 were recorded when the dog was enrolled (Table 1). The experimental protocol was approved by the University of Guelph Animal Care and Use Committee (AUP #1358), by the Royal Canin Ethics Review Committee (#140217_7) and was in accordance with institutional and national guidelines for care and use of animals.
Table 1.
Characteristics of dogs enrolled in the clinical study. Age, body weight, BCS, and MCS are presented as means ± SD
| Healthy | OSA | LSA | MCT | |
|---|---|---|---|---|
| Age (years) | 7.4 ± 2.6 | 8.5 ± 2.4 | 7.3 ± 2.1 | 6.9 ± 2.2 |
| Body Weight (kg) | 32.5 ± 10.3ab | 40.2 ± 14.2a | 28.4 ± 12.3b | 30.9 ± 10.9ab |
| BCS (1–9) | 5.7 ± 1.0 | 5.7 ± 1.1 | 6.0 ± 1.2 | 5.9 ± 1.0 |
| MCS (0–3) | 2.5 ± 0.7 | 2.1 ± 0.7 | 2.6 ± 0.6 | 2.7 ± 0.6 |
| Male/female | 12/11 | 15/6 | 15/12 | 10/11 |
| Breeds |
Doberman pinscher (1) Dogue de Bordeaux (1) Golden retriever (2) Labrador retriever (4) Mastiff (2) Mixed (8) Standard poodle (4) Weimaraner (1) |
Bernese mountain dog (1) Cane Corso (1) Cocker spaniel (1) Doberman pinscher (1) Golden retriever (2) Great pyrenees (1) Greyhound (2) Mastiff (1) Mixed (5) Pharaoh hound (1) Rottweiler (3) Siberian husky (1) Standard poodle (1) |
Airedale terrier (1) Beagle (1) Boston terrier (1) Boxer (1) Bouvier des Flandres (1) Cocker spaniel (2) Dachshund (1) Doberman Pinscher (1) English Setter (1) Golden retriever (3) Labrador retriever (3) Mastiff (1) Mixed (8) Norwegian Buhund (1) West Highland White Terrier (1) |
Bernese mountain dog (1) Boxer (2) Bouvier des Flandres (1) Boston terrier (1) Doberman Pinscher (1) Golden retriever (2) Labrador retriever (6) Mixed (4) Pug (1) Shar Pei (1) Standard poodle (1) |
BCS, body condition score, MCS, muscle condition score.
Superscripts represent statistically significant difference of P ≤ 0.05.
Healthy n = 23, osteosarcoma (OSA) n = 21, lymphoma (LSA) n = 27, mast cell tumor (MCT) n = 21.
Plasma Analysis
Blood samples were collected from patients with cancer (before any treatment) and healthy dogs into lithium heparin tubes and centrifuged at room temperature at 1,500 × g for 7 minutes. Plasma samples were collected and stored at −80°C until analysis. Analysis of 25(OH)D, PTH, PTHrP, and ICa was completed at the Diagnostic Center for Population & Animal Health, Michigan State University, East Lansing, Michigan, USA. 25(OH)D, PTH, and PTHrP were analyzed with commercial RIA kits.1 , 14 ICa was measured by an ion‐sensitive electrode.2 As a marker of CYP24A1 activity, 24,25‐dihydroxyvitamin D (24,25(OH)2D) was analyzed with liquid chromatography tandem mass spectrometry (LC‐MS/MS) at Heartland Assays, Ames, IA, USA.
Dietary Vitamin D Intake
Dietary vitamin D intake information was collected for all dogs enrolled in the study. To obtain the best estimate of each dog's vitamin D intake, owners filled out a dietary questionnaire providing information about the dog's diet for up to 3 months preceding the study. Owners also recorded the type and amount of food fed to the animal in a food log for 7 consecutive days after enrollment and provided a sample of the dog's main diet. Samples were stored in airtight, opaque containers at −80°C until vitamin D3 analysis at the Royal Canin Americas Satellite Laboratory (Guelph, ON, Canada) by LC‐MS/MS method. The results of this analysis were used to calculate each dog's average daily vitamin D intake per kg of metabolic body weight (kg0.75). If a food sample could not be obtained from the owner, then vitamin D information from the manufacturer was used for pet foods, or vitamin D information from the Canadian Nutrient File (http://webprod3.hc-sc.gc.ca/cnf-fce/index-eng.jsp) was used for food consumed by humans.
Statistics
Statistical analysis was completed with SAS software, version 9.3.3 Data were assessed for normality by Shapiro‐Wilk tests. Normality was confirmed for each variable, except plasma 25(OH)D concentrations, and thus, a logarithmic transformation was used on plasma 25(OH)D data before further analysis. Descriptive statistics were completed on age, sex, body weight, BCS, MCS, dietary vitamin D intake, plasma PTH, ICa, 24,25(OH)2D, and 25(OH)D data. Analysis of variance, followed by Tukey‐Kramer post hoc analyses, was used to compare age, body weight, BCS, MCS, plasma PTH, PTHrP, and ICa concentrations among groups.
An initial analysis of covariance (ANCOVA; Plasma 25(OH)D Concentration Model) was used to predict plasma 25(OH)D concentration, with the full model containing the following variables: cancer type (healthy, lymphoma, osteosarcoma, MCT), age, sex, neuter status, body weight, BCS, MCS, daily dietary vitamin D intake, plasma PTH, ICa, and 24,25(OH)2D concentrations, with all possible interactions explored, and quadratics for continuous variables included.
A second ANCOVA was performed to predict plasma 24,25(OH)2D, with the full model containing the following variables: cancer type (healthy, lymphoma, osteosarcoma, and MCT), daily dietary vitamin D intake, age, sex, neuter status, body weight, BCS, MCS, plasma PTH, and ICa concentrations, with all possible interactions explored, and quadratics for continuous variables included.
A P‐value <0.05 was considered significant. Nonsignificant terms were removed from the models; however, hierarchy was preserved (eg, main effects were not removed if involved in a significant interaction that was retained).
Results
Study population characteristics are presented in Table 1. There were no significant differences in body weight, BCS, MCS, and age between healthy dogs and cancer dogs (Table 1). The mean body weight of the osteosarcoma group was significantly higher than that of the lymphoma group (P ≤ 0.05; Table 1). Results of CBC and serum biochemical profiles were unremarkable for all dogs entered into the study. Mean daily dietary vitamin D intake, plasma 25(OH)D, 24,25(OH)2D, ICa, and PTH concentrations are presented in Table 2. A plot of the ICa distribution for each group has been provided as supplementary material (Figure S1). A food sample could not be obtained for 8 dogs, and calculated vitamin D intake for these dogs was based on manufacturer information, Canadian Nutrient File information, or both. Mean plasma 25(OH)D, ICa, and PTH concentrations fell within laboratory reference ranges for each group of dogs (Table 2). Plasma PTHrP concentrations were below the laboratory detection limit of <2.9 pmol/L, except for 1 healthy dog. Therefore, PTHrP was not used as a variable in statistical analysis.
Table 2.
Mean ± SD daily dietary vitamin D intake, plasma 25(OH)D, 24,25(OH)2D, ICa, and PTH concentrations for dogs enrolled in the clinical study
| Reference Range | Healthy | OSA | LSA | MCT | |
|---|---|---|---|---|---|
| Daily dietary vitamin D intake (IU/kg0.75) | n/a | 41 ± 30 | 28 ± 23 | 37 ± 33 | 31 ± 19 |
| 25(OH)D (ng/mL) | 24–86 | 51.3 ± 16.7 | 41.9 ± 20.6 | 41.1 ± 14.4 | 44.9 ± 12.3 |
| 24,25(OH)2D (ng/mL) | n/a | 27.7 ± 10.2 | 21.6 ± 11.1 | 22.9 ± 9.9 | 25.8 ± 8.2 |
| ICa (mmol/L) | 1.25–1.45 | 1.33 ± 0.04 | 1.35 ± 0.05 | 1.33 ± 0.03 | 1.33 ± 0.05 |
| PTH (pmol/L) | 0.5–5.8 | 1.2 ± 0.8 | 1.2 ± 0.6 | 1.6 ± 1.5 | 1.5 ± 1.3 |
25(OH)D, 25‐hydroxyvitamin D; 24,25(OH)2D, 24,25‐dihydroxyvitamin D; ICa, Ionized calcium; PTH, Parathyroid hormone.
Healthy n = 23, osteosarcoma n = 21, lymphoma n = 27, mast cell tumor (MCT) n = 21.
The Plasma 25(OH)D Concentration Model investigated which factors, including cancer type, daily dietary vitamin D intake, age, sex, neuter status, body weight, BCS, MCS, plasma PTH, ICa, and 24,25(OH)2D concentrations, had significant associations with plasma 25(OH)D concentrations. Cancer type (P = 0.004), plasma 24,25(OH)2D concentration (P < 0.001), and plasma ICa (P = 0.047) were significantly related to plasma 25(OH)D concentrations. The model also included a significant interaction between ICa and cancer (P = 0.005). Equations can be found in Table 3. No relationships of age, sex, neuter status, body weight, BCS, MCS, and plasma PTH concentrations were found with plasma 25(OH)D concentrations.
Table 3.
Equations representing the relationship between the independent variables: cancer, dietary vitamin D intake, plasma 24,25(OH)2D, and ionized calcium, and the response variable: plasma 25(OH)D for dogs enrolled in the clinical study
| Plasma 25(OH)D Concentration Model | |
|---|---|
| Healthy | ln(25(OH)D) = 4.9 + 0.06 (24,25D) − 0.0006 (24,25D)2 − 1.6 (ICa) |
| OSA | ln(25(OH)D) = −0.8 + 0.06 (24,25D) − 0.0006 (24,25D)2 + 2.5 (ICa) |
| LSA | ln(25(OH)D) = 1.2 + 0.06 (24,25D) − 0.0006 (24,25D)2 + 1.0 (ICa) |
| MCT | ln(25(OH)D) = 0.5 + 0.06 (24,25D) − 0.0006 (24,25D)2 + 1.5 (ICa) |
OSA, osteosarcoma; LSA, lymphoma; MCT, mast cell tumor; 25(OH)D, 25‐hydroxyvitamin D; ICa, ionized calcium; 24,25D, 24,25‐dihydroxyvitamin D; ln, natural logarithm.
Healthy n = 23, osteosarcoma n = 21, lymphoma n = 27, MCT n = 21.
Equations will result in 25(OH)D values with units of ng/mL. RMSE for Plasma 25(OH)D Concentration Model was 0.1036.
Because there was an interaction between cancer type and plasma ICa concentration, the relationship between cancer and plasma 25(OH)D concentration was dependent on the dog's ionized calcium status. For example, at low plasma ICa concentrations (ie, ICa ≤1.25 mmol/L), dogs with lymphoma (P = 0.015), MCT (P = 0.003), and osteosarcoma (P < 0.001) had significantly decreased plasma 25(OH)D concentrations compared to healthy dogs with the same low plasma ICa concentrations (Fig 1). At mean plasma ICa concentrations (ie, ICa = 1.33 ± 0.07 mmol/L) there were no significant differences in plasma 25(OH)D concentrations among groups (Fig 1). At high plasma ICa concentrations (ie, ICa ≥1.45 mmol/L), dogs with osteosarcoma had significantly higher plasma 25(OH)D concentrations than did healthy dogs (P = 0.003), whereas the lymphoma and MCT groups were not significantly different compared to healthy dogs (respectively, P = 0.157, and P = 0.061).
Figure 1.
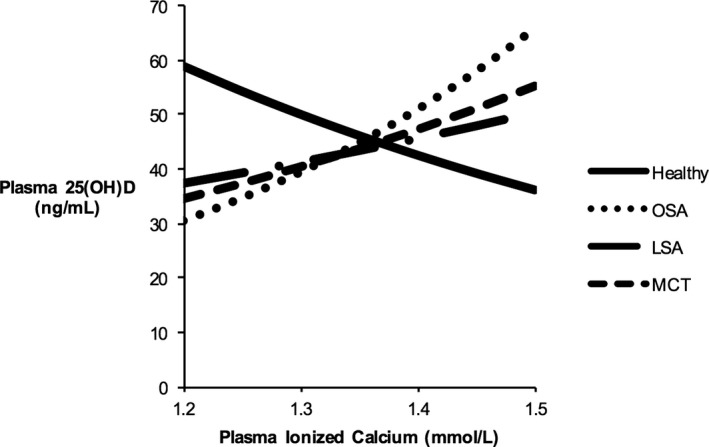
Statistical model of relationship between plasma ICa concentration (mmol/L) and plasma 25(OH)D (ng/mL) concentrations at a plasma 24,25(OH)2D concentration of 24 ng/mL in healthy dogs and those with cancer. RMSE = 0.1036. Healthy n = 23, osteosarcoma (OSA) n = 21, lymphoma (LSA) n = 27, mast cell tumor (MCT) n = 21, 25(OH)D = 25‐hydroxyvitamin D, ICa = ionized calcium.
Plasma 25(OH)D increased logarithmically with increasing plasma 24,25(OH)2D concentrations. This relationship was the same in each group of dogs. Figure 2 shows the relationship between plasma 24,25(OH)2D and 25(OH)D concentrations.
Figure 2.
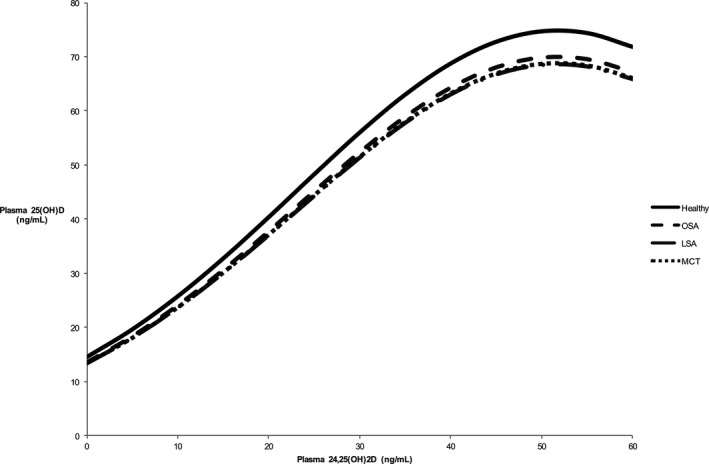
Statistical model of relationship between plasma 24,25(OH)2D concentration (ng/mL) and plasma 25(OH)D (ng/mL) concentrations at a plasma ICa concentration of 1.33 mmol/L in healthy dogs and those with cancer. RMSE = 0.1036. Healthy n = 23, osteosarcoma (OSA) n = 21, lymphoma (LSA) n = 27, mast cell tumor (MCT) n = 21; 25(OH)D = 25‐hydroxyvitamin D, 24,25(OH)2D = 24,25‐dihydroxyvitamin D.
If 24,25(OH)2D was not included in the Plasma 25(OH)D Concentration Model, then dietary vitamin D intake (P = 0.007) had a statistically significant, positive, logarithmic relationship with plasma 25(OH)D concentrations in all groups. However, when 24,25(OH)2D was included in the model, the relationship with dietary vitamin D intake became nonsignificant. To further investigate the relationship among 24,25(OH)2D, 25(OH)D, and dietary intake, a model to predict plasma 24,25(OH)2D was used. Only daily dietary vitamin D intake had a significant relationship with plasma 24,25(OH)2D. This relationship was positive, meaning that as dietary vitamin D intake increased, so did plasma 24,25(OH)2D concentrations.
Discussion
The primary objective of our study was to determine whether cancer (lymphoma, osteosarcoma or MCT) had a significant correlation with plasma 25(OH)D concentrations in dogs. Results support a relationship between cancer (including all 3 types: osteosarcoma, lymphoma, and MCT) and altered vitamin D metabolism in dogs. This relationship seems to be mediated in part by plasma ICa concentrations. Plasma 25(OH)D concentrations increase as ICa concentrations increase in dogs with cancer, whereas plasma 25(OH)D concentrations decrease as ICa concentrations increase in healthy dogs (Fig 1). These changes are not explained by daily dietary vitamin D intake or differences in CYP24A1 activity (when using plasma 24,25(OH)2D concentrations as a marker). Whether these differences in vitamin D metabolism are associated with development of certain cancers or are a consequence of cancer cannot be determined by this study design.
Only cancer patients with low ICa concentrations had significantly decreased plasma 25(OH)D concentrations when compared to healthy dogs in our study. Others reported lower plasma 25(OH)D concentrations in dogs with several cancer types compared to healthy dogs.14, 15, 16, 17 However, this finding could not be confirmed in dogs with osteosarcoma.29 These studies did not include blood ICa concentrations as covariates in the statistical analysis, and direct comparisons between results cannot be made. Although an effect of plasma ICa status on plasma 25(OH)D concentrations makes biological sense (circulating ICa tightly regulates 1,25(OH)2D production30 which may affect 25(OH)D concentrations), no other studies examining correlations between ICa and 25(OH)D concentrations in healthy dogs or in dogs with disease are available. In previous studies, no relationship was found between serum total calcium and serum 25(OH)D concentrations,15 or between serum total calcium and serum 1,25(OH)2D concentrations.17, 18 One study in humans suggested that 25(OH)D plays a modest role in calcium metabolism, independent of 1,25(OH)2D.31 Interestingly, a correlation between increasing dietary calcium intake and decreased serum 25(OH)D concentrations was recently reported in cats.32 No studies examining interactions among cancer, ICa, and 25(OH)D could be found in any species. This finding should be confirmed with a naïve, larger sample size. Most importantly, these results suggest future studies examining plasma 25(OH)D concentrations in dogs, especially those with cancer, should include ICa as a variable.
Our study also aimed to determine whether other factors, including dietary vitamin D intake, age, sex, neuter status, BCS, MCS, and plasma 24,25(OH)2D, ICa, and PTH concentrations had significant relationships with plasma 25(OH)D concentrations in dogs. Dietary vitamin D intake and plasma 24,25(OH)2D concentrations had significant associations with plasma 25(OH)D concentrations, and these relationships were similar in healthy dogs, and dogs with each cancer type.
Although observations in humans and other species,23, 33 showing a strong, positive relationship between dietary vitamin D intake and plasma 25(OH)D concentration in dogs created similar expectations here, this relationship was not observed in the final model for our study because the relationship was masked when 24,25(OH)2D was added into the model. This finding suggests that the highly significant relationship observed between plasma 24,25(OH)2D and 25(OH)D concentrations somehow accounted for the correlation of dietary vitamin D intake. Recently, an association between serum 25(OH)D concentration and the manufacturer or brand of dog food received by the dog was reported.34 Dogs receiving a salmon oil supplement had significantly higher 25(OH)D concentrations than dogs not receiving a supplement in the same study.34 Unfortunately, the vitamin D intake of these dogs was unknown because the vitamin D content of the foods or supplements and the amount of food that the dog consumed were not measured. Previous work suggested that Great Danes are able to upregulate 24,25(OH)2D production in response to higher levels of dietary vitamin D intake.35 This may be true for all dogs, but studies confirming this finding in other breeds are needed. Additionally, 24,25(OH)2D concentrations in dogs appear to be much higher than those reported in humans and other species.25, 36, 37 This observation is most likely a consequence of higher dietary vitamin D intake in dogs through the consumption of commercial dog foods fortified with vitamin D. The relationship between dietary vitamin D intake and plasma 25(OH)D may be harder to quantify in dogs that are receiving amounts of vitamin D over intake requirements. However, we are not aware of studies focused on the shape of the intake‐25(OH)D relationship (ie, whether it is linear or logarithmic) in dogs and determination of this relationship should be a key objective of future studies.
Plasma PTH and PTHrP concentrations were measured to account for other variables that may affect vitamin D metabolism. Although hypercalcemia is common in dogs with lymphoma,26 no lymphoma patients in our study were hypercalcemic. The production of PTHrP is a common cause of humoral hypercalcemia of malignancy.26 Because plasma PTHrP concentrations were below the detection limit in all dogs except 1 healthy dog, the absence of hypercalcemia makes sense. No association between plasma PTH concentrations and plasma 25(OH)D concentrations were observed. In contrast, a significant inverse relationship between serum PTH and serum 25(OH)D has been documented in healthy dogs.15 However, this previous study did not account for the same covariates (eg, ICa) during statistical analysis, which may have affected the results. Two other studies have found no significant association between serum vitamin D metabolites and serum PTH dogs with lymphoma. However, these comparisons were made with serum 1,25(OH)2D concentrations and not serum 25(OH)D concentrations.17, 18
Unlike in humans and other species, age, sex, neuter status, BCS, and MCS were not correlated with plasma 25(OH)D. A trend toward significance for age and no effect of BCS on serum 25(OH)D was found in dogs,14 whereas in humans, increasing age and obesity were associated with decreased serum 25(OH)D status.38, 39, 40 Findings in our study may have been affected by the limited age and BCS characteristics of the study population, because the majority of dogs were older (75% of all dogs ≥6 years old) and 68% of dogs had a BCS of between 4 and 6. The association of sex with blood 25(OH)D concentrations is only described in humans and remains controversial.41, 42, 43, 44 Only 6 of the 92 dogs in our study were intact, which may have limited our ability to detect an association between 25(OH)D and neuter status, but lower 25(OH)D concentrations recently were reported in neutered dogs than in intact dogs.34 Accordingly, the length of time after dogs have been neutered for also may affect 25(OH)D concentrations, but this relationship has not yet been investigated. This information was unavailable to us, but may be worthy of consideration for future research projects. To our knowledge, the effects of MCS on plasma 25(OH)D status have not been reported previously in dogs, probably because MCS guidelines were only introduced recently.45, 46 Although there were no significant findings reported here, future studies designed to specifically investigate effects of these variables are essential to develop a full understanding of vitamin D metabolism in dogs, because findings in other species do not necessarily extrapolate to dogs.
A previous study suggested that a range of 100–120 ng/mL (249.6–299.52 nmol/L) be used to define vitamin D sufficiency in dogs, using a chemiluminesence immunoassay to measure 25(OH)D concentrations.15 A different analysis method (radioimmunoassay) was used here, which may preclude direct comparisons. Still, the mean vitamin D concentrations for the dogs in our study, including the healthy group, would be interpreted as insufficient if compared to this range. Because health was confirmed by physical examination and laboratory findings for the healthy group, further work should be completed to determine vitamin D sufficiency in dogs.
There are several limitations to our study that should be acknowledged. It is possible that owners were not completely accurate when filling out dietary intake records. The study population characteristics (eg, similar BCS and age) may have influenced the ability to examine the influence of those factors on plasma 25(OH)D concentrations and may not be truly reflective of the cancer population of dogs. Groups were not completely breed matched, as this would have required an extensive recruitment process. The possibility of breed‐specific vitamin D metabolism has been discussed,47 specifically in regards to differences in large breed versus small breeds. An effort was made to include similar breed profiles across groups; however, it still is possible that breed differences may have influenced results. Also, our data apply only to skeletally mature dogs because only adult dogs >2 years of age where enrolled in the study. Finally, the control group was only 25% of the entire sample size of dogs with cancer, which is a limitation to the robustness of the comparison between sick and healthy animals.
In conclusion, we observed differences in vitamin D metabolism in healthy dogs compared to those with cancer, mediated by plasma ICa concentration. Differences were not explained by dietary vitamin D intake or plasma 24,25(OH)2D concentrations, but both variables had significant relationships with plasma 25(OH)D concentrations in all groups. These differences are not the same as those found in studies of humans and other species. These findings highlight the need to account for multiple variables that may be correlated with plasma 25(OH)D concentrations in future study designs. Future studies should investigate the variables identified in our study, as well as relevant interactions between variables, in a naïve dog population to confirm these findings.
Funding
Funding for the study was provided by Ontario Veterinary College's Pet Trust, American Academy of Veterinary Nutrition and WALTHAM (AAVN/WALTHAM Research Grant) and Royal Canin SAS.
Supporting information
Figure S1. Box and whisker plot of the distribution of ICa values for each group of dogs enrolled in the clinical study.
Acknowledgment
Conflict of Interest Declaration
Julie Bayle is a paid employee of Royal Canin. Adronie Verbrugghe is the Royal Canin Veterinary Diets Endowed Chair in Canine and Feline Clinical Nutrition at the Ontario Veterinary College.
Off‐label Antimicrobial Declaration
Authors declare no off‐label use of antimicrobials.
Where the work was done: Dogs were enrolled at the Mona Campbell Centre for Animal Cancer at the Ontario Veterinary College's Health Sciences Centre, Guelph, Ontario, Canada. Complete blood count and biochemical profile analyses were completed at the Animal Health Laboratory, University of Guelph, Guelph, Ontario, Canada. 25‐hydroxyvitamin D, parathyroid hormone, parathyroid hormone‐related protein and ionized calcium analyses were completed at the Diagnostic Center for Population & Animal Health, Michigan State University, East Lansing, Michigan, USA. 24,25‐ dihydroxyvitamin D was analyzed at Heartland Assays, Ames, Iowa, USA. Dog foods were analyzed for vitamin D3 content at the Royal Canin Americas Satellite Laboratory, Guelph, Ontario, Canada.
Meeting if any, where the study was presented: The study was presented at European Society of Veterinary & Comparative Nutrition Congress 2014, Utrecht, The Netherlands and the American Academy of Veterinary Nutrition Symposium 2015, Indianapolis, IN, USA.
Footnotes
Notes
Diasorin, Stillwater MN, Scantibodies, Santee CA, Beckman Coulter, Miami, FL
Nova 8 analyzer, Nova Biomedical, Waltham, MA
SAS Institute Inc., Cary, NC
References
- 1. Bronson RT. Variation in age at death of dogs of different sexes and breeds. Am J Vet Res 1982;43:2057–2059. [PubMed] [Google Scholar]
- 2. Adams VJ, Evans KM, Sampson J, Wood JL. Methods and mortality results of a health survey of purebred dogs in the UK. J Small Anim Pract 2010;51:512–524. [DOI] [PubMed] [Google Scholar]
- 3. Canadian Cancer Society's Advisory Committee on Cancer Statistics . Canadian Cancer Statistics 2015. Toronto, ON: Canadian Cancer Society; 2015. [Google Scholar]
- 4. World Cancer Research Fund/American Institute for Cancer Research . Food, Nutrition, Physical Activity, and the Prevention of Cancer: A Global Perspective. Washington, DC: World Cancer Research Fund/American Institute for Cancer Research; 2007. [Google Scholar]
- 5. Kushi LH, Doyle C, McCullough M, et al. American Cancer Society Guidelines on nutrition and physical activity for cancer prevention: Reducing the risk of cancer with healthy food choices and physical activity. CA Cancer J Clin 2012;62:30–67. [DOI] [PubMed] [Google Scholar]
- 6. van Harten‐Gerritsen AS, Balvers MG, Witkamp RF, et al. Vitamin D, inflammation, and colorectal cancer progression: A review of mechanistic studies and future directions for epidemiological studies. Cancer Epidemiol Biomarkers Prev 2015;24:1820–1828. [DOI] [PubMed] [Google Scholar]
- 7. Fleet J, Desmet M, Johnson R, Li Y. Vitamin D and cancer: A review of molecular mechanisms. Biochem J 2012;441:61–76. [DOI] [PMC free article] [PubMed] [Google Scholar]
- 8. Kubis AM, Piwowar A. The new insight on the regulatory role of the vitamin D3 in metabolic pathways characteristic for cancerogenesis and neurodegenerative diseases. Ageing Res Rev 2015;24:126–137. [DOI] [PubMed] [Google Scholar]
- 9. Díaz L, Díaz‐Muñoz M, García‐Gaytán AC, Méndez I. Mechanistic effects of calcitriol in cancer biology. Nutrients 2015;7:5020–5050. [DOI] [PMC free article] [PubMed] [Google Scholar]
- 10. Sintov AC, Yarmolinsky L, Dahan A, Ben‐Shabat S. Pharmacological effects of vitamin D and its analogs: Recent developments. Drug Discov Today 2014;19:1769–1774. [DOI] [PubMed] [Google Scholar]
- 11. Holick MF. Vitamin D: Photobiology, metabolism, and clinical applications In: DeGroot LJ, Besser M, Burger HG, Jameson JL, Loriaux DL, Marshall JC, O'Dell WD, Potts JL, Rubenstein AH, eds. Endocrinology, 3rd ed Philadelphia, PA: WB Saunders; 1995:990–1013. [Google Scholar]
- 12. Garland CF, Gorham ED, Mohr SB, et al. Vitamin D and prevention of breast cancer: Pooled analysis. J Steroid Biochem Mol Biol 2007;103:708–711. [DOI] [PubMed] [Google Scholar]
- 13. Murphy AB, Nyame Y, Martin IK, et al. Vitamin D deficiency predicts prostate biopsy outcomes. Clin Cancer Res 2014;20:2289–2299. [DOI] [PMC free article] [PubMed] [Google Scholar]
- 14. Wakshlag JJ, Rassnick KM, Malone EK, et al. Cross‐sectional study to investigate the association between vitamin D status and cutaneous mast cell tumours in Labrador retrievers. Br J Nutr 2011;106:S60–S63. [DOI] [PubMed] [Google Scholar]
- 15. Selting KA, Sharp CR, Ringold R, et al. Serum 25‐hydroxyvitamin D concentrations in dogs – correlation with health and cancer risk. Vet Comp Oncol 2014;14:295–305. [DOI] [PubMed] [Google Scholar]
- 16. Rosa CT, Schoeman JP, Berry JL, et al. Hypovitaminosis D in dogs with spirocercosis. J Vet Intern Med 2013;27:1159–1164. [DOI] [PubMed] [Google Scholar]
- 17. Gerber B, Hauser B, Reusch CE. Serum levels of 25‐hydroxycholecalciferol and 1,25‐dihydroxycholecalciferol in dogs with hypercalcemia. Vet Res Commun 2004;28:669–680. [DOI] [PubMed] [Google Scholar]
- 18. Rosol TJ, Nagode LA, Couto CG, et al. Parathyroid hormone (PTH)‐related protein, PTH, and 1, 25‐dihydroxyvitamin D in dogs with cancer‐associated hypercalcemia. Endocrinology 1992;131:1157–1164. [DOI] [PubMed] [Google Scholar]
- 19. Gow AG, Else R, Evans H, et al. Hypovitaminosis D in dogs with inflammatory bowel disease and hypoalbuminaemia. J Small Anim Pract 2011;52:411–418. [DOI] [PubMed] [Google Scholar]
- 20. Galler A, Tran JL, Krammer‐Lukas S, et al. Blood vitamin levels in dogs with chronic kidney disease. Vet J 2012;192:226–231. [DOI] [PubMed] [Google Scholar]
- 21. Osuga T, Nakamura K, Morita T, et al. Vitamin D status in different stages of disease severity in dogs with chronic valvular heart disease. J Vet Intern Med 2015;29:1518–1523. [DOI] [PMC free article] [PubMed] [Google Scholar]
- 22. Weidner N, Verbrugghe A. Current knowledge of vitamin D in dogs. Crit Rev Food Sci Nutr 2016. https://doi.org/10.1080/10408398.2016.1171202 [Epub ahead of print]. [DOI] [PubMed] [Google Scholar]
- 23. Del Valle HB, Yaktine AL, Taylor CL, Ross AC, eds. Dietary Reference Intakes for Calcium and Vitamin D. Washington, DC: National Academies Press; 2011. [PubMed] [Google Scholar]
- 24. Nimptsch K, Platz EA, Willett WC, Giovannucci E. Association between plasma 25‐OH vitamin D and testosterone levels in men. Clin Endocrinol 2012;77:106–112. [DOI] [PMC free article] [PubMed] [Google Scholar]
- 25. Spoo JW, Downey RL, Griffitts C, et al. Plasma vitamin D metabolites and C‐reactive protein in stage‐stop racing endurance sled dogs. J Vet Intern Med 2015;29:519–525. [DOI] [PMC free article] [PubMed] [Google Scholar]
- 26. Bergman PJ. Paraneoplastic hypercalcemia. Top Companion Anim Med 2012;27:156–158. [DOI] [PubMed] [Google Scholar]
- 27. Laflamme DP. Development and validation of a body condition score system for dogs. Canine Pract 1997;22:10–15. [Google Scholar]
- 28. Michel KE, Sorenmo K, Shofer FS. Evaluation of body condition and weight loss in dogs presented to a veterinary oncology service. J Vet Intern Med 2004;18:692–695. [DOI] [PubMed] [Google Scholar]
- 29. Willcox JL, Hammett‐Stabler C, Hauck ML. Serum 25‐hydroxyvitamin D concentrations in dogs with osteosarcoma do not differ from those of age‐and weight‐matched control dogs. Vet J 2016;217:132–133. [DOI] [PubMed] [Google Scholar]
- 30. Bushinsky DA, Riera GS, Favus MJ, Coe FL. Evidence that blood ionized calcium can regulate serum 1, 25 (OH) 2D3 independently of parathyroid hormone and phosphorus in the rat. J Clin Invest 1985;76:1599. [DOI] [PMC free article] [PubMed] [Google Scholar]
- 31. Bell NH, Epstein S, Shary J, et al. Evidence of a probable role for 25‐hydroxyvitamin D in the regulation of human calcium metabolism. J Bone Min Res 1988;3:489–495. [DOI] [PubMed] [Google Scholar]
- 32. Paßlack N, Schmiedchen B, Raila J, et al. Impact of increasing dietary calcium levels on calcium excretion and vitamin D metabolites in the blood of healthy adult cats. PLoS One 2016;11:e0149190. [DOI] [PMC free article] [PubMed] [Google Scholar]
- 33. Morris JG, Earle KE, Anderson PA. Plasma 25‐hydroxyvitamin D in growing kittens is related to dietary intake of cholecalciferol. J Nutr 1999;129:909–912. [DOI] [PubMed] [Google Scholar]
- 34. Sharp CR, Selting KA, Ringold R. The effect of diet on serum 25‐hydroxyvitamin D concentrations in dogs. BMC Res Notes 2015;8:442. [DOI] [PMC free article] [PubMed] [Google Scholar]
- 35. Tryfonidou MA, Stevenhagen JJ, Van Den Bemd GJCM, et al. Moderate cholecalciferol supplementation depresses intestinal calcium absorption in growing dogs. J Nutr 2002;132:2644–2650. [DOI] [PubMed] [Google Scholar]
- 36. Horst RL, Littledike ET, Riley JL, Napoli JL. Quantitation of vitamin D and its metabolites and their plasma concentrations in five species of animals. Anal Biochem 1981;116:189–203. [DOI] [PubMed] [Google Scholar]
- 37. Horst RL, Littledike ET. Comparison of plasma concentrations of vitamin D and its metabolites in young and aged domestic animals. Comp Biochem Physiol B 1982;73:485–489. [DOI] [PubMed] [Google Scholar]
- 38. Perry HM, Horowitz M, Morley JE, et al. Longitudinal changes in serum 25‐hydroxyvitamin D in older people. Metabolism 1999;48:1028–1032. [DOI] [PubMed] [Google Scholar]
- 39. Maggio D, Cherubini A, Lauretani F, et al. 25(OH)D serum levels decline with age earlier in women than in men and less efficiently prevent compensatory hyperparathyroidism in older adults. J Gerontol A Biol Sci Med Sci 2005;60:1414–1419. [DOI] [PubMed] [Google Scholar]
- 40. Wortsman J, Matsuoka LY, Chen TC, et al. Decreased bioavailability of vitamin D in obesity. Am J Clin Nutr 2000;72:690–693. [DOI] [PubMed] [Google Scholar]
- 41. Jacques PF, Felson DT, Tucker KL, et al. Plasma 25‐hydroxyvitamin D and its determinants in an elderly population sample. Am J Clin Nutr 1997;66:929–936. [DOI] [PubMed] [Google Scholar]
- 42. Dawson‐Hughes B, Harris SS, Dallal GE. Plasma calcidiol, season, and serum parathyroid hormone concentrations in healthy elderly men and women. Am J Clin Nutr 1997;65:67–71. [DOI] [PubMed] [Google Scholar]
- 43. Hagenau T, Vest R, Gissel TN, et al. Global vitamin D levels in relation to age, gender, skin pigmentation and latitude: An ecologic meta‐regression analysis. Osteoporos Int 2009;20:133–140. [DOI] [PubMed] [Google Scholar]
- 44. Pazaitou‐Panayiotou K, Papapetrou PD, Chrisoulidou A, et al. Height, whole Body Surface Area, gender, working outdoors, and sunbathing in previous summer are important determinants of serum 25‐hydroxyvitamin D levels. Exp Clin Endocrinol Diabetes 2012;120:14–22. [DOI] [PubMed] [Google Scholar]
- 45. Baldwin K, Bartges J, Buffington T, et al. AAHA nutritional assessment guidelines for dogs and cats. J Am Anim Hosp Assoc 2010;46:285–296. [DOI] [PubMed] [Google Scholar]
- 46. Freeman L, Becvarova I, Cave N, et al. WSAVA nutritional assessment guidelines. J Small Anim Pract 2011;52:385–396. [DOI] [PubMed] [Google Scholar]
- 47. Hazewinkel HAW, Tryfonidou MA. Vitamin D3 metabolism in dogs. Mol Cell Endocrinol 2002;197:23–33. [DOI] [PubMed] [Google Scholar]
Associated Data
This section collects any data citations, data availability statements, or supplementary materials included in this article.
Supplementary Materials
Figure S1. Box and whisker plot of the distribution of ICa values for each group of dogs enrolled in the clinical study.