

Abstract
Background
Pulmonary hypertension (PH) is an important clinical entity in dogs. Pulmonary hypertension is generally identified based on echocardiographic findings, but measurement variation of the variables most often used in this context has not been reported.
Objective
To define measurement variation of echocardiographic variables that are used to estimate pulmonary artery pressure.
Animals
Four dogs with subclinical tricuspid valve regurgitation were selected from a hospital population.
Methods
Prospective descriptive study ‐ dogs were subject to repeated echocardiographic examination by 2 operators. Each dog was echocardiographically examined 12 times, once by each operator during mornings and afternoons of 3 nonconsecutive days. Measurement variation was defined by coefficients of variation and by mean square errors (MSE) from ANOVA models. Repeatability coefficients (RC) were calculated from MSE.
Results
Of 50 within‐day, between‐day, and interoperator coefficients of variation (CVs), 37 were less than 10% and 46 were less than 15%. The range of peak velocity of tricuspid valve regurgitation (VTR) VTR was 1.87–3.34 m/s. Analysis of variance revealed a significant effect (P < 0.05) of operator for 7 of 10 measurements. Within‐operator/between‐day/within‐subject and between‐operator/between‐day/within‐subject RCs of VTR were, respectively, 0.3 and 0.6 m/s.
Conclusions and Clinical Importance
With regard to repeatability, VTR is superior to other methods used for echocardiographic estimation of systolic pulmonary artery pressure. When TR is absent, the acceleration time of pulmonary ejection and the acceleration‐to‐ejection time ratio are alternative measures. A change in VTR exceeding 0.3 m/s might be outside the range of expected within‐operator variation.
Keywords: Dog, Echocardiography, Pulmonary hypertension, Tricuspid regurgitation
Abbreviations
- ATPV
acceleration time of right ventricular ejection
- CV
coefficient of variation
- ETPV
right ventricular ejection time
- AT : ET
ratio of acceleration time and ejection time
- MAVD
myxomatous atrioventricular valve disease
- MSE
mean square error
- PAP
pulmonary artery pressure
- PGTR
pressure gradient calculated from peak velocity of tricuspid valve regurgitation
- PH
pulmonary hypertension
- RC
repeatability coefficient
- TR
tricuspid valve regurgitation
- TVD
tricuspid valve dysplasia
- VTR
peak velocity of tricuspid valve regurgitation
- LP
left parasternal transducer site
- RP
right parasternal transducer site
Pulmonary hypertension (PH) is an important clinical entity in the dog.1, 2 Left atrial hypertension, hypoxic vasoconstriction related to respiratory tract disease, congenital cardiovascular shunts, and verminous or idiopathic vascular disease potentially cause canine PH.1, 3, 4, 5, 6 The diagnosis of PH usually is based on echocardiographic estimation of pulmonary artery pressure. While the literature is inconsistent, estimates of systolic pulmonary artery pressure that exceed 36 mmHg have generally been assumed to reflect PH.6, 7, 8 Although the accuracy of the method has recently been questioned,9, 10, 11, 12 systolic pulmonary artery pressure (PAP) is commonly estimated from the peak velocity of tricuspid valve regurgitation (VTR), based on the relationship between the right ventricular‐right atrial pressure difference and VTR defined by the simplified Bernoulli equation. Systolic time intervals, including the acceleration time (AT) of right ventricular ejection, right ventricular ejection time (ET), and the ratio of AT : ET, as well as tricuspid annular plane excursion, might identify PH in dogs that do not have tricuspid valve regurgitation (TR).6, 13
Echocardiography is used extensively in the diagnosis of cardiac disorders and serially obtained echocardiographic data can be used to describe the natural history of disease and to monitor response to treatment. Repeated echocardiographic measurements obtained from healthy individuals are not identical but instead vary because of operator and instrument factors as well as inherent, biological variability of the quantity of interest. The description of measurement variation in healthy subjects, or in diseased, but clinically stable individuals, defines repeatability of the test and can be used to determine the magnitude of change that reflects clinically relevant differences in measurements. Quantification of measurement variation is therefore essential for interpretation of echocardiograms serially obtained from dogs with disease. Some components of measurement variation for selected variables used to echocardiographically estimate PAP have been reported, but repeatability of VTR, the variable most widely used for this purpose has not, nor have components of variation related to operator for ET and AT : ET. Therefore, we sought to evaluate the repeatability of echocardiographic variables used to estimate pulmonary artery pressure or identify the presence of pulmonary hypertension.
Materials and Methods
Animals
This study was approved by the Institutional Animal Care and Use Committee (IACUC) of Virginia Tech. Client‐owned dogs were recruited from the caseload of the veterinary teaching hospital or from those identified during a concurrent echocardiographic investigation that enrolled healthy dogs. Written, informed client consent was obtained before enrollment. Dogs were eligible for inclusion if echocardiography disclosed tricuspid valve regurgitation for which the apparent peak velocity could be defined by continuous‐wave Doppler examination. Dogs were included in the investigation only if they were free of clinical signs and clinically stable as determined by the patient history. Dogs with heart disease were considered stable if the pet owner had not observed a change in clinical status in the 2 months before inclusion. None of the dogs were receiving treatment for cardiac disease. Exclusion criteria included pulmonary stenosis and rapidly progressive disease as determined by history and physical examination. All dogs enrolled in the study were receiving heartworm preventative or had been shown within the last 6 months to be free of Dirofilaria antigenemia by a commercially available ELISA.
Experimental Design
Four dogs underwent repeated echocardiographic examination by 2 operators (JMG and JAA) on both the mornings and afternoons of 3 nonconsecutive days of 1 week. Thus, each dog was echocardiographically evaluated 12 times during the course of the investigation. The sequence of operator for any given dog during any time period—morning or afternoon—was randomly determined.
Echocardiography
Transthoracic echocardiography was performed with an ultrasound unita (Vivid 7; GE‐Medical, Milwaukee, WI) equipped with probes that house multi‐frequency phased‐array transducers. The choice of carrier frequency and variables such as gain, dynamic range, and low‐amplitude filters that determine image characteristics were at the discretion of the operator.
Each subject was gently restrained in right and then left lateral recumbency; sedative agents were not administered. Echocardiographic images were obtained from right and left parasternal transducer sites. Image planes were identified according to the recommendations of the ACVIM.14 Specifically, Doppler spectrograms of right ventricular ejection, TR, and, when present, pulmonary valve regurgitation were recorded. For Doppler evaluation of right ventricular ejection, the pulsed‐wave sample volume was placed at the tips of the open pulmonary valve. The appearance of the resulting spectrogram, as well as the audio signal, was used to optimize the Doppler signal. Doppler recordings of right ventricular ejection were recorded from both right and left parasternal transducer sites. The peak velocity of TR (VTR) was recorded from a left apical transducer site by continuous‐wave Doppler; placement of the continuous‐wave cursor was directed by the appearance of color Doppler mapping. When identified, pulmonary valve regurgitation was recorded by continuous‐wave Doppler using left or right parasternal transducer sites.
Measurements were taken off‐line from digitally recorded images by dedicated measurement softwareb (EchoPAC; GE‐Medical, Milwaukee, WI) and consisted of the average of 5, usually consecutive, cardiac cycles. The operator that performed the examination obtained measurements. During off‐line evaluation, the observer was aware of the identity of the patient, but numerical data were not visible on the screen at the time measurements were made.
Variables obtained from Doppler spectrograms of right ventricular ejection comprised peak velocity and selected systolic time intervals (Fig 1). The latter consisted of AT, defined as the time from beginning of right ventricular ejection until the time of peak velocity, and ET. The ratio AT : ET was calculated. The peak velocity of TR was recorded, and the estimated right ventricular‐right atrial systolic pressure gradient was derived by a simplification of the Bernoulli equation (Fig 2). Peak and end‐diastolic velocities were recorded when pulmonary valve regurgitation was identified.
Figure 1.
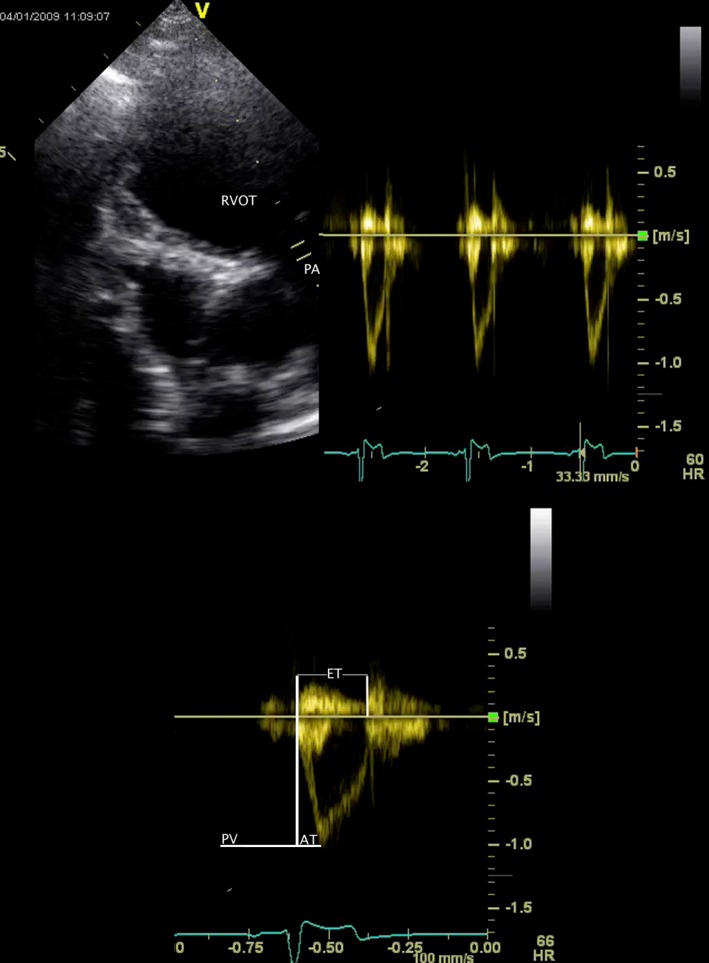
Pulsed‐wave Doppler spectrogram of right ventricular ejection obtained from the left parasternal transducer site (above, right). The two‐dimensional echocardiogram that was used to guide the Doppler cursor is shown at left. A single spectrogram (below) is used to define peak velocity (PV), acceleration time (AT), and ejection time (ET) of right ventricular ejection. The measurement software allows considerable post hoc manipulation of the image. The images from which numerical data were actually obtained were formatted so that the 2D image was smaller and above the Doppler spectra to display an appropriate number of cardiac cycles with optimal temporal resolution. RVOT, subvalvular right ventricular outflow tract; PA, main pulmonary artery.
Figure 2.
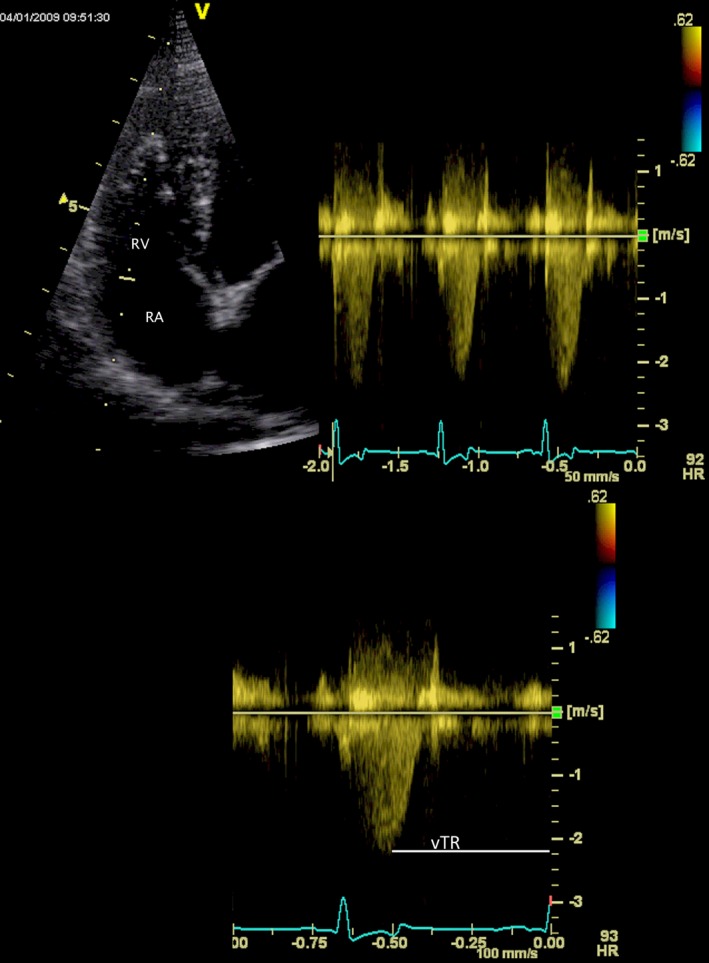
Continuous‐wave Doppler spectrogram of tricuspid valve regurgitation obtained from the left apical transducer site (above, right). The two‐dimensional echocardiogram that was used to guide the Doppler cursor is shown at left. A single spectrogram (below) is used to define peak velocity (VTR). The measurement software allows considerable post hoc manipulation of the image. The images from which numerical data were actually obtained were formatted so that the 2D image was smaller and above the Doppler spectra to display an appropriate number of cardiac cycles with optimal temporal resolution. RA, right atrium; RV, right ventricle.
Statistical Analysis
Coefficients of variation (CV) were calculated to describe within‐day (for each operator), between‐day (also for each operator), and interoperator variation. Fixed effects of operator, day, and time of day were assessed by mixed‐model ANOVA. In addition to the fixed effects, the mixed model included individual dog as a random effect.
To estimate day‐to‐day variation within individual dog and operator, and day‐to‐day/between‐operator variation within individual dog, random‐effects models were developed and used to estimate variance components. Unfortunately, the majority of variance components took negative values or zero, suggesting that the dataset was poorly suited to this approach. Therefore, the mean square error (MSE) from a one‐way mixed‐model ANOVA was used in place of variance components. In both ANOVA models, an average of the 2 measurements taken by 1 operator on a single day was used. For 1 model, the classifying variable was a concatenation of the subject identifier and operator so that the residual MSE described the day‐to‐day variation when a single operator examined the same subject. To describe the day‐to‐day variation when different operators examined the same subject, 6 separate ANOVAs that accounted for the possible combinations of operator and day were performed; for example, data from operator 1 on day 1 were compared to data from operator 2 on day 2, then data from operator 1 on day 1 and operator 2 on day 3, data from operator 1 on day 2, and data from operator 2 on day 3, and so on. The classifying variable was subject identifier and the residual MSE describes day‐to‐day and operator‐to‐operator variation. The 6 resulting MSE were averaged to provide a representative value. From MSE calculated from ANOVA, the repeatability coefficient (RC)15, 16, 17 was calculated:
where σ is the standard deviation derived from the square root of the MSE. The repeatability coefficient takes into account uncertainty of the point estimate as well as uncertainty associated with repeated measurement. RC is an estimate of the limits of the interval in which, with a confidence of 95%, a future measurement will fall assuming no change in the parameter or “true value” of the measured variable. Residual plots were inspected to verify model adequacy. Statistical significance was set α = 0.05. Data are reported as mean (±standard deviation) or median (range).
Results
Three female‐spayed and 1 male‐castrated dog were included in the study. Three of the dogs had myxomatous atrioventricular valve disease, and 1 had tricuspid valve dysplasia. Body weights of the dogs were within the range of 4.8–27 kg. The range of recorded VTR was 1.87–3.34. Pulmonary valve regurgitation was inconsistently recorded resulting in numerous missing observations, and therefore, variables associated with pulmonary valve regurgitation were not subject to analysis. Significant effects of operator, day, or time of day were observed (Table 1). Mixed‐model ANOVA revealed the operator to be a significant source of variation for 7 of 10 measurements. Within‐day, between‐day, and interoperator CV are summarized in Table 2. Of the 50 calculated CVs, the majority, 46, were less than 15% and 37 were less than 10%. All of the CV that exceeded 15% represented interoperator variation. Of all calculated CV, those derived from measurement of VTR were among the lowest; for this variable, within‐day, between‐day, and interoperator CVs all were less than 10%. Within‐day and between‐day CVs for AT, ET, and AT : ET were less than 15%. Repeatability coefficients, estimated standard deviations, and MSEs that, respectively, reflect measurement variation associated with repeated examinations of the same subject by the same operator and repeated examinations of the same subject by different operators on different days are presented in Tables 3 and 4. All RC that reflect variation resulting from day and operator exceed those that reflect day‐to‐day variation within operator.
Table 1.
Significant effects detected by ANOVA for repeated echocardiographic examinations of 4 dogs with tricuspid regurgitation
| Significant Fixed Effect | |
|---|---|
| VPV RP | Operator |
| ATPV RP | Operator |
| ETPV RP | Operator, time of day |
| (AT : ET)PV RP | Operator, day |
| VPV LP | – |
| ATPV LP | Operator |
| ETPV LP | Operator |
| (AT : ET)PV LP | Operator |
| VTR | – |
| PGTR | – |
ATPV, acceleration time of right ventricular ejection; ETPV, right ventricular ejection time; AT : ET, ratio of acceleration time and ejection time; VTR, peak velocity of tricuspid valve regurgitation; PGTR, pressure gradient calculated from peak velocity of tricuspid valve regurgitation.
Table 2.
Coefficients of variation from repeated echocardiographic examinations of 4 dogs with tricuspid regurgitation. Values greater than 10% are in bold type face
| Operator 1 | Operator 2 | Operator 1 | Operator 2 | ||
|---|---|---|---|---|---|
| CV Within‐day (%) | CV Between‐day (%) | CV Between‐operator (%) | |||
| VPV RP | 6.9 | 10.1 | 5.2 | 7.0 | 8.1 |
| ATPV RP | 12.2 | 9.8 | 5.7 | 8.4 | 27.8 |
| ETPV RP | 5.1 | 7.3 | 5.4 | 5.9 | 8.8 |
| (AT : ET)PV RP | 9.7 | 9.1 | 8.0 | 11.4 | 17.9 |
| VPV LP | 6.1 | 4.7 | 7.0 | 6.7 | 11.0 |
| ATPV LP | 7.7 | 12.1 | 7.2 | 6.8 | 30.6 |
| ETPV LP | 5.3 | 4.5 | 4.2 | 6.5 | 6.9 |
| (AT : ET)PV LP | 9.4 | 11.9 | 7.6 | 7.9 | 26.8 |
| VTR | 3.2 | 7.2 | 3.7 | 5.4 | 7.1 |
| PGTR | 6.4 | 14.2 | 7.5 | 10.7 | 14.0 |
CV, coefficients of variation; ATPV, acceleration time of right ventricular ejection; ETPV, right ventricular ejection time; AT : ET, ratio of acceleration time and ejection time; VTR, peak velocity of tricuspid valve regurgitation; PGTR, pressure gradient calculated from peak velocity of tricuspid valve regurgitation.
Table 3.
Variance estimates and repeatability coefficients obtained when the same operator serially obtains echocardiographic variables used to estimate pulmonary artery pressures
| MSE | SD | RC | |
|---|---|---|---|
| VPV RP (m/s) | 0.002 | 0.05 | 0.13 |
| ATPV RP (msec) | 28 | 5 | 14 |
| ETPV RP (msec) | 121 | 11 | 30 |
| (AT : ET) PV RP | 0.001 | 0.04 | 0.1 |
| VPV LP (m/s) | 0.003 | 0.05 | 0.15 |
| ATPV LP (msec) | 21 | 5 | 13 |
| ETPV LP (msec) | 107 | 10 | 29 |
| (AT : ET) PV LP | 0.0007 | 0.03 | 0.07 |
| VTR (m/s) | 0.01 | 0.12 | 0.33 |
MSE, mean squared error; SD, estimated standard deviation; RC, repeatability coefficient; ATPV, acceleration time of right ventricular ejection; ETPV, right ventricular ejection time; AT : ET, ratio of acceleration time and ejection time; VTR, peak velocity of tricuspid valve regurgitation; PGTR, pressure gradient calculated from peak velocity of tricuspid valve regurgitation.
The MSE is an estimate of variance for repeated examinations of the same subject by the same operator. m/s, meters/second; msec, milliseconds.
Table 4.
Variance estimates and repeatability coefficients obtained when different operators serially obtain echocardiographic variables used to estimate pulmonary artery pressures
| MSE | SD | RC | |
|---|---|---|---|
| VPV RP (m/s) | 0.006 | 0.08 | 0.21 |
| ATPV RP (msec) | 319 | 18 | 50 |
| ETPV RP (msec) | 137 | 12 | 32 |
| (AT : ET) PV RP | 0.008 | 0.09 | 0.25 |
| VPV LP (m/s) | 0.004 | 0.06 | 0.18 |
| ATPV LP (msec) | 221 | 15 | 41 |
| ETPV LP (msec) | 233 | 15 | 42 |
| (AT : ET) PV LP | 0.004 | 0.06 | 0.17 |
| VTR (m/s) | 0.05 | 0.22 | 0.61 |
MSE, mean squared error; SD, estimated standard deviation; RC, repeatability coefficient; ATPV, acceleration time of right ventricular ejection; ETPV, right ventricular ejection time; AT : ET, ratio of acceleration time and ejection time; VTR, peak velocity of tricuspid valve regurgitation; PGTR, pressure gradient calculated from peak velocity of tricuspid valve regurgitation.
The MSE is an estimate of variance for repeated examinations of the same subject by different operators on different days. m/s, meters/second; msec, milliseconds.
Discussion
The results of this study define measurement variation of echocardiographic variables that are used to estimate pulmonary artery pressure in dogs. Additionally, the effects of operator and time on these echocardiographic variables were evaluated. Importantly, we described the measurement variation of VTR, which is the variable that has been most often used to estimate PA pressure in published studies and is presumably the variable used most commonly in clinical practice.2, 7, 8, 18 The CVs of VTR were lower than those obtained for AT, ET, or AT : ET. The RCs reported herein provide an estimate of the variation that results from the effects of operator and time and can be used to define the clinical relevance of changes in serially obtained echocardiographic measurements.
Measurement variation was expressed in terms of the CV and RC. The CV has been widely reported as a statistical index of measurement variation, but it is not without limitations. The CV is the standard deviation—a measure of data dispersion—expressed as a proportion of the arithmetic mean of measurements. Because it is a dimensionless index, it has the advantage that CV for different variables can be compared. But the CV is a proportion that is intrinsically related to the mean, which implies that the magnitude of variation increases in relation to the magnitude of the variable in question. In other words, if a CV of 10% suggests that future measurements will vary within a range defined by some multiple of 0.1, the absolute variation would be greater if, for example, the VTR was 4 m/s, as opposed to 2 m/s. This implies a hypothesis—variation is proportional to magnitude of measurement—that generally has not been tested. The CV conveniently allows comparison between results from different investigators and indeed comparison of different variables, but the way in which CV can be used to evaluate the clinical relevance of changes in serially obtained variables is not obvious. It has been stated that a change in a variable that exceeds the CV is “required to demonstrate (disease) progression,”19 but that assertion implies that a magnitude of change of 1 standard deviation, defines the limits of repeatability. But in fact, that range would include only 68% of observations from a normal distribution and does not take into account uncertainty of future prediction. The CV does not relate in an obvious way to the absolute change in a variable that is outside of expected measurement variation. Furthermore, it is not known what constitutes “acceptable” repeatability for echocardiographic examinations when it is expressed as CV. Various limits such as 15% or 20%20, 21, 22 have been proposed, but the basis for these limits and the way that they relate to actual measurements are not clear. CV is reported as it provides consistency with previously published literature and we have also reported RC. The RC takes into account uncertainty in the point estimate and uncertainty of prediction associated with repeated measurement16; it is therefore an estimate of the limits of the interval in which, with a confidence of 95%, a future measurement will fall assuming no change in the “true value” of the measured variable. Our results suggest that a change in serially obtained VTR that exceeds 0.3 m/s when the same dog is examined by the same operator reflects a pathophysiologic change and is outside of expected measurement variation. Similarly, when AT : ET is serially obtained by the same operator, changes that exceed 0.1 are greater than expected based on measurement variation alone and might reflect a clinically relevant change. RC that reflects day‐to‐day measurement variation when a single operator examines the same subject and day‐to‐day measurement variation when different operators examine the same subject are presented in Tables 3 and 4.
Because of differences in study design and the ways in which results have been reported, directly comparable published data are lacking. However, an investigation of Doppler echocardiographic measurement variation that included 6 apparently healthy purebred dogs revealed similar, if somewhat greater, CV for peak velocities of right ventricular ejection.19 In our study, the use of both right and left parasternal transducer sites to obtain systolic time intervals was associated with low CV. The results of an investigation of diagnostic accuracy determined that AT and the AT : ET can be used to identify dogs with PH defined by a TR velocity in excess of 3.1 m/s.6 In our study, AT and AT : ET were associated with within‐day and between‐day CVs of less than 12.2%, but between‐operator CVs of 17.9–27.8%. These data provide evidence of the potential diagnostic utility of AT and AT : ET, but suggest that serial examinations are optimally performed by a single operator. This is reflected by differences in calculated RC; the RC that describes the between‐operator limits of repeatability of AT : ET are more than twice as great as those that describe within‐operator repeatability.
Measurement variation of VTR obtained from animals has not been described. In studies of human echocardiography, the repeatability of tricuspid regurgitation velocity is typically high. This has been documented in pediatric and adult populations and in cases of physiologic tricuspid regurgitation.23, 24, 25 Similarly, the peak velocity of TR was the measurement with the lowest coefficients of variation in our study subjects. In 1 study of newborn babies, the RC for within‐operator measurement of TR was 0.26, which is similar to the result we obtained.23 Of the variables that we evaluated, VTR is the one best suited to serial echocardiographic estimation of PAP. If TR is not present, assessment of AT and AT : ET is reasonable.
This study's limitations include the small sample size of subjects that had different underlying causes of TR. The study protocol provided 48 data points for each echocardiographic measurement. However, this number is consistent with the design of previous studies of echocardiographic variability in dogs, cats, and horses, which have analyzed 29–96 data points for each echocardiographic measurement.19, 21, 26, 27, 28 Although reasonable means were used to ensure that the subjects did not have rapidly progressive disease that would confound interpretation of measurement variation, the possibility of biologic change concurrent with our investigation cannot be excluded. The evaluation of measurement variation in dogs with cardiac diseases, rather than in healthy subjects, does raise questions regarding the stationarity of the data; quite obviously disease can get worse or get better. However, it is accepted that repeatability can be assessed in individuals with cardiac disease provided that they are clinically stable and studies are completed during a relatively short timeframe. There is precedent for this approach as repeatability of selected echocardiographic variables has been evaluated in dogs with mitral valve regurgitation29 and people with other cardiac disorders including tricuspid valve regurgitation.30, 31 The velocity of TR was measured using only 1 transducer site. Although maximum velocities are often recorded from this site, VTR can also be determined using other transducer sites. Inclusion of other transducer sites in the study protocol might have better approximated a “real‐world” clinical examination, and our failure to do so might have falsely reduced indices of repeatability. We did not have a criterion standard measurement against which to compare our data. However, despite investigations that cast doubt on the accuracy of PA pressure estimates from echocardiography,10, 11, 12 this is questionably relevant as TR is widely used for this purpose, and our interest was in measurement variation. Most notably, and this is a limitation of all investigations of measurement variation, the results relate specifically to the echocardiographers who provided data using the methods described here.
Acknowledgments
The authors gratefully acknowledge the contributions of: clients of the Veterinary Teaching Hospital of the Virginia‐Maryland College of Veterinary Medicine who volunteered the use of their pets; Dr. Stephen Werre who provided statistical consultation. This investigation was supported by a grant provided by the Virginia Veterinary Medical Association ‐ Veterinary Memorial Fund.
Conflict of Interest Declaration
Authors declare no conflict of interest.
Off‐label Antimicrobial Declaration
Authors declare no off‐label use of antimicrobials.
This work was carried out at the Virginia Maryland College of Veterinary Medicine (VMCVM), Virginia Tech, Blacksburg,Virginia.
The work was supported by an intramural grant provided by the VMCVM‐Virginia Veterinary Medical Association as stated in acknowledgments.
Preliminary results were presented in abstract form at the 2013 European College of Veterinary Internal Medicine—Companion Animals Congress in Liverpool, United Kingdom.
References
- 1. Borgarelli M, Abbott J, Braz‐Ruivo L, et al. Prevalence and prognostic importance of pulmonary hypertension in dogs with myxomatous mitral valve disease. J Vet Intern Med 2015;29:569–574. [DOI] [PMC free article] [PubMed] [Google Scholar]
- 2. Pyle RL, Abbott J, MacLean H. Pulmonary hypertension and cardiovascular sequelae in 54 dogs. Int J Appl Res Vet Med 2004;2:99–109. [Google Scholar]
- 3. Seibert RL, Maisenbacher HW 3rd, Prosek R, et al. Successful closure of left‐to‐right patent ductus arteriosus in three dogs with concurrent pulmonary hypertension. J Vet Cardiol 2010;12:67–73. [DOI] [PubMed] [Google Scholar]
- 4. Borgeat K, Sudunagunta S, Kaye B, et al. Retrospective evaluation of moderate‐to‐severe pulmonary hypertension in dogs naturally infected with Angiostrongylus vasorum . J Small Anim Pract 2015;56:196–202. [DOI] [PubMed] [Google Scholar]
- 5. Simonneau G, Gatzoulis MA, Adatia I, et al. Updated clinical classification of pulmonary hypertension. J Am Coll Cardiol 2013;62:D34–D41. [DOI] [PubMed] [Google Scholar]
- 6. Schober KE, Baade H. Doppler echocardiographic prediction of pulmonary hypertension in west highland white terriers with chronic pulmonary disease. J Vet Intern Med 2006;20:912–920. [DOI] [PubMed] [Google Scholar]
- 7. Bach JF, Rozanski EA, MacGregor J, et al. Retrospective evaluation of sildenafil citrate as a therapy for pulmonary hypertension in dogs. J Vet Intern Med 2006;20:1132–1135. [DOI] [PubMed] [Google Scholar]
- 8. Kellum HB, Stepien RL. Sildenafil citrate therapy in 22 dogs with pulmonary hypertension. J Vet Intern Med 2007;21:1258–1264. [DOI] [PubMed] [Google Scholar]
- 9. Zhang RF, Zhou L, Ma GF, et al. Diagnostic value of transthoracic Doppler echocardiography in pulmonary hypertension: A meta‐analysis. Am J Hypertens 2010;23:1261–1264. [DOI] [PubMed] [Google Scholar]
- 10. Rich JD, Shah SJ, Swamy RS, et al. Inaccuracy of doppler echocardiographic estimates of pulmonary artery pressures in patients with pulmonary hypertension: Implications for clinical practice. Chest 2011;139:988–993. [DOI] [PubMed] [Google Scholar]
- 11. Janda S, Shahidi N, Gin K, et al. Diagnostic accuracy of echocardiography for pulmonary hypertension: A systematic review and meta‐analysis. Heart 2011;97:612–622. [DOI] [PubMed] [Google Scholar]
- 12. Soydan LC, Kellihan HB, Bates ML, et al. Accuracy of Doppler echocardiographic estimates of pulmonary artery pressures in a canine model of pulmonary hypertension. J Vet Cardiol 2015;17:13–24. [DOI] [PMC free article] [PubMed] [Google Scholar]
- 13. Pariaut R, Saelinger C, Strickland KN, et al. Tricuspid annular plane systolic excursion (TAPSE) in dogs: Reference values and impact of pulmonary hypertension. J Vet Intern Med 2012;26:1148–1154. [DOI] [PubMed] [Google Scholar]
- 14. Thomas WP, Gaber CE, Jacobs GJ, et al. Recommendations for standards in transthoracic two‐dimensional echocardiography in the dog and cat. Echocardiography Committee of the Specialty of Cardiology, American College of Veterinary Internal Medicine. J Vet Intern Med 1993;7:247–252. [DOI] [PubMed] [Google Scholar]
- 15. Bland JM, Altman DG. Measuring agreement in method comparison studies. Stat Methods Med Res 1999;8:135–160. [DOI] [PubMed] [Google Scholar]
- 16. Chinn S. Statistics in respiratory medicine. 2. Repeatability and method comparison. Thorax 1991;46:454–456. [DOI] [PMC free article] [PubMed] [Google Scholar]
- 17. Pinna GD, Maestri R, Torunski A, et al. Heart rate variability measures: A fresh look at reliability. Clin Sci (Lond) 2007;113:131–140. [DOI] [PubMed] [Google Scholar]
- 18. Johnson L, Boon J, Orton EC. Clinical characteristics of 53 dogs with Doppler‐derived evidence of pulmonary hypertension: 1992–1996. J Vet Intern Med 1999;13:440–447. [DOI] [PubMed] [Google Scholar]
- 19. Dukes‐McEwan J, French AT, Corcoran BM. Doppler echocardiography in the dog: Measurement variability and reproducibility. Vet Radiol Ultrasound 2002;43:144–152. [DOI] [PubMed] [Google Scholar]
- 20. Margiocco ML, Bulmer BJ, Sisson DD. Doppler‐derived deformation imaging in unsedated healthy adult dogs. J Vet Cardiol 2009;11:89–102. [DOI] [PubMed] [Google Scholar]
- 21. Simpson KE, Craig Devine B, Gunn‐Moore DA, et al. Assessment of the repeatability of feline echocardiography using conventional echocardiography and spectral pulse‐wave Doppler tissue imaging techniques. Vet Radiol Ultrasound 2007;48:58–68. [DOI] [PubMed] [Google Scholar]
- 22. Chetboul V, Athanassiadis N, Concordet D, et al. Observer‐dependent variability of quantitative clinical endpoints: The example of canine echocardiography. J Vet Pharmacol Ther 2004;27:49–56. [DOI] [PubMed] [Google Scholar]
- 23. Skinner JR, Boys RJ, Heads A, et al. Estimation of pulmonary arterial pressure in the newborn: Study of the repeatability of four Doppler echocardiographic techniques. Pediatr Cardiol 1996;17:360–369. [DOI] [PubMed] [Google Scholar]
- 24. Stephen B, Dalal P, Berger M, et al. Noninvasive estimation of pulmonary artery diastolic pressure in patients with tricuspid regurgitation by Doppler echocardiography. Chest 1999;116:73–77. [DOI] [PubMed] [Google Scholar]
- 25. Lavie CJ, Hebert K, Cassidy M. Prevalence and severity of Doppler‐detected valvular regurgitation and estimation of right‐sided cardiac pressures in patients with normal two‐dimensional echocardiograms. Chest 1993;103:226–231. [DOI] [PubMed] [Google Scholar]
- 26. Chetboul V, Concordet D, Pouchelon JL, et al. Effects of inter‐ and intra‐observer variability on echocardiographic measurements in awake cats. J Vet Med Series A 2003;50:326–331. [DOI] [PubMed] [Google Scholar]
- 27. Schwarzwald CC, Schober KE, Bonagura JD. Methods and reliability of echocardiographic assessment of left atrial size and mechanical function in horses. Am J Vet Res 2007;68:735–747. [DOI] [PubMed] [Google Scholar]
- 28. Buhl R, Ersboll AK, Eriksen L, et al. Sources and magnitude of variation of echocardiographic measurements in normal standardbred horses. Vet Radiol Ultrasound 2004;45:505–512. [DOI] [PubMed] [Google Scholar]
- 29. Serres F, Chetboul V, Gouni V, et al. Diagnostic value of echo‐Doppler and tissue Doppler imaging in dogs with pulmonary arterial hypertension. J Vet Intern Med 2007;21:1280–1289. [DOI] [PubMed] [Google Scholar]
- 30. Vandenberg BF, Ayres RW, Lindower PD, et al. Reproducibility and variability of the amount of tricuspid regurgitation with color Doppler echocardiography. Am J Cardiol 1995;76:198–199. [DOI] [PubMed] [Google Scholar]
- 31. Clark RD, Korcuska K, Cohn K. Serial echocardiographic evaluation of left ventricular function in valvular disease, including reproducibility guidelines for serial studies. Circulation 1980;62:564–575. [DOI] [PubMed] [Google Scholar]