

Abstract
Background
Effects and duration of commonly used protocols for cobalamin (Cbl) supplementation on cellular Cbl deficiency have not been determined in hypocobalaminemic cats.
Hypothesis/Objectives
To evaluate effect of Cbl supplementation on clinical signs, serum and urine methylmalonic acid (MMA) concentrations over 16 weeks.
Animals
Twenty client‐owned hypocobalaminemic cats with enteropathy.
Methods
Prospective study. Serum Cbl and serum and urine MMA concentrations were determined prospectively in cats at enrollment (t0), immediately before (t6), and 4 (t10) and 10 weeks (t16) after 6th Cbl injection (250 μg, IM q 7 days). Clinical signs severity (activity, appetite, vomiting, diarrhea, body weight) graded at each time point and expressed as clinical disease activity score.
Results
Clinical disease activity score decreased during supplementation and increased after treatment discontinuation. Median serum Cbl concentration increased significantly from t0 (111 pmol/L, range 111–212) to t6 (2,332.5 pmol/L, range 123–22,730) (P < 0.01). Values at t10 were 610.5 pmol/L (range, 111–2,527) and 180.5 pmol/L (range, 111–2,262) at t16 (P < 0.01). Median baseline serum MMA concentration (372 μmol/L, range 0.39–147,000) decreased significantly to 1.62 μmol/L (range, 0.18–806) at t6 (P < 0.01) and gradually increased to 5.34 μmol/L (range, 0.13–1,730) at t10 and 189 μmol/L (range, 0.4–983) at t16. Similar, nonsignificant, pattern observed for urine MMA concentration. Serum and urine MMA concentrations had not normalized in 12 and 6 cats, respectively, at t6.
Conclusion and Clinical Importance
The Cbl supplementation protocol used here did not lead to complete normalization of cellular Cbl deficiency in all examined cats, and biochemical improvements were transient.
Keywords: Biochemical, Cellular deficiency, Feline, Vitamin B12
Abbreviations
- Cbl
cobalamin
- CV
coefficient of variation
- MMA
methylmalonic acid
Cobalamin (Cbl), also known as vitamin B12, is a water‐soluble B‐group vitamin and an essential cofactor for nucleic acid synthesis and hematopoiesis. Its absorption requires binding proteins and specific receptors along various parts of the gastrointestinal tract,1 and gastrointestinal disease can lead to Cbl deficiency. In cell metabolism, Cbl is needed as a cofactor for the conversion of methylmalonyl‐CoA to succinyl‐CoA via methylmalonyl‐CoA mutase and for remethylation of homocysteine via methionine synthase. In humans, Cbl deficiency causes a reduction in activity of both of these enzymes, resulting in increases in methylmalonic acid (MMA) and total homocysteine concentrations. Measurement of these metabolites allows assessment of availability of Cbl for cells and is the test of choice to detect Cbl deficiency.2 MMA is often the preferred marker when monitoring responses to Cbl supplementation because homocysteine analysis usually requires special pre‐analytical procedures and concentrations can be influenced by lifestyle factors.2, 3, 4, 5 In cats, undetectable or subnormal Cbl concentrations can also be associated with increased MMA concentrations, but do not correlate with increased homocysteine concentrations.6, 7, 8, 9 Although it is not known when depletion of cellular Cbl stores and increases in MMA levels begin in the course of subnormal serum Cbl concentrations, MMA is currently considered the best indicator of Cbl status in cats.7, 8, 9 Studies examining biochemical Cbl deficiency in cats have focused on serum MMA concentration,7, 8, 9, 10, 11 and urine MMA concentration has been only sporadically reported.6, 12, 13, 14 In humans, a linear relationship exists between serum and urine MMA concentrations.15 In veterinary medicine, comparisons between serum and urine MMA concentrations are lacking.
Parenteral administration of Cbl to cats with subnormal Cbl values is currently considered a routine therapeutic procedure,7, 9, 11, 16 and various doses and dose frequencies have been described. It was initially recommended that cats with subnormal Cbl absorption receive 1,000 μg Cbl parenterally every 2 weeks.6 A more recent supplementation regime suggested 250 μg cyanocobalamin administered parenterally once weekly, for 6 weeks, followed by one dose every 2 weeks, for 6 weeks, and then one dose monthly.17 To our knowledge, the only study that has evaluated the biochemical response to Cbl supplementation used cats with severe hypocobalaminemia (<74 pmol/L; lower limit of the reference range: 214 pmol/L).11 Those cats received 250 μg cyanocobalamin parenterally, once weekly, for 4 weeks, and serum Cbl concentration markedly increased and serum MMA concentration significantly decreased after treatment.11 The most current Cbl supplementation regimen suggests parenteral administration of Cbl, 250 μg once weekly, for 6 weeks, followed by a dose 30 days later and determination of Cbl concentration 30 days after the last injection.1 However, recommendations beyond 4 weeks are empirical and based only on clinical experience. Therefore, the aims of our study were (1) to prospectively evaluate the serum concentrations of Cbl and MMA and the urine concentration of MMA in cats with hypocobalaminemia and clinical signs of gastrointestinal disease before, during, and 4 and 10 weeks after parenteral cyanocobalamin supplementation, once weekly, for 6 weeks, (2) to assess the clinical benefits during and up to 10 weeks after Cbl supplementation, and (3) to determine the correlations between serum Cbl concentration and serum and urine MMA concentrations.
Materials and Methods
Animals and Study Design
This was a prospective study conducted at the Clinic for Small Animal Internal Medicine, Vetsuisse Faculty, University of Zurich, between December 2012 and September 2016. Cats were enrolled in the study based on the following criteria: a history of one or more clinical signs compatible with gastrointestinal disease, which included diarrhea, vomiting, weight loss, and anorexia; a serum Cbl concentration below the reference range (225–1,451 pmol/L)18; and informed owner consent. Concurrent disease was not considered an exclusion criterion if patients exhibited ultrasonographic evidence of a chronic enteropathy (generalized thickening of the muscularis layer of the small intestines)19, 20 in addition to the above‐mentioned clinical signs. Based on previous guidelines,17 all cats were supplemented with cyanocobalamin2 250 μg once weekly IM, for 6 weeks. Baseline samples of serum and urine were collected immediately before the first Cbl injection (t0) and immediately frozen at ‐20°C for later measurement of MMA concentration. Serum and urine samples were collected directly before the 6th Cbl injection (t6) and 4 (t10) and 10 (t16) weeks after the 6th Cbl injection for measurement of serum Cbl concentration. Aliquots were directly frozen at −20°C for later analysis of serum and urine MMA concentrations. All stored samples for MMA measurements were shipped on dry ice to the laboratory, and shipping time did not exceed 15 minutes.
To repeatedly assess the clinical status of cats undergoing Cbl supplementation, anamnestic and clinical findings from each time point (t0–t6, 6 Cbl injection appointments; t10, 4 weeks after the 6th injection; t16, 10 weeks after the 6th injection) were summarized and expressed as a clinical disease activity score, which ranged from 0 to 15. This score was based on the clinical signs used in the feline chronic enteropathy activity index and included level of activity, appetite, weight loss, vomiting, and diarrhea (Table 1).21 The degree of severity for each clinical sign was scored as normal (0 points), mild (1 point), moderate (2 points), or severe (3 points). The study was approved by the Cantonal Veterinary Office of Zurich and conducted in accordance with guidelines established by the Animal Welfare Act of Switzerland (permission no. 211/2012).
Table 1.
Clinical disease activity scoring system
| Score | Activity | Appetite | Weight Loss | Vomiting | Diarrhea |
|---|---|---|---|---|---|
| 0 | Normal | Normal | None | None | Normal feces |
| 1 | Slightly decreased | Slightly decreased | <5% | lx/wk | Softer than normal, small amount of blood/mucus, 2–3x/d |
| 2 | Moderately decreased | Moderately decreased | 5–10% | 2–3x/wk | Very soft, 4–5x/d |
| 3 | Severely decreased | Severely decreased | >10% | >3x/wk | Watery, >5x/d |
Analyses
Serum Cbl concentration was measured with an automated competitive binding chemiluminescence assay.3 The intra‐ and interassay CVs of the Cbl assay were 2.1% and 3.4%, respectively. The reference range for serum Cbl was set at 225–1,452 pmol/L.18 Undetectable Cbl concentrations at inclusion (<111 pmol/L) were truncated to 111 pmol/L for statistical analysis.
All serum and urine MMA levels were analyzed in the Division of Clinical Chemistry of the University Children's Hospital Zurich according to accredited methods. In brief, the samples were supplemented with an internal standard and precipitated, and analysis was performed by liquid chromatography‐tandem mass spectrometry on an Ultimate 3000 XRS UHPLC system4 with a SCIEX5500 mass spectrometer5 by multiple reaction monitoring. The lower limit of quantification for this method was 25 nmol/L in serum and 651 nmol/L in urine. Results for MMA in urine were expressed as mmol MMA per mol creatinine. Creatinine concentrations were determined by a kinetic Jaffe method on a DxC600 clinical chemistry analyzer6 using commercial reagents. The interassay CVs of the analyses were 5.8% for MMA in serum and urine and 2.7% for creatinine in urine.
The reference ranges for MMA in serum and urine in cats were determined as 2.5 to 97.5 percentile of the measurements from 21 clinically healthy cats with normal routine laboratory results and normal serum Cbl concentrations. These reference ranges were 0.12–0.42 μmol/L and 0.22–0.51 mmol/mol creatinine for serum and urine concentrations of MMA, respectively.
Statistical Analysis
A Friedman test followed by a Nemenyi post hoc test was conducted to compare the effect of time on the repeated measures of serum Cbl, serum MMA, and urine MMA values measured at the four time points t0, t6, t10, and t16. A Friedman test was also used to assess changes over time in the clinical disease activity scores (t0–t16). Instead of a post hoc analysis, a second‐order polynomial model was fitted to the clinical disease activity scores to represent the trend over time. A second‐order polynomial model was fitted to the clinical disease activity scores to represent the trend over time. Finally, the relationship between the concentrations of serum Cbl, serum MMA, and urine MMA were evaluated by Spearman rank correlations. All statistical analyses and data visualization were performed by statistical software7 and graphing software.8
Results
Animals
Serum concentration of Cbl was measured in 543 cats during the study period, and the results of 201 (37%) were below the reference range. Although the owners of 48 cats were willing to participate in the study, only the results of 20 cats were complete and fulfilled the inclusion criteria. Cats were excluded when serum and/or urine samples were missing from different time points or when the Cbl supplementation regimen was not carried out according to the study design. Breeds included European Shorthair (16/20), Neva Masquerade (1/20), Siamese (1/20), Birman (1/20), and Burmese (1/20) cats. The median age was 14 years (7.5–18), median body weight was 3.28 kg (1.85–4.4), and median body condition score was 3 (2–5). Clinical signs present at the time of enrollment into the study were weight loss (19/20), vomiting (16/20), lethargy (12/20), anorexia (12/20), and small bowel diarrhea (9/20).
Clinicopathologic Evaluation
After obtaining a clinical history, all cats underwent a physical examination and laboratory testing including a CBC, serum biochemistry panel, and urinalysis. Serum thyroxine concentration was measured in 18 cats, and four cats were diagnosed with hyperthyroidism. All cats were evaluated for pancreatitis by the DGGR‐lipase activity assay;22 4 of 20 cats had minimally elevated values (28, 32, 32, and 34 U/L; reference range, 8–26 U/L) with unclear significance, and one cat had a value of 73 U/L, which was considered diagnostic for pancreatitis.23 Serum trypsinogen‐like immunoreactivity (fTLI)9 was measured in all 20 cats, and none had values that were diagnostic (<8 μg/L) or suspicious (8–12 μg/L) of exocrine pancreatic insufficiency. All cats had been routinely dewormed (16/20) or had negative fecal analysis results (4/20).
Abdominal ultrasonography carried out in 17 of 20 cats at the time of presentation showed abnormal intestinal findings in 15. Diffuse thickening of the muscularis layer of the small intestines was seen in 11, mesenteric lymphadenopathy in 10, and generalized hyperechoicity of the mucosal layer of the small intestines in 3 of the 15 cats. Histologic examination of the intestines was performed in nine cats after collection of full‐thickness biopsy specimens during surgery (4), endoscopic biopsy specimens (3), and specimens during postmortem examination (4).
Definitive and Tentative Diagnoses
A definitive diagnosis of gastrointestinal tract disease was available in 9 of 20 cats and comprised inflammatory enteropathy (4), intestinal lymphoma (4; three small cell and one large cell lymphoma), and pancreatitis (1). Chronic enteropathy was strongly suspected in the 11 remaining cats based on clinical signs, low serum Cbl concentration, and compatible ultrasonographic features of the intestines, but was not confirmed histologically. Concurrent hyperthyroidism was diagnosed in four cats (three suspected of having enteropathy, one with inflammatory enteropathy confirmed on histologic examination). The four cats with concurrent hyperthyroidism also had biochemical evidence of Cbl deficiency with increased serum MMA concentration in all cats (median 75.5 μmol/L, range 0.45–1,160) and increased urine MMA concentration in 3 (median 0.17 mmol/mol creatinine, range 0.08–3.88). Two cats had concurrent chronic kidney disease, which was stage 2 (serum creatinine, 172 μmol/L) in one cat and stage 3 (serum creatinine, 265 μmol/L; reference range 98–163 μmol/L) in the other, based on the International Renal Interest Society staging system.
Treatment
Treatment differed among cats and included dietary changes (7/20), probiotics (7/20), prednisolone (7/20), transdermal methimazole24 (4), chlorambucil (3/20), and antibiotics (3/20).
Concentrations of Serum Cbl, Serum MMA, and Urine MMA
Serum Cbl concentration (Fig 1) differed significantly over time (χ2 44.68, P < 0.001). There was a significant increase (P < 0.01) in the median serum Cbl concentration from 111 pmol/L (range, 111–212) at t0 to 2332.5 pmol/L (range, 123–22,730) at t6, followed by a nonsignificant (P = 0.49) decrease at t10 (median, 610.5 pmol/L, range, 111–2,527) and a significant decrease (P < 0.01) 10 weeks after the end of supplementation (t16; median, 180.5 pmol/L, range, 111–2,262). At t6, serum Cbl concentrations had normalized in 19 of 20 cats. At t10 and t16, serum Cbl concentration remained within the reference range in 16 of 20 (80%) and 9 of 20 (45%) cats, respectively.
Figure 1.
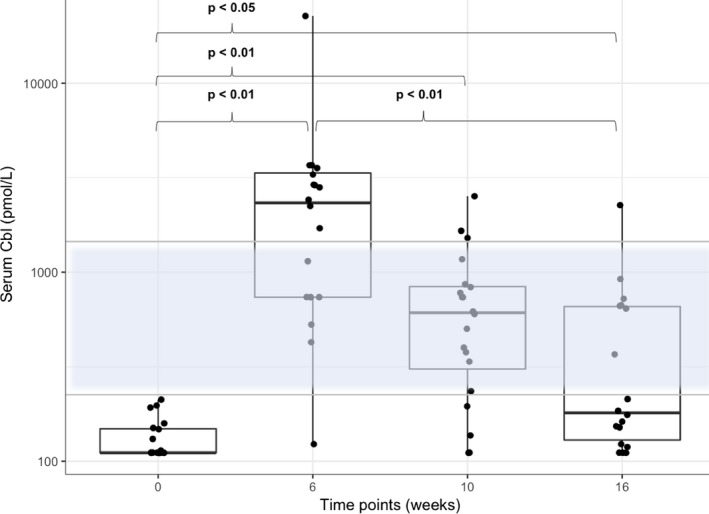
Combined box and scatter plot for serum Cbl concentration on a log‐scale. By the Tukey method, boxes represent median and IQR and whiskers outliers (values up to 75th percentile + 1.5 IQR). The reference range for serum Cbl concentration is indicated as a transparent blue area with an upper and lower horizontal gray line. P values obtained by applying a Friedman test followed by a Nemenyi post hoc test. Please note that plotted points can be indistinguishable due to individual values that are close or identical.
In the cat with laboratory abnormalities at t0 consistent with pancreatitis (DGGR‐lipase 73 U/L, Spec fPL 33 μg/L [reference range 0–3.5 μg/L], TLI 179.9 μg/L [reference range 12–82 μg/L]) serum Cbl concentrations increased only within the subnormal range (t0 < 111, t6 = 123 pmol/L, t10 = 137 mmol/L, t16 = 123 mmol/L). This cat was a 13‐year‐old European Shorthair with a 1‐year history of pancreatitis based on multiple increased DGGR‐lipase activities. Clinical signs at the inclusion of this cat into the study included anorexia, weight loss, and vomiting. Ultrasonographic findings comprised an enlarged and mixed‐echoic pancreas, a thickened gallbladder wall, and ileocecal lymphadenomegaly. Increased baseline serum and urine MMA (5.54 μmol/L and 5.5 mmol/mol creatinine at t0) had normalized at t10 (0.29 μmol/L and 0.32 mmol/mol creatinine), and were increased again at t16 (1.39 μmol/L, and 4.39 mmol/mol creatinine). Clinical improvement was noted with Cbl supplementation, diet change, and prednisolone. The clinical disease activity score decreased from 8 (t0) to 4 (t6, t10, and t16).
Serum MMA concentration (Fig 2) also differed significantly over time (χ2 10.92, P < 0.05). The post hoc analysis showed that the median serum MMA concentration decreased significantly (P < 0.01) from 372 μmol/L (range, 0.39–147,000) at t0 to 1.62 μmol/L (range, 0.18–806) at t6 and there was a trend toward an increase at 4 weeks (t10 5.34 μmol/L; range, 0.13–1,730) and 10 weeks (t16 189 μmol/L; range, 0.4–983) after the last Cbl injection. Only 1 of 20 cats had a baseline serum MMA concentration (0.39 μmol/L) within the reference range. Serum MMA concentrations had normalized in 8 of 20 (40%) cats at t6, and remained normal in 6 of 20 (30%) cats at t10, and in 1 of 20 (5%) cats at t16.
Figure 2.
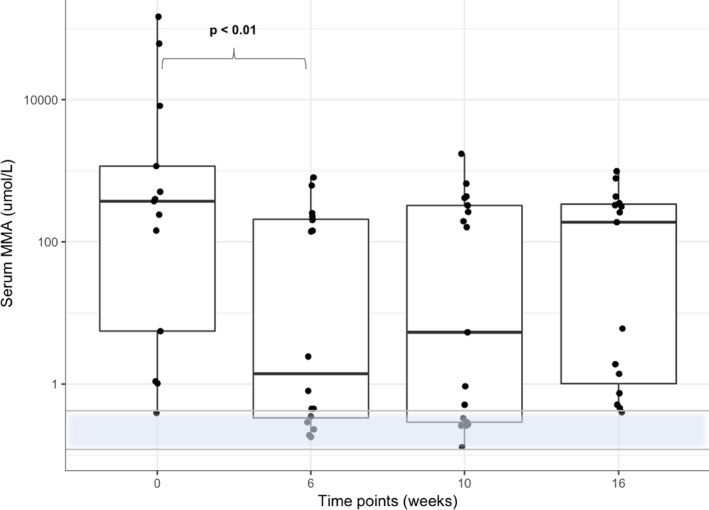
Combined box and scatter plot for serum MMA concentration on a log‐scale. By the Tukey method, boxes represent median and IQR and whiskers outliers (values up to 75th percentile + 1.5 IQR). The reference range for serum MMA concentration is indicated as a transparent blue area with an upper and lower horizontal gray line. P values obtained by applying a Friedman test followed by a Nemenyi post hoc test. Please note that plotted points can be indistinguishable due to individual values that are close or identical.
Median urine MMA (Fig 3) values at t0 were 1.215 mmol/mol creatinine (range, 0.08–544). Eight of 20 cats had a baseline urine MMA concentration (median 0.15 mmol/mol creatinine, range 0.08–0.42) within the reference range. Urine MMA concentrations decreased in a similar fashion to serum MMA concentration after Cbl supplementation at t6 (0.33 mmol/mol creatinine; range, 0.12–1.9) and t10 (0.32 mmol/mol creatinine; range, 0.11–3.88). Fourteen of 20 (70%) cats had normalized urine MMA values at t6, and 12 of 20 (60%) cats had normalized urine MMA values at t10. Urine MMA values appeared to increase again at t16 (0.65 mmol/mol creatinine; range, 0.13–4.39) with only 8 of 20 (40%) cats remaining in the reference range. However, these changes did not achieve significance.
Figure 3.
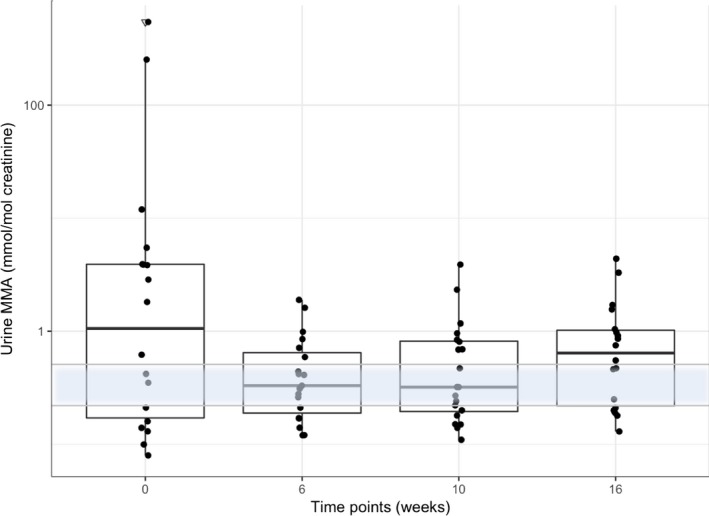
Combined box and scatter plot for urine MMA concentration on a log‐scale. By the Tukey method, boxes represent median and IQR and whiskers outliers (values up to 75th percentile + 1.5 IQR). Triangles representing outliers (values greater than 75th percentile + 1.5 IQR). The reference range for urine MMA concentration is indicated as a transparent blue area with an upper and lower horizontal gray line. P values obtained by applying a Friedman test followed by a Nemenyi post hoc test. Please note that plotted points can be indistinguishable due to individual values that are close or identical.
None of the cats with increased serum or urine MMA values at t6 had normal baseline serum or urine MMA values. There was a significant negative correlation between the concentrations of serum Cbl and urine MMA (Rho −0.48, P < 0.001) and a significant negative correlation between the concentrations of serum Cbl and serum MMA (Rho −0.31, P < 0.05). There was no significant association between serum and urine MMA values.
Clinical Signs
The median clinical disease activity score at baseline (t0) was 4 (range, 1–11). The clinical disease activity scores (Fig 4) differed significantly over time (χ2 22.41, P < 0.001). A polynomial regression was fitted to visually represent the trend over time (R2 0.30, P < 0.001). The trend line reflected a decrease in clinical disease activity over and after the course of treatment (t0–t16) with the lowest values at t4 and t5, after which time (discontinuation of Cbl supplementation) the values increased again.
Figure 4.
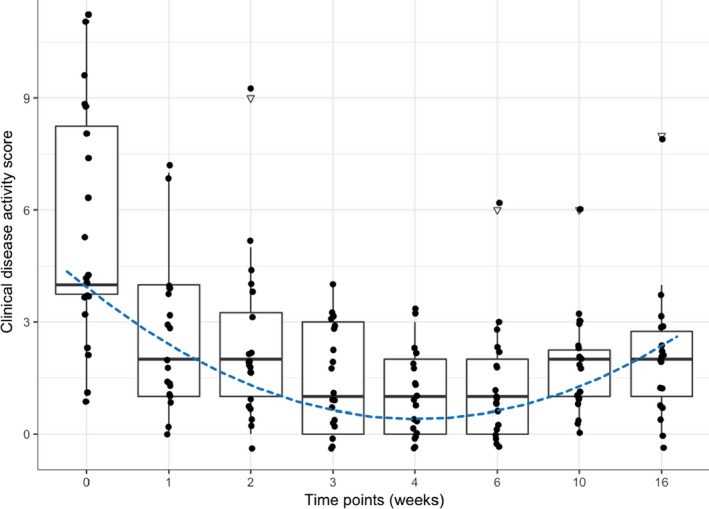
Combined box and scatter plot for the clinical disease activity score (y‐axis) versus the time of measurement (x‐axis). By the Tukey method, boxes represent median and IQR, whiskers outliers (values up to 75th percentile + 1.5 IQR). Triangles representing outliers (values greater than 75th percentile + 1.5 IQR). The dotted line represents the trend over time (derived from a second‐order polynomial regression). Please note that plotted points can be indistinguishable due to individual values that are close or identical.
Discussion
In 19 of 20 cats with Cbl deficiency and signs of gastrointestinal disease, parenteral supplementation of Cbl, 250 μg once weekly IM, for 6 weeks, led to a significant increase in serum Cbl concentrations followed by a decrease at 4 and 10 weeks after the last injection. The serum Cbl concentration at t16 was significantly lower than at t6. The median concentration of MMA, which is considered a marker of cellular Cbl deficiency, decreased during the 6‐week period of Cbl supplementation, but the decrease was only significant for serum MMA levels. There was a trend for a rebound in the median concentrations of urine and serum MMA. This might also have achieved statistical significance if the cats had been followed for longer than 10 weeks after their final Cbl injection. A progressive decrease in the clinical disease activity score was seen during the period of Cbl supplementation, but values increased again after the last Cbl injection.
To our knowledge, longer‐term evaluation of the Cbl status of cats that have received 6 weeks of Cbl supplementation has not been reported and was therefore a point of interest in the present study. Our data indicate that once Cbl supplementation is discontinued in cats with chronic enteropathy, the concentration of serum Cbl decreases and that of MMA increases, both of which indicate that Cbl supplementation might be necessary for longer periods in cats with Cbl deficiency. Very likely, the Cbl deficiency cannot be “fixed” without also resolving its underlying cause. Unfortunately, at present it is unknown how best to determine whether the underlying gastrointestinal disease has been controlled or resolved.
In the context of the present results, it is interesting to note that the currently advocated Cbl supplementation protocol1 of 6 weekly injections (250 μg/dose), followed by one dose a month later, and retesting 1 month after the last dose seems to be designed with a consideration for repeat testing in mind. Even if evidence is currently lacking for this recommendation, the clinical experience of the authors must have been similar to our findings in this study.
The decrease in serum Cbl concentration seen after discontinuation of Cbl supplementation might have been associated with insufficient cellular Cbl uptake, insufficient deposition of the vitamin, or both. This seems particularly likely considering that serum Cbl values were increased in the face of persistently elevated MMA concentrations at t6 in more than half of the cats. Information on cellular uptake, storage, and release of Cbl in cats appears to be lacking. It has been speculated that after absorption of Cbl in the ileum, the vitamin is bound to transcobalamin, enters the enterohepatic circulation, and is partially excreted in bile, similar to what has been shown in dogs.6 If that is the case, ongoing disease processes such as inflammatory enteropathy or lymphoma of the small intestines could interfere with renewed absorption of biliary Cbl. Another unknown variable is the saturation capacity of Cbl transport proteins. The unsaturated Cbl‐binding capacity of plasma proteins may be exceeded when large doses of Cbl are administered, and unbound Cbl is lost via glomerular filtration. Adequate cellular uptake of Cbl is required for the production activity of methylmalonyl‐CoA mutase, a Cbl‐dependent enzyme located intracellularly. This in turn depends on adequate binding of Cbl to transport proteins in plasma. In humans, plasma Cbl is bound to 2 proteins, transcobalamin and haptocorrin (also referred to as transcobalamin II and I). Transcobalamin carries approximately one quarter of the circulating Cbl, and only about 10% of the protein is saturated with Cbl.25 Importantly, only Cbl bound to transcobalamin (holotranscobalamin) is available to cells. Haptocorrin is an almost fully saturated Cbl‐binding glycoprotein of unknown function that carries the major part of circulating Cbl.25 It has been shown in humans that prolonged loading with Cbl results in a change in the total Cbl concentration but not in the concentration of holotranscobalamin.26 Based on the results of the present study, it is tempting to speculate that the same holds true for cats. Unfortunately, very little is known about Cbl‐binding proteins in cats,27 and relevant studies have not been carried out. In addition, the precise Cbl requirements of cats are not known. Experimental studies using radio‐labeled Cbl in dogs showed that the fraction of Cobalt‐labeled Cbl stored in the liver after each dose given parenterally was highest when small doses were injected.28 Repeated small doses of Cbl might also be needed in cats to load the liver more efficiently. Interestingly, in a study on the effects of a Cbl‐deficient diet in cats, urinary excretion of MMA normalized in Cbl‐deficient cats when they were given 10 μg cyanocobalamin per day parenterally.13 This dose is considerably less than the one used in the present study. Our serum MMA results at t6 could indicate that either the dose or the dose frequency was insufficient to normalize Cbl at a cellular level.
A persistent increase in serum MMA concentration despite normalization of serum Cbl concentration has been described, albeit in only 1 of 19 cats that received parenteral Cbl supplementation at 250 μg once weekly, for 4 weeks.11 Although the number of cats with increased MMA values after discontinuation of Cbl supplementation was not reported, the study concluded that 250 μg of parenterally administered Cbl once weekly, for 4 weeks, was adequate to restore normal Cbl‐dependent metabolism in many cats with hypocobalaminemia.11 Compared with the results of Ruaux et al. (2005),11 our baseline serum MMA values were markedly higher (median 372 μmol/L compared with a median of 5.4 μmol/L11) and our decrease in MMA concentration at t6 more pronounced (median 1.62 μmol/L compared with a median of 0.4, range 0.2–7.2 μmol/L11). These differences were particularly interesting considering that both studies used similar reference ranges for serum MMA concentration (0.1–0.4 μmol/L and 0.36–0.53 μmol/L11). Variances in pre‐analytical handling of samples (storage and shipment) seem unlikely to account for major differences between the two studies because serum MMA was recently shown to be stable for up to 1 week when stored at room temperature without protection from light.29 The severity of disease, however, might have played a role because weight loss was the major presenting complaint in 19 of 20 cats in our study but in only 4 of 19 cats in the other study.11
The point at which cellular Cbl deficiency begins to develop is unknown. This could have contributed to the only modest correlations between Cbl and MMA in our study. A weak correlation between serum Cbl and serum MMA was also found in 1 other study.9
Until now, studies in cats indicate that serum Cbl concentrations can fall well below the reference range before metabolic biomarkers of deficiency begin to rise.7, 8, 11 In addition, cats can already have evidence of Cbl deficiency, whereas serum Cbl values remain within the reference range.9 A recent study showed that the best serum Cbl concentration cutoff (118 pmol/L) for predicting elevated serum MMA concentration had a sensitivity of only 74% and a specificity of 80%.7
It was surprising to find no correlation between serum and urine MMA concentrations. At t6, biochemical evidence of Cbl deficiency was still present in 12 cats based on serum MMA concentration, but in only six cats based on urine MMA concentration. Renal impairment cannot be excluded as a cause for this discrepancy because markers of glomerular filtration rate were not routinely monitored. Human patients with impaired renal function, based on elevated plasma cystatin C values, had significantly lower urine MMA‐to‐creatinine ratios than patients with normal plasma cystatin concentrations.30 However, this difference was very small, and only two cats in our study were mildly azotemic. Moreover, a recent study in cats found no correlation between the concentrations of serum creatinine and serum MMA.9 Because of the thin nature of cats with intestinal disease and Cbl deficiency, future studies would ideally assess whether serum SDMA and MMA correlate better than creatinine and MMA.
Although there are no data on renal clearance of circulating MMA in cats, it has been shown that urinary excretion of serum MMA relative to that of creatinine was <1 in human patients.15, 31, 32, 33 It was proposed that an unknown percentage of serum MMA is not excreted by the kidney, but instead is metabolized via unknown pathways.31, 32, 33 If this theory is valid and applicable to cats, individual differences in metabolism might have affected urinary excretion of MMA, which would explain the discrepancy in serum and urine MMA concentrations. However, further studies are needed to solve this dilemma.
Our data are in agreement with the findings of another study,11 which concluded that cats with hypocobalaminemia benefit clinically from Cbl supplementation. However, it remains inherently difficult to accurately assess the magnitude of this beneficial effect because of other factors, which include the presence of underlying diseases, the absence of a definitive diagnosis, the severity of concurrent disease, and the effect of individual treatments. Determining the beneficial effects of Cbl supplementation can be particularly difficult in a population with varying severities of cellular Cbl deficiency. It was shown that human patients with Cbl deficiency and only mild (0.4–0.59 μmol/L) to moderate (0.6–2.0 μmol/L) increases in plasma MMA concentration benefited only minimally from Cbl supplementation.34 Despite these confounding factors, the clinical signs of cats in the present study appeared to worsen again after the last Cbl injection, and concentrations of serum Cbl decreased whereas those of MMA increased (Fig 4).
It has recently been shown that hypocobalaminemia in cats with hyperthyroidism, in which underlying gastrointestinal disease is unlikely, is not a functional deficiency requiring supplementation.10 In contrast, all four hyperthyroid cats in the present study also had biochemical evidence of Cbl deficiency. This difference probably is a reflection of variances in inclusion criteria; we deliberately aimed to select cats with gastrointestinal disease, whereas the other study excluded cats suspected of having or diagnosed with gastrointestinal disease.10
Our study had some limitations. One limitation was the inclusion of cats with more than one clearly defined disease process as well as with different stages and severity of disease. Furthermore, the magnitude of cellular Cbl depletion varied among cats, and MMA values were not immediately available at enrollment, hindering establishment of a more homogeneous population. Moreover, the dosage regimen for Cbl supplementation differed from currently advocated regimens in that it did not include additional Cbl injections after the recommended 6‐week period1. Individualized Cbl dosage schedules might prove more effective for Cbl supplementation, and normalization of MMA levels. However, we predicted that a prolonged study design (ie, determination of MMA concentrations after the currently recommended extended dosage scheme) would have led to an even higher number of dropouts. Lastly, our population size was relatively small, which meant that a few outliers could have had profound effects on the statistical analysis. It took almost 4 years to be able to include 20 cats in the present study, which underlines the degree of difficulty in obtaining a larger population size. Measurement of the postsupplementation serum Cbl concentration was taken at the time of the 6th injection appointment to spare owners an additional visit to our hospital. The immediate postsupplementation values in our study (t6) therefore reflect the effects of five Cbl 250 μg injections, whereas the results of the follow‐up measurements reflect the effect of six Cbl 250 μg injections.
In conclusion, our findings showed that cats with hypocobalaminemia benefit from Cbl supplementation once weekly, for 6 weeks, but the beneficial effects appear to be of relatively short duration. Although improvements in serum Cbl concentration and biomarkers of Cbl status can be achieved after parenteral Cbl supplementation, once a week, for 6 weeks, this dosage regimen led to correction of metabolic Cbl deficiency in only a subset of cats. Based on the results of our study, follow up measurement of Cbl or serum MMA levels appear indicated to determine if Cbl supplementation should be continued and additional prospective studies need to be conducted to establish whether or not cats ever resolve their need for supplementation.
Acknowledgment
Conflict of Interest Declaration
Authors declare no conflict of interest.
Off‐label Antimicrobial Declaration
Authors declare no off‐label use of antimicrobials.
The study was conducted at the Clinic for Small Animal Internal Medicine, Vetsuisse Faculty, University of Zurich, Switzerland.
Footnotes
Cyanocobalaminum, solution injectable, 1,000 mcg/mL, Amino AG, 5412 Gebenstorf, Switzerland
Immulite 2000, vitamin B12, Siemens Healthcare Diagnostics Inc, Newark, DE
Dionex, Thermo Scientific, Waltham, MA
SCIEX, Framingham, MA
Beckman Coulter International S.A. Nyon, Switzerland
R statistical program for analyses with the PMCMR and the lme4 library
Powerpoint for Mac (15.28); R statistical program with the ggplot2 library
References
- 1. Nielsen MJ, Rasmussen MR, Andersen CB, et al. Vitamin B12 transport from food to the body's cells—A sophisticated, multistep pathway. Nat Rev Gastroenterol Hepatol 2012;9:345–354. [DOI] [PubMed] [Google Scholar]
- 2. Carmel R. Biomarkers of cobalamin (vitamin B‐12) status in the epidemiologic setting: A critical overview of context, applications, and performance characteristics of cobalamin, methylmalonic acid, and holotranscobalamin II. Am J Clin Nutr 2011;94:348S–358S. [DOI] [PMC free article] [PubMed] [Google Scholar]
- 3. Nauck M, Bisse E, Nauck M, et al. Pre‐analytical conditions affecting the determination of the plasma homocysteine concentration. Clin Chem Lab Med 2001;39:675–680. [DOI] [PubMed] [Google Scholar]
- 4. Hvas AM, Nexo E. Diagnosis and treatment of vitamin B12 deficiency—an update. Haematologica 2006;91:1506–1512. [PubMed] [Google Scholar]
- 5. Savage DG, Lindenbaum J, Stabler SP, et al. Sensitivity of serum methylmalonic acid and total homocysteine determinations for diagnosing cobalamin and folate deficiencies. Am J Med 1994;96:239–246. [DOI] [PubMed] [Google Scholar]
- 6. Simpson KW, Fyfe J, Cornetta A, et al. Subnormal concentrations of serum cobalamin (vitamin B12) in cats with gastrointestinal disease. J Vet Intern Med 2001;15:26–32. [DOI] [PubMed] [Google Scholar]
- 7. Ruaux CG, Steiner JM, Williams DA. Relationships between low serum cobalamin concentrations and methylmalonic acidemia in cats. J Vet Intern Med 2009;23:472–475. [DOI] [PubMed] [Google Scholar]
- 8. Ruaux CG, Steiner JM, Williams DA. Metabolism of amino acids in cats with severe cobalamin deficiency. Am J Vet Res 2001;62:1852–1858. [DOI] [PubMed] [Google Scholar]
- 9. Worhunsky P, Toulza O, Rishniw M, et al. The relationship of serum cobalamin to methylmalonic acid concentrations and clinical variables in cats. J Vet Intern Med 2013;27:1056–1063. [DOI] [PubMed] [Google Scholar]
- 10. Geesaman BM, Whitehouse WH, Viviano KR. Serum cobalamin and methylmalonic acid concentrations in hyperthyroid cats before and after radioiodine treatment. J Vet Intern Med 2016;30:560–565. [DOI] [PMC free article] [PubMed] [Google Scholar]
- 11. Ruaux CG, Steiner JM, Williams DA. Early biochemical and clinical responses to cobalamin supplementation in cats with signs of gastrointestinal disease and severe hypocobalaminemia. J Vet Intern Med 2005;19:155–160. [DOI] [PubMed] [Google Scholar]
- 12. Vaden SL, Wood PA, Ledley FD, et al. Cobalamin deficiency associated with methylmalonic acidemia in a cat. J Am Vet Med Assoc 1992;200:1101–1103. [PubMed] [Google Scholar]
- 13. Morris JG. The essentiality of biotin and vitamin B 12 for the cat In: Proceedings of The Kal Kan Symposium for the Treatment of Dog and Cat Diseases. 1977;15–18.
- 14. Watanabe T, Hoshi K, Zhang C, et al. Hyperammonaemia due to cobalamin malabsorption in a cat with exocrine pancreatic insufficiency. J Feline Med Surg 2012;14:942–945. [DOI] [PMC free article] [PubMed] [Google Scholar]
- 15. Rasmussen K, Moelby L, Jensen MK. Studies on methylmalonic acid in humans. II. Relationship between concentrations in serum and urinary excretion, and the correlation between serum cobalamin and accumulation of methylmalonic acid. Clin Chem 1989;35:2277–2280. [PubMed] [Google Scholar]
- 16. Ruaux CG. Cobalamin in companion animals: Diagnostic marker, deficiency states and therapeutic implications. Vet J 2013;196:145–152. [DOI] [PubMed] [Google Scholar]
- 17. Ruaux CG. Cobalamin and gastrointestinal disease. American College of Veterinary Internal Medicine 20th Annual Form, Dallas, TX, May‐June 2002.
- 18. Kook PH, Lutz S, Sewell AC, et al. Evaluation of serum cobalamin concentration in cats with clinical signs of gastrointestinal disease. Schweiz Arch Tierheilkd 2012;154:479–486. [DOI] [PubMed] [Google Scholar]
- 19. Daniaux LA, Laurenson MP, Marks SL, et al. Ultrasonographic thickening of the muscularis propria in feline small intestinal small cell T‐cell lymphoma and inflammatory bowel disease. J Feline Med Surg 2014;16:89–98. [DOI] [PMC free article] [PubMed] [Google Scholar]
- 20. Norsworthy GD, Scot Estep J, Hollinger C, et al. Prevalence and underlying causes of histologic abnormalities in cats suspected to have chronic small bowel disease: 300 cases (2008‐2013). J Am Vet Med Assoc 2015;247:629–635. [DOI] [PubMed] [Google Scholar]
- 21. Jergens AE, Crandell JM, Evans R, et al. A clinical index for disease activity in cats with chronic enteropathy. J Vet Intern Med 2010;24:1027–1033. [DOI] [PubMed] [Google Scholar]
- 22. Oppliger S, Hilbe M, Hartnack S, et al. Comparison of serum Spec fPL(™) and 1,2‐o‐Dilauryl‐Rac‐Glycero‐3‐Glutaric Acid‐(6'‐Methylresorufin) ester assay in 60 cats using standardized assessment of pancreatic histology. J Vet Intern Med 2016;30:764–770. [DOI] [PMC free article] [PubMed] [Google Scholar]
- 23. Oppliger S, Hartnack S, Riond B, et al. Agreement of the serum Spec fPL™ and 1,2‐o‐dilauryl‐rac‐glycero‐3‐glutaric acid‐(6'‐methylresorufin) ester lipase assay for the determination of serum lipase in cats with suspicion of pancreatitis. J Vet Intern Med 2013;27:1077–1082. [DOI] [PubMed] [Google Scholar]
- 24. Boretti FS, Sieber‐Ruckstuhl N, Schäfer S, et al. Transdermal application of methimazole in hyperthyroid cats: A long‐term follow‐up study. J Feline Med Surg 2014;16:453–459. [DOI] [PMC free article] [PubMed] [Google Scholar]
- 25. Nexo E, Hoffmann‐Lücke E. Holotranscobalamin, a marker of vitamin B‐12 status: Analytical aspects and clinical utility. Am J Clin Nutr 2011;94:359S–365S. [DOI] [PMC free article] [PubMed] [Google Scholar]
- 26. Nexo E, Hvas AM, Bleie Ø, et al. Holo‐transcobalamin is an early marker of changes in cobalamin homeostasis. A randomized placebo‐controlled study. Clin Chem 2002;48:1768–1771. [PubMed] [Google Scholar]
- 27. Linnell JC, Collings L, Down MC, et al. Distribution of endogenous cobalamin between the transcobalamins in various mammals. Clin Sci (Lond) 1979;57:139–144. [DOI] [PubMed] [Google Scholar]
- 28. Glass GB, Mersheimer WL. Radioactive vitamin B12 in the liver. II. Hepatic deposition, storage, and discharge of Co60B12 in dogs. J Lab Clin Med 1958;52:860–874. [PubMed] [Google Scholar]
- 29. Reineks EZ, Hughes A, Wang S. Effect of storage temperature or collection tube type on blood methylmalonic acid concentrations measured by gas chromatography‐mass spectrometry. Clin Chem Lab Med 2010;48:1351–1353. [DOI] [PubMed] [Google Scholar]
- 30. Flatley JE, Garner CM, Al‐Turki M, et al. Determinants of urinary methylmalonic acid concentration in an elderly population in the United Kingdom. Am J Clin Nutr 2012;95:686–693. [DOI] [PubMed] [Google Scholar]
- 31. Marcell PD, Stabler SP, Podell ER, et al. Quantitation of methylmalonic acid and other dicarboxylic acids in normal serum and urine using capillary gas chromatography‐mass spectrometry. Anal Biochem 1985;150:58–66. [DOI] [PubMed] [Google Scholar]
- 32. Oberholzer VG, Levin B, Burgess EA, et al. Methylmalonic aciduria. An inborn error of metabolism leading to chronic metabolic acidosis. Arch Dis Child 1967;42:492–504. [DOI] [PMC free article] [PubMed] [Google Scholar]
- 33. Kovachy RJ, Copley SD, Allen RH. Recognition, isolation, and characterization of rat liver D‐methylmalonyl coenzyme A hydrolase. J Biol Chem 1983;258:11415–11421. [PubMed] [Google Scholar]
- 34. Hvas AM, Juul S, Nexø E, et al. Vitamin B‐12 treatment has limited effect on health‐related quality of life among individuals with elevated plasma methylmalonic acid: A randomized placebo‐controlled study. J Intern Med 2003;253:146–152. [DOI] [PubMed] [Google Scholar]