

Abstract
Purpose:
Malignant pleural mesothelioma (MPM) has a poor prognosis in general. Here we sought to evaluate prognostic factors and predictors of response to chemotherapy in good performance (PS=0-I) patients.
Methods:
We retrospectively reviewed our database and enrolled patients with MPM who received platinum containing chemotherapy (2012-2014). Clinico-pathological and laboratory data were retrieved and Cox and logistic regression multivariate analyses (MVA) were respectively used to identify predictors of survival and response to chemotherapy. Comparison of good vs poor performance status (PS≥II) was accomplished using the Chi (X2) test. Kaplan–Meier survival curves were also obtained and propensity-score matching was performed for survival comparison.
Results:
Among 114 patients listed during the study period, 82 had good PS=0-I (median age 45years, 43 men, 30 smokers, median weight=77Kg, pretreatment haemoglobin (Hb) level=12g/dL, platelet count=372,000/μL, leukocytes=9,700/μL, neutrophils=6,100/μL, lymphocytes=1,890/μL and neutrophil/lymphocyte ratio (NLR)=3.60). Some 65 had asbestosis, 23 had chronic disease, 55 (67.1%) were responders to platinum containing first line chemotherapy. A total of 49 (59.8%) had epithelial MPM. Median-OS and PFS in good PS cases were 17 and 9 months, respectively, as compared to 16 and 8 months for the poor PS group. After matching, better OS was observed among good PS vs poor PS patients (p=0.024) but there was no PFS difference (p=0.176). Significant decrease in PFS was observed among those with advanced nodal N disease (median PFS in N0 and N+ was 10 and 5 months, respectively), non-responders (p=0.012), NLR (p=0.026) and those with an epithelial pathology (p=0.062). MVA demonstrated that advanced (N) status (p=0.015), being a non-responder (p<0.001), NLR (p=0.015) and smoking (p=0.07) adversely affected the prognosis. The only predictor of response was absence of metastasis (M0; p=0.04).
Conclusions:
In addition to previously recognized factors, like nodal status, response, smoking and NLR, better median survival was evident in our patients with a good PS. Early detection before development of metastasis warrants greater focus to allow better responses to be obtained.
Keywords: mpm-perdictors-response, performance
Introduction
Malignant pleural mesothelioma (MPM) is a rare tumor arising from pleural mesothelial cells and is often linked to asbestos exposure. It usually carries a poor prognosis, with a median survival of 9 to 12 months from the diagnosis. (Curran et al., 1998) The mainstay of treatment of advanced stages of MPM is chemotherapy alone, or in combination with surgery and/or radiotherapy for resectable disease. Since 2003, pemetrexed and cisplatin combination has been the standard first-line treatment upon appearance of phase III trial results that revealed almost a 3 month median survival improvement over treatment with cisplatin alone.(Vogelzang et al., 2003) Two groups created prognostic scores to better select patients for more aggressive treatment; Cancer and Leukemia Group B (CALGB) and European Organization for Research and Treatment of Cancer (EORTC). The CALGB study included 309 patients with MPM and PS of 0 to II between 1984 and 1994. Poor prognostic factors for survival were pleural disease extent, higher lactate dehydrogenase (LDH>500 UI/L), poor PS, higher platelet count (> 400,000), non- epithelial histology, and older age (>75 years). MVA showed that younger age <49 years and PS of 0 had the best prognosis. (Herndon et al., 1998) The EORTC study involved 204 MPM patients between 1984 and 1993 and reported that WBC, PS, certainty of histology, histological subtype, and sex were the prognostic factors(van Meerbeeck et al., 2005).
Albeit both studies identified histology and PS as the two main prognostic factors in patients with MPM, these analyses included patients with a range of tumor stages at diagnosis, the majority of whom underwent major surgery and their treatment predated the use of the current chemotherapy regimens.
Since the beginning of routine use of chemotherapy regimens, including pemetrexed as first-line therapy, only one new prognostic index for OS has been created that is based on a retrospective analysis of 283 patients who were treated with chemotherapy alone between 2007 and 2013. PS, histology, stage (I-III versus IV), and pemetrexed-based chemotherapy were independent prognostic factors for survival; however, no factors were analyzed for association with chemotherapy.(van Meerbeeck et al., 2005) We therefore undertook this study to identify prognostic factors in a more uniform, contemporary cohort of nonsurgical patients treated with current chemotherapy regimens, as well as to identify factors that might correlate with clinical benefit from chemotherapy.
Materials and Methods
Patients and Data Collection
We retrospectively reviewed our National Cancer Institute – Thoracic Department (NCI-TD) database and patients’ medical records and enrolled patients with pathologically confirmed MPM and European Cooperative Oncology Group scale ECOG-PS=0-I who underwent evaluation and treatment between January 2012 and December 2014 and then compared them to those with poor PS(ECOG PS≥II) during the same period. We excluded patients treated at another hospital, peritoneal mesothelioma patients, and those with lost follow-up.
Patients who had a surgical procedure for staging or diagnostic surgical procedure or for palliative procedure for pleural effusion were included but those who underwent pleural decortication or extrapleural pneumonectomy were excluded.
Patients’ demographics, clinical, radiological and pathological data were retrieved from the medical records. Analyzed variables were age, weight, gender, smoking status, comorbidities, documented exposure to asbestos, different symptoms, Tumor(T), Nodal (N), Metastasis(M) and International Mesothelioma Interest Group(IMIG) stages, different pre-treatment laboratory values, including pretreatment haemoglobin (Hb), white blood cells(WBCs), platelets count, neutrophils, lymphocytes, neutrophil/lymphocyte ratio (NLR) and pathology. The normal ranges for hemoglobin, platelets, WBCs, neutrophils count, and lymphocytes count were 13 - 17 g/dL, 150,000 - 400,000 /µL, 4000 to 11,000 /µL, 1500 to 8800 /µL, and 500 to 5300 /µL, respectively. Response to chemotherapy using modified Response Evaluation Criteria In Solid Tumors (modified RECIST) criteria were also retrieved. All cases received platinum containing agents as per local guidelines(van Meerbeeck et al., 2005; O’Brien et al., 2013).
Patients who had partial or complete response (PR/CR) using modified RECIST criteria as determined by serial imaging CT after chemotherapy cycles were considered to get a clinical benefit from chemotherapy (responders).
Statistical Methods
The primary outcomes were to identify PFS and OS, that were analyzed using the Kaplan-Meier survival curves and compared using Log-rank for significant variables in multivariate analysis (MVA). PFS was calculated from the date of diagnosis till occurrence of progressive disease or date of last follow up while OS was calculated from the date of diagnosis till last follow up or death. Univariate and multivariate analyses using Cox regression were used to identify the predictors of PFS. Factors with p value <0.05 in univariate analysis were considered significant while factors with p value <0.20 in univariate analysis were involved in MVA to test for their independent role. Hazard ratios and 95% confidence intervals (95% CI) were calculated.
The secondary outcomes were 1) To identify the associations between different variables and response to chemotherapy using the Logistic regression model; 2) To compare patients with good vs. poor PS (ECOG PS 0-I vs. ≥II. Propensity score matching (1:1 including age, gender, smoking, comorbidities, histology, and stage) was performed for further comparison of survival in a matched cohort (caliper=0.20, 29 patients in each cohort) using nearest neighbor method(Hansen and Klopfer, 2006; Ho et al., 2007)
Statistical analyses were carried out using SPSS version 22.0 (IBM, Armonk, NY) and IBM SPSS Statistics-Essentials for R 22.0. Continuous variables were presented as median and interquartile range (IQR) and compared using Mann Whitney U test. Categorical variables were reported as absolute numbers (frequency percentages) and compared using Chi(X2) test.
Results
114 patients with MPM were included during the study period. Patients with good PS(0-I) were 82 versus 32 with poor PS(≥II). Among good PS patients, the median age was 45 years (IQR; 38.3-55), weight 77 Kg (65-88), Hb=12g/dL (10.8-12.9), platelet= 372,000 /μL (306,000-473,000), TLC=9,700/μL(4,400-7,250), neutrophil=6,100/μL(4,400-7,250), lymphocyte=1890/μL(1,000-2,400), NLR=3.60(2.40-6.00) pretreatment (Table 1). Forty three were men, 30 were smokers, 65 had asbestosis, 23 had chronic disease and 55 (67.1%) were responders to chemotherapy.
Table 1.
Patients Characteristics among Our Cohort Prior and after Match (Good vs Poor PS)
| Patients characteristics (n=114) | Frequency (%), Median (IQR) | ||
|---|---|---|---|
| Good PS (n=82) | Poor PS (n=32) | P value | |
| Age; yrs | 45 (22-68) | 48 (40.3-57.8) | 0.13 |
| Male gender | 43 (52.4) | 23 (71.9) | 0.059 |
| Weight; Kg | 77 (65-88) | 88.5 (78.3-95.5) | 0.001 |
| Chronic disease | 23 (28) | 10 (31.3) | 0.735 |
| Asbestos | 65 (79.3) | 21 (65.6) | 0.128 |
| Smokers | 30 (36.6) | 12 (37.5) | 0.928 |
| Dyspnea | 76 (92.7) | 29 (90.6) | 0.714 |
| Chest pain | 72 (87.8) | 26 (81.3) | 0.365 |
| Grade 2 Chest pain | 35 (45.5) | 0 (0) | 0.001 |
| Cough | 44 (53.7) | 20 (62.5) | 0.393 |
| Fatigue | 53 (64.6) | 23 (71.9) | 0.461 |
| Anorexia | 19 (23.2) | 16 (50) | 0.005 |
| Pleural effusion | 69 (84.1) | 31 (96.9) | 0.063 |
| Pleural thickening | 78 (95.1) | 31 (96.9) | 0.881 |
| T4 stage | 14 (17.1) | 5 (15.6) | 0.852 |
| N+ | 27 (32.9) | 8 (25) | 0.41 |
| M+ | 10 (12.2) | 5 (15.6) | 0.626 |
| IMIG stage III/IV | 59 (72) | 20 (62.5) | 0.326 |
| Pretreatment hemoglobin; g/dL | 12 (10.8-12.9) | 11.15 (10-12) | 0.043 |
| Platelets; / μL | 372,000 (306,000-473,500) | 316,000 (214,000-464,000) | 0.054 |
| WBC; /μL | 9,660 (7,498-12,000) | 10.6 (925,000-12,000) | 0.113 |
| Neutrophils; /μL | 6,100 (4,400-7,250) | 6,200 (4,550-7,275) | 0.762 |
| Lymphocytes; /μL | 1,850 (1,000-2,400) | 1,000 (800-1,800) | 0.001 |
| NLR | 3.6 (4.31-2.76) | 5.3 (3.97-8.77) | 0.001 |
| Epithelial histology | 49 (59.8) | 18 (56.3) | 0.566 |
| Median OS(months;IQR) | 17 (14-19.9) | 16 (12.7-19.3) | 0.383 |
| Median PFS | 9 (7-11) | 8 (6.6-9.6) | 0.121 |
| Median TTP | 10 (8.2-11.8) | 8 (5.8-10.2) | 0.258 |
| Median Follow up | 16 | 16.5 | … |
| After Propensity score Match(n=58) | |||
| Good PS (n=29) | Poor PS (n=29) | P value | |
| Age;(> Median 45 yrs) | 13 (44.8%) | 14 (48.3%) | 0.792 |
| Male gender | 18 (62.1%) | 20 (69%) | 0.581 |
| Weight(> median 77kg) | 16 (55.2%) | 21 (72.4%) | 0.172 |
| Chronic disease | 10 (34.5%) | 9 (31%) | 0.78 |
| Asbestos | 25 (86.2%) | 20 (69%) | 0.115 |
| Smokers | 10 (34.5%) | 11 (37.9%) | 0.785 |
| IMIG stage IV | 7 (24.1%) | 9 (31%) | 0.52 |
| Pretreatment hemoglobin; g/dL | 11.9 (10.6-12.9) | 11 (10-12) | 0.123 |
| Platelets; /μL | 369,000 (328,000-482,000) | 321,000 (214,000-549,000) | 0.146 |
| WBC; /μL | 11,000 (9,000-12,150) | 10.2 (8,900-12,000) | 0.732 |
| Neutrophils; /μL | 6,600 (3,800-7,750) | 6,100 (4,450-6,850) | 0.544 |
| Lymphocytes; /μL | 1,800 (1,000-2,300) | 1,000 (800-1,800) | 0.013 |
| NLR | 3.92 (2.60-6.20) | 5.30 (3.74-9.23) | 0.027 |
| Epithelial histology | 19 (65.5%) | 16 (55.2%) | 0.421 |
LN, lymph node; N, nodal stage; M, metastasis stage; IMIG, International mesothelioma Interest Group staging; WBCs, white blood cells; OS, overall survival; IQR, inter-quartile range; PFS, progression free survival; TTP, time to progression
On comparing good vs. poor PS; significant differences were noticed as regarding median weight(77 vs. 88.5 Kg), male gender(52 vs. 72%), presence of grade 2 chest pain(46 vs. 0%), anorexia(32 vs. 50%), pleural effusion(84 vs. 97%), median pretreatment Hb (12 vs. 11.2), platelets(372,000 vs. 316,000), lymphocytes (1,900 vs. 1,000) and NLR(3.65 vs. 5.3) respectively. (Table 1)
Survival, Univariate and Multivariate analysis:
Among good PS cohort; 1-year OS and PFS were 73.1% and 32.9% respectively with median follow-up time of 16 months. Median OS and PFS were 17 months (95%CI: 14.1-19.9) and 9 months (95%CI:7 - 11.03) respectively (Figure 1) while in poor PS cohort median OS and PFS was 16 months (95%CI: 12.7 - 19.3) and 8 months (95% CI: 6.6 - 9.4) respectively. No statistical significant difference in OS (p=0.383) between good and poor PS while there is a trend toward significance regarding PFS (p=0.121). However, after the propensity score matching, better OS was observed in good PS with median OS of 19 months vs. 16 months in poor PS (p=0.024) while no difference in PFS (p=0.176; Figure 2)
Figure 1.

OS and PFS among Good PS
Figure 2.
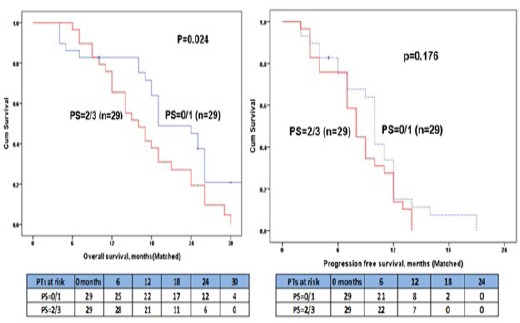
Matched Good vs Poor PS
Cox proportional hazards model was conducted on different clinico-demographic and pathological data and revealed that advanced nodal (N) disease (median PFS in N0 and N+ were 10 and 5 months respectively; p= 0.07), non-responder (p=0.012), NLR (p=0.026) and epithelial pathology (p=0.062) were associated with significant decrease in PFS. Multivariate analysis demonstrated that advanced N status (p=0.015), non-responder (p<0.001), NLR (p=0.015) and smoking (p=0.07) adversely affecting prognosis. (Table 2)
Table 2.
Predictors of Progression Free Survival among Our Cohort (n=82)
| Independents Variables | Univariate Analysis | Multivariate Analysis | ||
|---|---|---|---|---|
| HR (95% CI) | p value | HR (95% CI) | p value | |
| Age* | 1.01 (0.99-1.03) | 0.517 | ||
| Weight* | 1.01 (0.99-1.03) | 0.119 | 1.01 (0.99-1.03) | 0.164 |
| Gender | ||||
| Female (n=39) | Reference | |||
| Male (n=43) | 1.26 (0.81-1.97) | 0.313 | ||
| Presence of Chronic disease | ||||
| No (n=59) | Reference | |||
| Yes (n=23) | 1.31 (0.79-2.16) | 0.294 | ||
| Asbestosis | ||||
| No (n=17) | Reference | |||
| Yes (n=65) | 1.11 (0.65-1.90) | 0.715 | ||
| Smoking | ||||
| No (n= 52) | Reference | Reference | ||
| Yes (n=30) | 1.41 (0.88-2.27) | 0.153 | 1.59 (0.96-2.63) | 0.073 |
| Dyspnea | ||||
| No (n=6) | Reference | |||
| Yes (n=76) | 1.24 (0.53-2.89) | 0.616 | ||
| Chest pain | ||||
| No (n=10) | Reference | |||
| Yes (n=72) | 0.86 (0.44-1.67) | 0.65 | ||
| Cough | ||||
| No (n=38) | Reference | |||
| Yes (n=44) | 1.13 (0.73-1.76) | 0.589 | ||
| Fatigue | ||||
| No (n=29) | Reference | |||
| Yes (n=53) | 1.30 (0.81-2.07) | 0.276 | ||
| Anorexia | ||||
| No (n= 63) | Reference | |||
| Yes (n= 19) | 1.01 (0.59-1.71) | 0.981 | ||
| Effusion | ||||
| No (n=13) | Reference | |||
| Yes (n=69) | 1.07 (0.58-1.99) | 0.826 | ||
| Mediastinal LN ¶ | ||||
| No (n=48) | Reference | |||
| Yes (n=34) | 1.37 (0.88-2.14) | 0.169 | ||
| T stage | ||||
| T1,2,3 (n=68) | Reference | |||
| T4 (n=14) | 1.25 (0.70-2.24) | 0.452 | ||
| N stage | ||||
| N0 (n=55) | Reference | Reference | ||
| N+ (n=27) | 1.50 (0.94-2.40) | 0.071 | 1.87 (1.13-3.09) | 0.015 |
| M stage | ||||
| M0 (n=67) | Reference | Reference | ||
| M1 (n=15) | 1.50 (0.88-2.57) | 0.134 | 1.02 (0.58-1.81) | 0.936 |
| Response | ||||
| Non responsive (SD/PD) n=27 | Reference | Reference | ||
| Responsive (PR/CR) n=55 | 0.55 (0.34-0.88) | 0.012 | 0.35 (0.20-0.62) | <0.001 |
| Pretreatment Hb | 0.96 (0.87-1.07) | 0.469 | ||
| Platelet* | 1.01 (0.99-1.01) | 0.307 | ||
| TLC* | 1.03 (0.97-1.10) | 0.344 | ||
| Neutrophils* | 1.03 (0.92-1.14) | 0.643 | ||
| Lymphocytes* | 1.01 (0.99-1.02) | 0.204 | ||
| Neutrophils/Lymph Ratio | 1.023 (1.001-1.030) | 0.026 | 1.010 (1.1.001-1.020) | 0.015 |
| Pathology | ||||
| Epithelial (n= 49) | Reference | Reference | ||
| Sarcomatoid/Mixed (n= 33) | 0.64 (0.40-1.02) | 0.062 | 0.81 (0.49-1.34) | 0.422 |
Hb, haemoglobin; TLC, total leukocytic count
Means continuous variable; not included in MVA due to collinearity with N stage
Response to chemotherapy in good PS cohort
92.7 % of good PS had documented at least 2 chemotherapy cycles while 76.3% had 3 or more chemotherapy cycles.
Patients with partial or complete response (PR/CR) had a better OS compared to non-responders (stable or progressive disease (SD/PD)) with a median of 21 vs. 15 months respectively (p=0.026). Similarly, chemotherapy responders (PR/CR) had a higher PFS compared to the remaining (SD/PD) with median PFS 12 vs. 6 months respectively (p=0.007; Figure 3).
Figure 3.
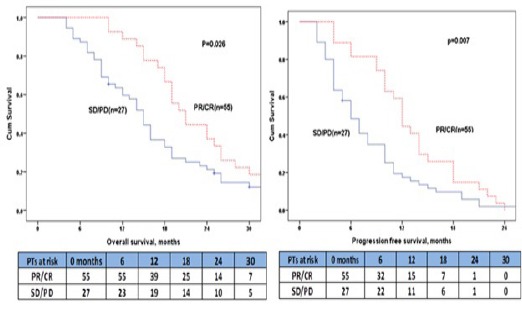
Response To Chemotherapy among Good PS
Logistic regression model was created to determine factors predicting response to chemotherapy and revealed that absence of asbestosis (p=0.05), absence of fatigue (p=0.03), absence of metastasis (p=0.04), lower platelets count (p=0.05) to be predictors of response in univariate analysis. However, MVA showed only absence of metastasis (M0;p=0.047) to be the significant predictor of response.
Discussion
Many studies postulate that good PS is considered as a good prognostic factor and predicts better survival in patients with MPM, such as CALGB and EORTC indices in addition to other prognostic factors. However they had worked on selected patient in clinical trials, patients undergoing extensive surgery, and chemotherapy patients who have a favorable prognosis and could tolerate and potentially benefit from a more aggressive combined modality treatment before the use of pemetrexed and other new current regimens became routine. In this study we sought to investigate different clinico-demographic and prognostic criteria among this good PS cohort. (Billé et al., 2016; Edwards et al., 2003; Pinato et al., 2013; Suzuki et al., 2014) Our study, that examined a relatively uniform cohort of patients with unresectable disease who received platinum based regimens as a standard first-line treatment, confirms that some elements of the CALGB and EORTC prognostic scoring systems correlate with survival in this patient population as well.
The most prevalent symptoms and histology among our cohort were chest pain and dyspnea and epithelial pathology that are in concordance with many series.(Elkasem et al., 2017a, 2017b; Najmi et al., 2014; Shokralla) Asbestosis was evident in 79.3% and more than two-thirds of the cases aged between 40 and 59 years, that is not consistent with prior series(Borasio et al., 2008) signifying early disease onset among our population, that might be related to heavy asbestos exposure. This heavy exposure proved to be as important as long term low asbestos dose exposure with or without higher genetic predisposition.(Bianchi and Bianchi, 2007; Metintas et al., 2008).
Median OS was 17 months which is better than recently published series from Memorial Sloan Kettering Cancer Center who reported median OS for all patients was 13.4 months. However they had 82% of their cases with stage III or IV MPM vs. 72% among the current series 8.
Histology carries a significant difference in survival with epithelial MPM being the best in term of prognosis in contrast to either sarcomatoid or mixed MPM, (Edwards et al., 2003; Flores et al., 2007) however; we couldn’t prove that but furthermore there was a better survival in non-epithelial histology. This may be explained in part by high prevalence of advanced stage among our epithelial MPM cohort (IMIG stage 4 was present in 34.7 vs. 24.2% in non-epithelial cohort).
Lower NLR was associated with better survival that was evident in in meta-analysis conducted by Templeton et al., (2014) on MPM and also in other thoracic malignancies as esophageal cancer reported by Sharaiha et al., (2011) who reported that NLR reflect the systemic inflammatory response created by a tumor and is possibly predictive of tumor aggressiveness and propensity for metastasis.
Advanced nodal (N) stage and smoking were linked to poor survival in MPM and many other thoracic malignancies e.g. lung cancer. (Rahouma et al., 2015; Richards et al., 2010; Shokralla and Rahouma, 2016).
Chemotherapy was designated to down stage, cure cancer, decrease disease progression or palliate symptoms so, it is logic that absence of response to chemotherapy will be associated with disease progression and hence poor survival and this was evident among our cohort and run in parallel with previously published data (Blayney et al., 2012).
In our previously published series on non-epithelial MPM, presence of asbestosis was the only predictor of poor response to chemotherapy which is in concordance with our cohort results (Shokralla et al., 2016) however this significance disappeared in the multivariate analysis signifying that it is not an independent predictors among our cohort that involved both epithelial and non-epithelial histology.
Absence of metastasis (M0) was the significant predictor of response to chemotherapy and this may be explained by the fewer tumor loads that chemotherapy has to face.
Despite some limitations and confounding factors, our analysis expands on prior studies of prognostic factors in MPM. In particular, we identified that absence of metastasis to be associated with clinical benefit from first-line chemotherapy and that nodal (N) status, chemotherapy responder, NLR and smoking status are prognostic for survival in the multivariate analysis. Although future studies evaluating the biology of MPM as well as the prognostic value of tumor volume measurements may improve therapy selection, our results define measurable clinical factors that can help direct patient treatment easily.
In conclusion, pretreatment NLR is a potential prognostic marker for progression and death in treated MPM patients. Better response to chemotherapy treatment predicts better PFS. Smoking and Advanced N stage hinder the survival among good PS MPM patients. Better median survival was evident in patients with good PS. Early detection prior to development of metastasis is warranted to get better response.
Informed consent
Informed consent was obtained from all individual participants included in the study.
Ethical approval
All applicable international, national, and/or institutional guidelines for the care and use of animals were followed.
References
- Bianchi C, Bianchi T. Malignant mesothelioma: global incidence and relationship with asbestos. Ind Health. 2007;45:379–87. doi: 10.2486/indhealth.45.379. [DOI] [PubMed] [Google Scholar]
- Billé A, Krug LM, Woo KM, et al. Contemporary analysis of prognostic factors in patients with unresectable malignant pleural mesothelioma. J Thorac Oncol Off Publ Int Assoc. 2016;11:249–55. doi: 10.1016/j.jtho.2015.10.003. [DOI] [PMC free article] [PubMed] [Google Scholar]
- Blayney JK, Ceresoli GL, Castagneto B, et al. Response to chemotherapy is predictive in relation to longer overall survival in an individual patient combined-analysis with pleural mesothelioma. Eur J Cancer. 2012;48:2983–92. doi: 10.1016/j.ejca.2012.05.018. [DOI] [PubMed] [Google Scholar]
- Borasio P, Berruti A, Billé A, et al. Malignant pleural mesothelioma: clinicopathologic and survival characteristics in a consecutive series of 394 patients. Eur J Cardiothorac Surg. 2008;33:307–13. doi: 10.1016/j.ejcts.2007.09.044. [DOI] [PubMed] [Google Scholar]
- Curran D, Sahmoud T, Therasse P, et al. Prognostic factors in patients with pleural mesothelioma: the European organization for research and treatment of cancer experience. J Clin Oncol. 1998;16:145–52. doi: 10.1200/JCO.1998.16.1.145. [DOI] [PubMed] [Google Scholar]
- Edwards JG, Swinson DE, Jones JL, et al. Tumor necrosis correlates with angiogenesis and is a predictor of poor prognosis in malignant mesothelioma. Chest J. 2003;124:1916–23. doi: 10.1378/chest.124.5.1916. [DOI] [PubMed] [Google Scholar]
- Elkasem FA, Rahoma M, El Khir IA. P101-031 does malignant pleual mesothelioma (MPM) behaviour differ among decades?: Topic: lung cancer screening, diagnosis. J Thorac Oncol. 2017a;12:467–8. [Google Scholar]
- Elkasem FA, Rahoma M, El Khir IA. P101-049 predictors of high grade toxicity of chemotherapy among malignant pleural mesothelioma patients: Topic: prognostic factors, treatment. J Thorac Oncol. 2017b;12:480. [Google Scholar]
- Flores RM, Zakowski M, Venkatraman E, et al. Prognostic factors in the treatment of malignant pleural mesothelioma at a large tertiary referral center. J Thorac Oncol. 2007;2:957–65. doi: 10.1097/JTO.0b013e31815608d9. [DOI] [PubMed] [Google Scholar]
- Hansen BB, Klopfer SO. Optimal full matching and related designs via network flows. J Comput Graph Stat. 2006;15:609–27. [Google Scholar]
- Herndon JE, Green MR, Chahinian AP. Factors predictive of survival among 337 patients with mesothelioma treated between 1984 and 1994 by the cancer and leukemia group B. Chest. 1998;113:723–31. doi: 10.1378/chest.113.3.723. [DOI] [PubMed] [Google Scholar]
- Ho DE, Imai K, King G, Stuart EA. Matching as nonparametric preprocessing for reducing model dependence in parametric causal inference. Polit Anal. 2007;15:199–36. [Google Scholar]
- van Meerbeeck JP, Gaafar R, Manegold C, et al. Randomized phase III study of cisplatin with or without raltitrexed in patients with malignant pleural mesothelioma: an intergroup study of the European organisation for research and treatment of cancer lung cancer group and the national cancer institute of Canada. J Clin Oncol. 2005;23:6881–9. doi: 10.1200/JCO.20005.14.589. [DOI] [PubMed] [Google Scholar]
- Metintas M, Metintas S, Ak G, et al. Epidemiology of pleural mesothelioma in a population with non-occupational asbestos exposure. Respirology. 2008;13:117–21. doi: 10.1111/j.1440-1843.2007.01187.x. [DOI] [PubMed] [Google Scholar]
- Najmi K, Khosravi A, Seifi S. Clinicopathologic and survival characteristics of malignant pleural mesothelioma registered in hospital cancer registry. Tanaffos. 2014;13:6. [PMC free article] [PubMed] [Google Scholar]
- O'Brien ME, Gaafar RM, Popat S, et al. Phase II study of first-line bortezomib and cisplatin in malignant pleural mesothelioma and prospective validation of progression free survival rate as a primary end-point for mesothelioma clinical trials (European organisation for research and treatment of cancer 08052) Eur J Cancer. 2013;49:2815–22. doi: 10.1016/j.ejca.2013.05.008. [DOI] [PubMed] [Google Scholar]
- Pinato DJ, Mauri FA, Lloyd T, et al. The expression of Axl receptor tyrosine kinase influences the tumour phenotype and clinical outcome of patients with malignant pleural mesothelioma. Br J Cancer. 2013;108:621–8. doi: 10.1038/bjc.2013.9. [DOI] [PMC free article] [PubMed] [Google Scholar]
- Rahouma M, Ghaly G, Kamel M, et al. Bilobectomy for lung cancer: postoperative results, and long-term outcomes. J Thoracic Oncol. 2015;10:444–5. [Google Scholar]
- Richards WG, Godleski JJ, Yeap BY, et al. Proposed adjustments to pathologic staging of epithelial malignant pleural mesothelioma based on analysis of 354 cases. Cancer. 2010;116:1510–17. doi: 10.1002/cncr.24886. [DOI] [PubMed] [Google Scholar]
- Sharaiha RZ, Halazun KJ, Mirza FP, et al. Elevated preoperative neutrophil: lymphocyte ratio as a predictor of postoperative disease recurrence in esophageal cancer. Ann Surg Oncol. 2011;18:3362–9. doi: 10.1245/s10434-011-1754-8. [DOI] [PMC free article] [PubMed] [Google Scholar]
- Shokralla HA, Gaafar R, Rahouma M. Pretreatment predictors of survival for malignant pleural mesothelioma, Asian academic research. J Multidiscip Healthc. 2016;3:258–66. [Google Scholar]
- Shokralla HA, Rahouma M. Prognostic clinico-pathological features of 99 cases advanced non-small cell lung cancer- Egyptian national cancer institute. Adv Lung Cancer. 2016;4:29–36. [Google Scholar]
- Shokralla HA, Rahouma M, Loay I, Gaafar R, Abdelrahman AM. PP01.38: Non-epithelial pleural mesothelioma;criteria, prognostic factors and predictors of response. Birmingham, UK: iMig2016.ORG. :95–96. [Google Scholar]
- Suzuki H, Asami K, Hirashima T, et al. Stratification of malignant pleural mesothelioma prognosis using recursive partitioning analysis. Lung. 2014;192:191–5. doi: 10.1007/s00408-013-9516-y. [DOI] [PubMed] [Google Scholar]
- Templeton AJ, McNamara MG, Šeruga B, et al. Prognostic role of neutrophil-to-lymphocyte ratio in solid tumors: a systematic review and meta-analysis. J Natl Cancer Inst. 2014;106:124. doi: 10.1093/jnci/dju124. [DOI] [PubMed] [Google Scholar]
- Vogelzang NJ, Rusthoven JJ, Symanowski J, et al. Phase III study of pemetrexed in combination with cisplatin versus cisplatin alone in patients with malignant pleural mesothelioma. J Clin Oncol. 2003;21:2636–44. doi: 10.1200/JCO.2003.11.136. [DOI] [PubMed] [Google Scholar]