

Abstract
The present study reports on the development of an innovative culture substrate, micro‐fabricated by two‐photon laser polymerization (2PP) in a hybrid organic–inorganic photoresin. It was previously demonstrated that this substrate is able to guide spontaneous homing and colonization of mesenchymal stromal cells by the presence of synthetic microniches. Here, the number of niches covering the culture substrate was increased up to 10% of the total surface. Human bone marrow‐derived mesenchymal stromal cells were expanded for 3 weeks and then their proliferation, clonogenic capacity and bilineage differentiation potential towards the osteogenic and adipogenic lineage were evaluated, both by colorimetric assays and by real‐time polymerase chain reaction. Compared with cells cultured on glass substrates, cells expanded on 2PP substrates showed a greater colony diameter, which is an index of clonogenic potential. Following medium conditioning on 2PP‐cultured cells, the expression of RUNX2 and BSP genes, as well as PPAR‐gamma, was significantly greater than that measured on glass controls. Thus, human cells expanded on the synthetic niche substrate maintained their proliferative potential, clonogenic capacity and bilineage differentiation potential more effectively than cells expanded on glass substrates and in some aspects were comparable to non‐expanded cells. © 2016 The Authors Journal of Tissue Engineering and Regenerative Medicine Published by John Wiley & Sons Ltd.
Keywords: Mesenchymal, stem cell, stem cell niche, mechanobiology, expansion, two‐photon polymerization
1. Introduction
The cellular environment is complex and plays an important role in cellular processes (Kress et al., 2012). For example, environmental cues have been shown to influence cell adhesion, proliferation and gene expression (Discher et al., 2005, 2009; Guilak et al., 2009). As a result, cell–substrate interactions are a key part of in vitro cell studies and researchers have used synthetic biomaterials to mimic the cellular microenvironment in terms of its physicochemical properties (Lutolf and Hubbell, 2005). Most of the culture substrates developed to investigate stem cell fate were based on two‐dimensional (2D) systems (e.g. microislands, micro/nanopatterned surfaces) (Nikkhah et al., 2012). Two‐dimensional cultures confine cells to a planar environment and restrict the more complex morphologies observed in vivo; moreover, cells are able to interact through a limited membrane segment with the underlying substrate and neighbouring cells (Nelson et al., 2005). Therefore, the mechanotransduction process and the interaction with nutrients, soluble factors and mechanical cues are altered (Tibbitt and Anseth, 2009). These considerations have led to an increasing interest in the development of scaffolds to mimic the native environment in which cells reside and grow (Kraehenbuehl et al., 2011). Different cell culture substrates have been developed, including nanofibres to mimic the architecture formed by fibrillary extracellular matrix (ECM) proteins (Nerurkar et al., 2011; Li et al., 2012) and hydrogels (Liu et al., 2010). Preliminary cell proliferation and differentiation studies have been performed. For example, a greater osteogenic commitment of rat mesenchymal stromal cells (MSCs) was observed in hydrogel compared with controls in the presence of osteoinductive medium (Naito et al., 2011). An important example of such artificial microenvironments for stem cell culture are the so‐called ‘synthetic niches’ (Peerani and Zandstra, 2010; Joddar and Ito, 2013). Synthetic niches can be defined as polymeric culture systems mimicking at least one aspect of the interactions between stem cells and the extra‐cellular surroundings, including biochemical factors (e.g. the delivery of soluble factors) and/or biophysical factors (e.g. substrate stiffness).
Most of the currently available approaches for scaffold fabrication, based on self‐assembly methods, do not allow for accurate control of the geometrical structure of the substrate, which might play a crucial role in the determination of stem cell fate (Nava et al., 2012). A novel technology that overcomes these limitations is two‐photon laser polymerization (2PP) (Maruo and Fourkas, 2008). This is a mask‐less direct laser writing technique that allows manufacturing arbitrary microarchitectures with a spatial resolution up to 100 nm, and thus better than the light diffraction limit. In 2PP, photopolymerization occurs by non‐linear two‐photon absorption induced by femtosecond laser pulses in transparent materials. In addition to active research into the synthesis of new, biocompatible and biodegradable materials (Claeyssens et al., 2009; Turunen et al., 2011; Ovsianikow et al., 2011), most groups have used hybrid inorganic–organic resins because they provide an excellent compromise between ease of use and mechanical robustness of the fabricated structures (Ovsianikov et al. 2012). Moreover, the biocompatibility of these materials has been extensively demonstrated (Raimondi et al., 2012; Danilevicius et al., 2013). “Several studies have been performed in the aim to investigate 2PP‐engineered scaffolds and cell behaviour, including adhesion, morphology, viability and proliferation (Ovsianikov et al., 2007; Tayalia et al., 2008; Correa et al., 2009; Malinauskas et al., 2010; Klein et al., 2011; Psycharakis et al., 2011; Kapyla et al., 2012; Terzaki et al., 2013; Marino et al., 2014, Marino et al., 2015).”
In previous works, ‘structurally’ biomimetic synthetic niches were developed for MSC culture (Raimondi et al., 2013, 2014; Nava et al., 2015). Evidence of spontaneous lineage commitment was observed in monolayer culture surrounding the structural niches, but not inside the niches, suggesting that structural niches were able to direct stem cell homing, proliferation and multipotency maintenance.
To investigate whether 2PP substrates are able to preserve cell multipotency and bilineage differential potential, a new substrate with approximately 400 niches per sample, covering 10% of the available culture surface, was designed and fabricated. This covering percentage is a good compromise between a reasonable micromachining time (the fabrication of each niche takes about 30 s) and a niche separation lower than the average distance of spontaneous aggregates on glass substrates (about 400–500 μm) (Raimondi et al., 2014). This improved layout allowed a larger niche‐cultured cell number of around 8000 cells per sample, compared with the average of 140 niche‐cultured cells per sample that was available in previous studies (Raimondi et al., 2013, 2014). The present paper reports on the effect of the 2PP substrates on human bone marrow‐derived MSC proliferation and differentiation.
2. Materials and methods
2.1. Two‐photon polymerization of samples
Microscaffolds (or ‘niches’) were directly two‐photon polymerized in the SZ2080 photoresist (Ovsianikov et al. 2008, 2012) with 1% concentration of Irg photoinitiator (Irgacure 369,2‐benzyl‐2‐dimethylamino‐1‐(4‐morpholinophenyl)‐butanone‐1) (Ciba Specialty Chemicals, Basel, Switzerland). The laser used for 2PP was a cavity‐dumped Yb:KYW system (Killi et al. 2005) producing pulses of 300 fs duration and 1 MHz repetition rate at a wavelength of 1030 nm, focused with a 1.4 numerical aperture (NA) oil immersion objective (Plan‐APOCHROMAT, ×100 oil immersion; Carl Zeiss, Oberkochen, Germany). Optimum fabrication conditions were 1.5 mm/s writing speed and 12 mW average power (before the objective). Computer‐controlled, three‐axis motion stages (ANT130; Aerotech, Pittsburgh, PA, USA) were used to translate the sample relative to the laser to form the desired microarchitectures. A total of 367 niches were laser written directly onto circular glass cover slips 150 μm thick and 12 mm diameter (BioOptika, Milan, Italy). To increase the niche surface to the glass ratio, a poly‐dimethylsiloxane (PDMS) (Sylgard; Dow Corning, Midland, Michigan, MI, USA) ring with 6‐mm inner diameter was ultraviolet (UV)‐bonded to the glass cover slips. As PDMS prevented cell proliferation, the resulting surface available for cell culture consisted of a circular area 6 mm in diameter (Figure 1a). Each niche was 30 μm high and 90 × 90 μm in transverse dimensions, and consisted of a lattice of interconnected lines, with a graded spacing between 10 and 30 μm transversely and a uniform spacing of 15 μm vertically. This was found in a previous study to be the optimum geometry for MSC homing and proliferation (Raimondi et al. 2013). Each niche was surrounded by four outer confinement walls formed by horizontal lines spaced at 5 μm, resulting in gaps of 1 μm (Figure 1c). The fabricated niches were imaged by scanning electron microscopy (SEM) (EVO 50 EP; Carl Zeiss). The thickness of the gold coating layer before SEM investigation was in the range 15–20 nm. All observations were carried out at 17.5 kV.
Figure 1.

The improved synthetic niche culture system fabricated by two‐photon laser polymerization (2PP). (a) Optical microscope image of the 2PP substrate. The number of engineered niches was increased from 7 to around 400 niches per sample, covering 10% of the available culture surface to obtain larger niche‐cultured cell numbers to perform quantitative analysis and functional assays. The relative distance between niches has been set at 300 μm. (b) Scanning electron microscopy (SEM) image of the synthetic niches forming 2PP substrates. (c) SEM image of a single synthetic niche. [Colour figure can be viewed at wileyonlinelibrary.com]
2.2. Cell isolation
Bone marrow aspirates were obtained from two healthy donors (18–65 years old) during routine orthopaedic surgical procedures, in accordance with the local ethical committee (University Hospital Basel, Basel, Switzerland) and after informed consent. Bone marrow aspirates were plated in standard flasks and cultured for a week in α‐minimal essential medium (α‐MEM) supplemented with 20% fetal bovine serum (FBS), 1% sodium pyruvate, 1% PSG (penicillin G and 0.1 mg/ml streptomycin sulphate) and 1% hydroxyethyl piperazineethanesulphonic acid (HEPES) buffer. Medium was changed regularly twice a week until confluence. The MSCs were recovered from bone marrow aspirates by their tendency to adhere tightly to plastic culture dishes and non‐adherent cells were then removed. Adherent cells were detached by trypsin‐ethylenediaminetetraacetic acid (EDTA), 0.5–0.2 g/l (Invitrogen, Carlsbad, CA, USA), counted and cryopreserved in α‐MEM supplemented with 20% FBS and 5% dimethylsulphoxide (DMSO) until use.
2.3. Substrate preparation and cell culture
The 2PP substrates were washed thoroughly, kept for 12 h in deionized water, disinfected for 12 h in 70% ethanol, washed repeatedly in sterile deionized water, dried and UV‐sterilized. Each sample was positioned inside a well of an Ultra‐Low Attachment 24 multiwell plate (Costar 3473; Corning, Corning, NY, USA). The cryopreserved cells were suspended in complete medium and seeded directly in the wells, at a density of 10 000 cells/cm2. Cells were incubated for 21 days, with medium freshly replaced twice a week. The complete medium consisted of α‐MEM supplemented with 20% FBS, 1% sodium pyruvate, 1% PSG and 1% HEPES buffer.
2.4. Biological analysis
To evaluate the ‘niche’ effect on proliferation and differentiation, cells were cultured on 2PP substrates and glass substrates. As a further control, cells expanded and then cryopreserved were introduced at passage 0 until use (hereafter P0 cells). At 3 weeks of culture, the cells were detached by trypsin–EDTA, 0.5–0.2 g/l and counted to perform several analysis as described in the following sections.
2.4.1. Optical and fluorescence confocal microscopy
Cells were imaged live in their wells by phase contrast every 3 days, using a standard inverted microscope (IX50; Olympus, Tokyo, Japan) equipped with a cooled high‐resolution video camera. To estimate the cell density on both 2PP and glass substrates, a further analysis was carried out by means of laser scanning confocal microscopy (A1R; Nikon, Tokyo, Japan). The cells were fixed in the wells in 2% paraformaldehyde, permeabilized and blocked with 0.2% Triton, 2% goat serum (GS) in phosphate‐buffered saline (PBS), and fluorescently marked. DNA was stained by incubation with 4′,6′‐diamidino‐2‐phenylindoledihydrochloride (DAPI) in solution at 10 μg/ml. Image acquisition was performed at ×20 and at ×60.
2.4.2. Clonogenic assays
To determine the colony‐forming efficiency, cells cultured for 3 weeks on 2PP and glass substrates were detached and replated at a density of 600 cells per 100 mm diameter Petri dish, and cultured in complete medium freshly replaced twice a week. After 2 weeks, cells were then washed with PBS, fixed with 3.7% formaldehyde in PBS, stained with Crystal Violet (Sigma, St.Louis, MO, USA) for 10 min, washed with tap water and the colonies were counted. All determinations were performed in triplicate and colony‐forming units–fibroblast (CFU‐f) frequency was determined by normalizing with respect to the number of seeded cells. The total number of clonogenic cells per sample was calculated by multiplying the percentage of CFU‐fs by the total number of cells detached and counted.
2.4.3. Real‐time polymerase chain reaction (PCR) assays
Total RNA was extracted from cells using TRIzol (Invitrogen), treated with DNAse and retrotranscribed into cDNA, as described previously (Frank et al., 2002). Real‐time PCR was performed with the ABIPrism 77000 Sequence Detection System (Perkin Elmer/Applied Biosystems, Rotkreuz, Switzerland). Expression levels of the genes of interest, namely the runt‐related transcription factor 2z (RUNX2) and bone sialoprotein (BSP) genes were assessed both on cells expanded for 3 weeks on the 2PP and glass substrates and after osteoinductive medium conditioning. The expression of the PPAR‐gamma gene was only evaluated on cells subjected to adipogenic medium conditioning. The expression of these target genes was normalized to the glyceraldehyde 3‐phosphate dehydrogenase housekeeping gene (GAPDH) rRNA. Primers and probe sets and PCR conditions for RUNX2, BSP, PPAR‐gamma and GAPDH were used as previously described (Frank et al., 2002).
2.4.4. In vitro adipogenic differentiation
Adipogenic differentiation was induced in 2D cultures as previously described (Barbero et al., 2003). Briefly, cells cultured for 3 weeks on 2PP substrates and glass substrates were detached and reseeded in six‐well plates at a density of 5000 cells/cm2. Cells were cultured in α‐MEM with 10% FBS until confluence. Medium was then supplemented with 10 mg/ml insulin, 10–5 m dexamethasone, 100 mm indomethacin and 500 mm 3‐isobutyl‐1‐methylxanthine (adipogenic induction medium) for 72 h and subsequently with 10 mg/ml insulin (adipogenic maintenance medium) for 24 h. This 96‐h cycle was repeated for four times. Cell layers were harvested for mRNA extraction and assessment of the expression of PPAR‐gamma or fixed in 60% isopropanol for 2 min and incubated with Oil Red‐O (Sigma) 0.1% in 60% isopropanol for 20 min. To determine the number of adipocytes, Oil Red‐positive cells were imaged in their wells in phase contrast and bright field, using a standard microscope (IX50; Olympus) and counted in 10 different fields. The dye was then solubilized in 100% isopropanol and the absorbance of the dissolved dye was determined at 500 nm with a spectrophotometer (SinergyH1; BioTek, Winooski, VT, USA).
2.4.5. In vitro osteogenic differentiation
Osteogenic differentiation was induced in 2D cultures as previously described (Jaiswal et al., 1997). Briefly, cells cultured for 3 weeks on 2PP substrates and glass substrates were detached and reseeded at a density of 5000 cells/cm2. Cells were cultured in α‐MEM supplemented with 10% FBS, 10 mm β‐glycerophosphate (Sigma), 10 nm dexamethasone (Sigma) and 0.1 mm l‐ascorbic acid‐2‐phosphate (Sigma) and cultured for 3 weeks, with medium changed twice per week. Cells layers cultured in osteogenic medium were harvested for mRNA extraction and RUNX2 and BSP expression assessment (see section 2.4.3), or washed twice with PBS, fixed for 10 min in 4% formalin and washed twice with water. Fixed cells were then incubated for 10 min with Alizarin Red 2% in distilled water and washed extensively with water.
2.5. Statistical analysis
After 3 weeks of culture, viable cells were quantified by two distinct methods: by using a standard Neubauer cytometer (trypsin count) and by fluorescence images (fluorescence image count) by visualization of the DAPI (blue) band, on each sample. The cell count was assessed visually by counting the cell nuclei in square regions of 100 × 100 μm2 using an inverted microscope (IX50; Olympus) on flat surfaces, and by confocal microscopy (A1R; Nikon) for those cells in the niches. The cell density was obtained by dividing the cell count of each region by the area of the square region. To compare the two counting methods, the cell density was calculated by normalizing the cell counts by the total seeded surface. The number of doubling, d, was calculated according to the formula:
| (1) |
where X f is the number of cells counted after trypsin detachment and X i is the number of cells seeded.
Results of the cell counts were assigned to experimental groups, based on the count location. In 2PP substrates, cells were counted in three areas: flat monolayer (i.e. region of the culture surface with low cell density), niche external walls and niche internal volume. In plain glass substrates, cells were counted in two areas: flat uncolonized monolayer and in regions of the culture surface where spontaneous aggregates formed (e.g. aggregate). All measurements are given as mean and standard deviation of triplicate samples, measured on experiments performed on each of the two donors. The mean value and the standard deviation were determined for each experimental group: P0 cells (i.e. cells expanded in complete medium and cryopreserved, 2PP substrates and glass substrates). The groups were compared using one‐way analysis of variance (ANOVA) for independent samples. Pair‐wise comparisons among groups were determined with a Tukey HSD test, or with Student t‐test for independent samples. Differences were considered to be significant if p < 0.05.
3. Results
3.1. Cell proliferation
Human bone marrow mesenchymal stem cell (BM‐MSC) proliferation was evaluated to estimate cell behaviour on 2PP substrates. After 3 weeks of culture, cells seeded on 2PP substrates proliferated on the glass surface surrounding synthetic niches and invaded the niches (Figure 2a,b). No aggregates formation was observed on the glass surrounding the niches. Conversely, formation of aggregates was observed on glass substrates (indicated by arrows in Figure 2c). To assess proliferation at 3 weeks of culture, cells were counted in 2PP substrates and glass substrates. Viable cells were quantified by two distinct methods: by using a standard Neubauer cytometer and by counting the DAPI‐labelled nuclei via fluorescence images. To compare the two counting methods, the cell density was calculated by normalizing the cell counts by the total seeded surface; no significant difference was found. The cell density calculated in 2PP substrates was (5.46 ± 0.51) × 104 cells/cm2. This value was significantly greater than the cell density calculated in glass substrates, (4.01 ± 1.51) × 104 cells/cm2 (Figure 3a).
Figure 2.

Human bone marrow‐derived mesenchymal stem cells cultured for 3 weeks on the two‐photon laser polymerization (2PP) substrate compared with glass substrate. Fluorescence 4′,6‐diamidino‐2‐phenylindole (DAPI)‐labelled pictures of (a) the 2PP substrate, (b) zoomed‐in view of the cell‐populated synthetic niche, and (c) glass substrate. The arrow shows a spontaneous aggregate on glass substrate. Bar: (a,c) 200 μm, (b) 30 μm. [Colour figure can be viewed at wileyonlinelibrary.com]
Figure 3.
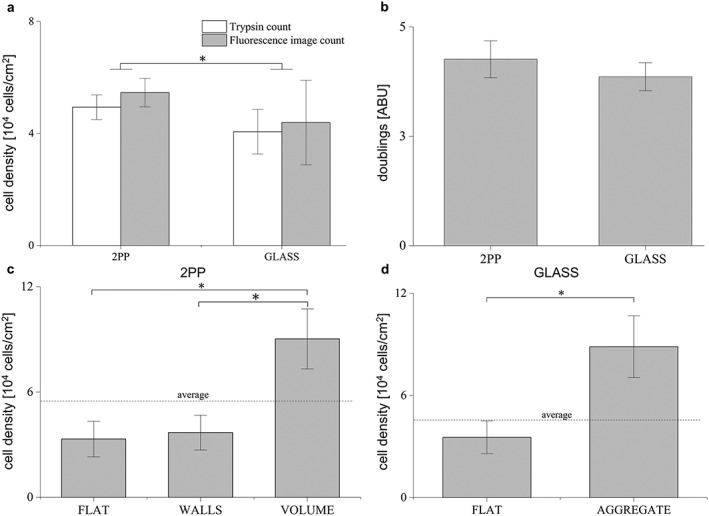
Results for human bone marrow‐derived mesenchymal stem cell counts. (a) Cell density diagrams calculated for two‐photon laser polymerization (2PP) substrates and glass substrates. Cell density was calculated by two methods: viable cells counted in a standard Neubauer cytometer and by fluorescence image count on 4′,6‐diamidino‐2‐phenylindole (DAPI)‐labelled pictures. (b) Cell doubling number calculated for 2PP substrates and glass substrates. (c) Cell density measured in 2PP substrates and (d) glass substrates via fluorescence image count at the distinct locations of the sample. *p < 0.01 for all pairwise comparisons
Cells cultured on 2PP substrates proliferated more than those cells cultured on glass substrates, as confirmed by the number of doublings calculated by means of Equation (1) (Figure 3b). Therefore, the cell density measurements (Figure 3a and dashed lines in Figure 3c,d) confirmed that 2PP engineered niches provide cells an increased surface‐to‐volume ratio and space to adhere and proliferate compared with glass substrates (Raimondi et al., 2014).
As the two counting methods provided the same results, we used the fluorescence image count method to describe how cells were spatially distributed in the 2PP substrates. As shown in Figure 2a,c and in Figure 3c, cells adhered onto the glass surface surrounding the niches. For such cells the density was (3.34 ± 1.01) × 104 cells/cm2, which is comparable to the cell density estimated in the flat uncolonized region in glass substrates (Figure 3d). The cell density estimated in the internal volume of the niches was (9.05 ± 1.68) × 104 cells/cm2. This result was not significantly different with respect to the cell density calculated in the aggregates that spontaneously formed on glass substrates, meaning that the 2PP substrates were also able to guide aggregate formation with human BM‐MSCs.
3.2. Clonogenic capacity
The clonogenic capacity was evaluated to assess whether human BM‐MSCs cultured on 2PP substrates maintained clonogenic properties more effectively than those cultured on glass substrates. For comparison, P0 cells were also introduced as a control. The MSCs cultured on 2PP substrates showed the same clonogenic capacity (22.17 ± 0.74%) when compared with P0 cells (22.56 ± 1.68%). Conversely, the clonogenic capacity for glass substrates was 20.89 ± 2.25% (Figure 4a). Accordingly, the total number of clonogenic cells at 3 weeks of culture in 2PP substrates was (11.8 ± 4.83) × 104 cells, greater than the one calculated for glass samples, (9.27 ± 4.85) × 104 cells (Figure 4b). As the cell doubling number was greater in 2PP substrates than the number calculated for glass substrates (Figure 3b), these results were rather interesting. Indeed, as the cell doubling increases, the proliferation ability increases, which may result in a reduction in the maintenance of multipotency. Furthermore, it is worth noting that these results included those cells anchored to the glass surface surrounding the niches in the 2PP substrates. Thus, those cells did not experience the niche environment.
Figure 4.

Results for human bone marrow‐derived mesenchymal stem cell clonogenic assays at 3 weeks of culture calculated for P0 cells (control), two‐photon laser polymerization (2PP) substrates and glass substrates. (a) Colony forming units (CFUs) percentage and (b) number of clonogenic cells (× 104cells). (c) CFU diameter and (d) frequency intensity histogram of colonies. All measurements are given as mean and standard deviation of n = 3 replicate samples, measured on experiments performed on each of the two donors. *p < 0.01 for all pairwise comparisons, except for **p < 0.05
Finally, the diameter of colonies were measured to assess the proliferative potential of the initiating clonogenic progenitor cells. As shown in Figure 4c, the mean colony diameter in 2PP‐cultured cells was 3.96 ± 0.98 mm, which was significantly greater than that measured in glass substrates (3.46 ± 0.90 mm). Differences were found between 2PP‐cultured cells and P0 cells that showed a mean colony diameter of 4.33 ± 0.91 mm (Figure 4c: *p < 0.01, **p < 0.05). To further evaluate whether 2PP substrates preserve clonogenic capacity more effectively than glass substrates the distribution of colony diameters for each culture condition was also plotted (Figure 4d). The most frequent colony diameter was 2–3 mm on the glass substrates while they were 4 mm on 2PP substrates, indicating a greater proliferative potential. Conversely, P0 cells showed the greatest proliferative potential among the experimental groups with the most frequent colony size being 5 mm.
3.3. Osteogenic lineage differentiation potential
To assess whether 2PP substrates affected human BM‐MSCs towards the osteogenic lineage, the expression of genes involved in the osteogenic commitment with no medium conditioning was evaluated. These results were compared with those obtained from cells cultured on glass substrates and P0 cells. The lowest expression for RUNX2 and BSP genes were observed for P0 cells. Cells cultured on 2PP substrates shown a lower RUNX2 and BSP gene expression compared with cells cultured on glass substrates for 3 weeks in the absence of chemical conditioning (Figure 5a,b).
Figure 5.

Results for human bone marrow‐derived mesenchymal stem cell osteogenic differentiation at 3 weeks of culture without osteogenic supplement. (a) RUNX2 gene expression and (b) BSP gene expression measured via polymerase chain reaction for P0 cells (control), 2PP‐cultured cells and glass‐cultured cells. The gene expression was normalized with respect the housekeeping gene GAPDH. All measurements are given as mean and standard deviation of n = 3 replicate samples, measured on experiments performed on each of the two donors. *p < 0.01 for all pair‐wise comparisons, except for **p < 0.05
3.4. In vitro adipogenic differentiation
In vitro adipogenic assays were performed to assess the adipogenic differentiation potential of human BM‐MSCs cultured for 3 weeks on 2PP substrates. A greater number of mature adipocytes was observed in P0 cells (Figure 6a,d) and in 2PP substrates (Figure 6b,e) compared with the ones on glass samples (Figure 6c,f). These findings were confirmed from the adipocyte counts for each culture substrate (Figure 6g). The diagram shows that the number of adipocytes in 2PP substrates (9.42 ± 1.73) was significantly greater (Figure 6g: *p < 0.01) than the one measured in glass substrates (4.67 ± 0.98). As expected, P0 cells showed the greatest differentiation potential towards adipogenic lineage in comparison with the other culture conditions (10.62 ± 1.89). The Oil Red‐O absorbance was measured for each sample and normalized with respect to the relevant unconditioned control to assess the cell commitment towards the adipogenic lineage. It was found that cells cultured on 2PP substrates exhibited a significantly greater absorbance (e.g. more solubilized Oil Red‐O dye) compared to cells cultured on glass substrates (Figure 6h: *p < 0.01, **p < 0.05), while, as expected, P0 cells show the greatest absorbance. Finally, to quantitatively assess the adipogenic commitment after medium conditioning, we evaluated PPAR‐gamma gene expression: greater expression was greater in P0 cells and 2PP‐cultured cells than in those cultured on glass substrates (Fig. 6i: *p < 0.01).
Figure 6.

Results for human bone marrow‐derived mesenchymal stems cell after adipogenic conditioning at 3 weeks of culture. Merged phase contrast pictures with Oil Red‐O staining of vacuoles in (a) P0 cells (control) and cells cultured on (b) two‐photon laser polymerization (2PP) substrates and on (c) glass substrates. Bar: 200 μm. Zoomed‐in view for Oil Red‐O stained vacuoles for (d) P0 cells, (e) 2PP‐cultured cells and (f) flat‐cultured cells Bar: 50 μm. (g) Adipocyte counts (per field) measured for P0, 2PP‐cultured and glass‐cultured cells. (h) Absorbance (λ = 500 nm) normalized with respect to the controls (unconditioned) for P0 cells, 2PP‐cultured and flat glass‐cultured cells. (i) PPAR‐gamma gene expression measured via polymerase chain reaction for P0 cells, 2PP‐cultured cells and glass‐cultured cells. The gene expression was normalized with respect the housekeeping gene GAPDH. *p < 0.01 for all pair‐wise comparisons, except for **p < 0.05. [Colour figure can be viewed at wileyonlinelibrary.com]
3.5. In vitro osteogenic differentiation
In vitro osteogenic assays were performed to assess the osteogenic differentiation potential of human BM‐MSCs cultured for 3 weeks on 2PP substrates. We observed no significant differences in terms of calcific deposition with the exception of cells cultured on glass substrates (Figure 7a–c). RUNX2 and BSP gene expression were evaluated to quantitatively assess the commitment of cells towards the osteogenic lineage after medium conditioning. Greater RUNX2 expression was observed in P0 cells and 2PP‐cultured cells than in those cultured on glass substrates (Figure 7d). The expression for BSP gene in 2PP‐cultured cells was significantly greater with respect to that measured for cells cultured on glass substrates. As expected, gene expression for both genes in P0 cells was the greatest (Figure 7d: *p < 0.01, **p < 0.05).
Figure 7.

Results for human bone marrow‐derived mesenchymal stems cells after osteogenic conditioning at 3 weeks of culture. Alizarin Red‐stained pictures of (a) P0 cells (control) and cells cultured on (b) two‐photon laser polymerization (2PP) substrates and (c) glass substrates. The scale bar is 200 μm. (d) RUNX2 gene expression and (e) BSP gene expression measured via polymerase chain reaction for P0 cells, 2PP‐cultured cells and flat‐cultured cells. The gene expression was normalized with respect the housekeeping gene GAPDH. All measurements are given as mean and standard deviation of n = 3 replicate samples, measured on experiments performed on each of the two donors. *p < 0.01 for all pair‐wise comparisons, except for **p < 0.05. [Colour figure can be viewed at wileyonlinelibrary.com]
4. Discussion
The present study demonstrated that human BM‐MSCs grown for 3 weeks on the 2PP substrates maintained multipotency and bilineage differentiation more effectively than cells cultured on glass substrates. The synthetic niche system was greatly improved, obtaining up to 10% coverage of the total surface (367 microstructures) (Figure 1a–c). Thanks to this improvement, a larger niche‐cultured cell number of around 8000 cells per sample could be obtained, compared with an average of 140 niche‐cultured cells per sample available in previous studies (Raimondi et al., 2013, 2014).
The present study confirmed previous findings in terms of proliferation in 2PP substrates. A significantly greater cell density in 2PP substrates were found compared with glass substrates (Figures 2a–c and 3a,b). Cell colonization within the niche volume by human BM‐MSCs (Figures 2b and 3c) was also demonstrated. Therefore, the 2PP niches provide an increased space for cells to adhere and proliferate and are also able to guide aggregate formation with human BM‐MSCs. It was proved that cells cultured on 2PP substrates maintained the same clonogenic capacity with respect to P0 cells. Moreover, more clonogenic cells were preserved in 2PP substrates compared with cells cultured on glass substrates (Figure 4a,b). An index of cell clonogenicity (e.g. the colony diameter) was found to be greater for cells cultured on 2PP substrates when compared with those cells cultured on glass substrates.
Furthermore, after 3 weeks of culture and in the absence of osteoinductive medium, the expression of the master regulator of osteoblastogenesis – RUNX2 (Wu et al., 2014) – in 2PP substrates proved to be significantly lower compared with its counterpart measured on glass substrates. Therefore, cells cultured on glass culture substrates spontaneously committed towards the osteogenic lineage (Figure 5a,b) (Engler et al., 2006; Nikkah et al., 2012). After osteoinductive medium conditioning, cells cultured on 2PP substrates exhibited a greater capability to differentiate towards the osteoblast lineage. Both RUNX2 and BSP gene level expressions were significantly greater than their counterparts measured on glass substrates (Figure 7). However, to be more comprehensive, other osteoblast lineage‐specific genes, such as type I collagen a1, alkaline phosphatase, osterix, osteocalcin, osteopontin and osteonectin will be considered in further studies. Moreover, in vitro adipogenic and osteogenic assays proved that 2PP‐cultured cells maintain bilineage potential more effectively than cells cultured onto glass substrates (Figures 6 and 7).
Cell multipotency by specific MSC surface markers was not investigated. However, MSC populations, obtained from most tissues commonly express a number of surface receptors including CD29, CD44, CD49a‐f, CD51, CD73, CD105, CD106, CD166 and Stro1, and lack expression of definitive haematopoietic lineage markers, including CD11b and CD14. Surface markers allow distinguishing between stemness lineages (e.g. mesenchymal from haematopoietic) but do not provide a measure of multipotency maintenance in cells pertaining to the same stemness lineage cultured in different conditions. For this reason, the ability of cells to differentiate into the various lineages (e.g. osteogenic and adipogenic) were investigated by means of standard functional biological tests rather than evaluating surface marker expression.
It is notable that the quantitative measurements provided in the present study were inevitably diluted by the cells deposited on the glass surface surrounding the niches; these did not experience the niche environment. As such cells could not be separated from those localized in the 2PP substrates for most of the analyses performed, the populations investigated were mixed, so that the observed differences were significant but not particularly substantial. Nevertheless, the differences in the bilineage differentiation potential between 2PP‐ and flat‐cultured cells pointed out to a ‘niche effect’ in decisions regarding MSC fate.
The measured ‘niche effect’ is unlikely be related to chemical interactions of cells with the niche material, because the niches are fabricated in an organically modified silicate, which has high stiffness (1–4 GPa) and, similar to glass (Koroleva et al., 2015), is chemically inert. The niche effect may more likely be related to the structural interaction between the cells and the porous niche architecture. It has been reported that the cell shape, actomyosin contractility, the nuclear architecture and its mechanics may play a key role in decisions about MSC fate (Thomas et al., 2002; Martins et al. 2012; Rangamani et al., 2013). In the present study, the niches favoured the aggregation of cells (Figures 2 and 3). Moreover, the pore size of such niches constrained cells to adhere and grow in a more isotropic state compared with those cells anchored to unpatterned glass surfaces. Thus, it was hypothesized that the physical/geometrical constraints to cells provided by the niches are a primary feature controlling cell fate.
Further investigations are needed in order to determine what proportion the ‘niche effect’ results from the tridimensionality of the niche architecture, and from the mechanical/chemical properties of the niche material. Specifically, experiments involving flat substrates made with the same material as the niches could allow separation of the architectural effects of the substrate on the determination of cell fate from the those related to the material properties.
5. Conclusion
In conclusion, despite the presence of the glass surface surrounding the niches that necessarily may dilute the results, it was demonstrated that 2PP‐cultured cells maintained clonogenic and differentiation potential more effectively than glass culture substrates in human MSC expansion. It is now planned to improve the culture system by increasing the percentage of glass surface covered by the niches, through elimination of the free surface between microstructures. This will allow an increase in the fraction of niche‐cultured cells, possibly enhancing the differences that were observed among the experimental groups tested. Moreover, this improvement will be necessary to prove the hypothesis that a three‐dimensional culture substrate able to guarantee isotropic cell adhesion is a fundamental stimulus, perhaps the primary stimulus, that allows maintenance of multipotency without medium supplement. Another improvement might consist in using the niche culture system as an in vitro model to study the bone marrow niche, by co‐culturing both the adherent and the non‐adherent cell fractions (e.g. the haematopoietic cells) in fresh bone marrow.
Conflict of interest
The authors have declared that there is no potential conflict of interest.
Acknowledgements
This project received funding from the European Research Council (ERC) under the European Union's Horizon 2020 research and innovation programme (NICHOID grant agreement No. 646990). These results reflect only the authors' view and the agency is not responsible for any use that may be made of the information contained.
Nava, M. M. , Di Maggio, N. , Zandrini, T. , Cerullo, G. , Osellame, R. , Martin, I. , and Raimondi, M. T. (2017) Synthetic niche substrates engineered via two‐photon laser polymerization for the expansion of human mesenchymal stromal cells. J Tissue Eng Regen Med, 11: 2836–2845. doi: 10.1002/term.2187.
References
- Barbero A, Ploegert S, Heberer M, Martin I. 2003; Plasticity of clonal populations of dedifferentiated adult human articular chondrocytes. Arthritis Rheum 48: 1315–1325. [DOI] [PubMed] [Google Scholar]
- Claeyssens F, Hasan EA, Gaidukeviciute A, et al 2009; Three‐dimensional biodegradable structures fabricated by two‐photon polymerization. Langmuir 25: 3219–3223. [DOI] [PubMed] [Google Scholar]
- Correa DS, Tayalia P, Cosendey G, et al 2009; Two‐photon polymerization for fabricating structures containing the biopolymer chitosan. J Nanosci Nanotechnol 9: 5845–5849. [DOI] [PubMed] [Google Scholar]
- Danilevicius P, Rekžtyte S, Balciunas E, et al 2013; Laser 3D micro‐nanofabrication of polymers for tissue engineering applications. Opt Laser Technol 45: 518–524. [Google Scholar]
- Discher D, Janmey P, Wang, Y‐L . 2005; Tissue cells feel and respond to the stiffness of their substrate. Science 310: 1139–1143. [DOI] [PubMed] [Google Scholar]
- Discher D, Mooney D, Zandstra P. 2009; Growth factors, matrices, and forces combine and control stem cells. Science 324: 1673–1677. [DOI] [PMC free article] [PubMed] [Google Scholar]
- Engler AJ, Sen S, Sweeney HL et al 2006; Matrix elasticity directs stem cell lineage specification. Cell 126: 677–689. [DOI] [PubMed] [Google Scholar]
- Frank O, Heim M, Jakob M, et al 2002; Real‐time quantitative RT‐PCR analysis of human bone marrow stromal cells during osteogenic differentiation in vitro . J Cell Biochem 85: 737–746. [DOI] [PubMed] [Google Scholar]
- Guilak F, Cohen D, Estes B, et al 2009; Control of stem cell fate by physical interactions with the extracellular matrix. Cell Stem Cell 5: 17–26. [DOI] [PMC free article] [PubMed] [Google Scholar]
- Jaiswal N, Haynesworth S, Caplan A, et al 1997; Osteogenic differentiation of purified, culture‐expanded human mesenchymal stem cells in vitro . J Cell Biochem 64: 295–312. [PubMed] [Google Scholar]
- Joddar B. & Ito Y. 2013; Artificial niche substrates for embryonic and induced pluripotent stem cell cultures. J Biotechnol 106: 218–228. [DOI] [PubMed] [Google Scholar]
- Kapyla E, Aydogan DB, Virjula S, et al 2012; Direct laser writing and geometrical analysis of scaffolds with designed pore architecture for three‐dimensional cell culturing. J Micromech Microeng 22: 115016. [Google Scholar]
- Killi A, Steinmann A, Dörring J, et al 2005; High‐peak‐power pulses from a cavity‐dumped Yb: KY(WO4)2 oscillator. Opt Lett 30: 1891–1893 [DOI] [PubMed] [Google Scholar]
- Koroleva A, Deiwick A, Nguyen A, et al 2015; Osteogenic differentiation of human mesenchymal stem cells in 3‐D Zr‐Si organic–inorganic scaffolds produced by two‐photon polymerization technique. PLoS One 10: e0118164. doi:10.1371/journal.pone.0118164 [DOI] [PMC free article] [PubMed] [Google Scholar]
- Kraehenbuehl T, Langer R, Ferreira L. 2011; Three‐dimensional biomaterials for the study of human pluripotent stem cells. Nat Methods 8: 731–736. [DOI] [PubMed] [Google Scholar]
- Kress S, Neumann A, Weyand B, et al 2012; Stem cell differentiation depending on different surfaces. Adv Biochem Eng Biotechnol 126: 263–283. [DOI] [PubMed] [Google Scholar]
- Klein F, Richter B, Striebel T, et al 2011; Two‐component polymer scaffolds for controlled three‐dimensional cell culture. Adv Mater 23: 1341–1345. [DOI] [PubMed] [Google Scholar]
- Li X, Liu H, Niu X, et al 2012; The use of carbon nanotubes to induce osteogenic differentiation of human adipose‐derived MSCs in vitro and ectopic bone formation in vivo . Biomaterials 33: 4818–4827. [DOI] [PubMed] [Google Scholar]
- Liu SQ, Tian Q, Hedrick JL, et al 2010; Biomimetic hydrogels for chondrogenic differentiation of human mesenchymal stem cells to neocartilage. Biomaterials 31:7298–7307. [DOI] [PubMed] [Google Scholar]
- Lutolf M, Hubbell J. 2005; Synthetic biomaterials as instructive extra‐cellular microenvironments for morphogenesis in tissue engineering. Nat. Biotechnol 23: 47–55. [DOI] [PubMed] [Google Scholar]
- Malinauskas M, Danilevicius P, Baltriukiene D, et al 2010; 3D artificial polymeric scaffolds for stem cell growth fabricated by femtosecond laser. Lithuan J Phys 50: 75–82. [Google Scholar]
- Marino A, Filippeschi C, Genchi GG, et al 2014; The Osteoprint: a bioinspired two‐photon polymerized 3‐D structure for the enhancement of bone‐like cell differentiation. Acta Biomater 10: 4304–4313. [DOI] [PubMed] [Google Scholar]
- Marino A, Filippeschi C, Mattoli V, et al 2015; Biomimicry at the nanoscale: current research and perspectives of two‐photon polymerization. Nanoscale 7: 2841–2850. [DOI] [PubMed] [Google Scholar]
- Martins RP, Finan JD, Guilak F, et al 2012; Mechanical regulation of nuclear structure and function. Annu Rev Biomed Eng 14: 431–455. [DOI] [PMC free article] [PubMed] [Google Scholar]
- Maruo S. & Fourkas J.. 2008; Recent progress in multiphoton microfabrication. Opt Lett 2: 100–111. [Google Scholar]
- Naito H, Dohi Y, Zimmermann W, et al 2011; The effect of mesenchymal stem cell osteoblastic differentiation on the mechanical properties of engineered bone‐like tissue. Tissue Eng Part A 17: 2321–2329. [DOI] [PubMed] [Google Scholar]
- Nava MM, Raimondi M, Pietrabissa R. 2012; Controlling self‐renewal and differentiation of stem cells via mechanical cues. J Biomed Biotechnol 1–12 797410. [DOI] [PMC free article] [PubMed] [Google Scholar]
- Nava MM, Raimondi MT, Credi C, et al 2015; Interactions between structural and chemical biomimetism in synthetic stem cell niches. Biomed Mater 10: 015012. [DOI] [PubMed] [Google Scholar]
- Nelson C, Jean R, Tan J, et al 2005; Emergent patterns of growth controlled by multicellular form and mechanics. Proc Natl Acad Sci U S A 102: 11594–11599. [DOI] [PMC free article] [PubMed] [Google Scholar]
- Nerurkar N, Han W, Mauck R, et al 2011; Homologous structure–function relationships between native fibrocartilage and tissue engineered from MSC‐seeded nanofibrous scaffolds. Biomaterials 32: 461–468. [DOI] [PMC free article] [PubMed] [Google Scholar]
- Nikkhah M, Edalat F, Manoucheri S, et al 2012; Engineering microscale topographies to control the cell–substrate interface. Biomaterials 33: 5230–5246. [DOI] [PMC free article] [PubMed] [Google Scholar]
- Ovsianikov A, Schlie S, Ngezahayo A, et al 2007; Two‐photon polymerization technique for microfabrication of CAD‐designed 3D scaffolds from commercially available photosensitive materials. J Tissue Eng Regen. Med 1: 443–449. [DOI] [PubMed] [Google Scholar]
- Ovsianikov A, Viertl J, Chichkov B, et al. 2008; Ultra‐low shrinkage hybrid photosensitive material for two‐photon polymerization microfabrication. ACS Nano 2: 2257–2262 [DOI] [PubMed] [Google Scholar]
- Ovsianikov A, Malinauskas M, Schlie S, et al 2011; Three‐dimensional laser micro‐ and nano‐structuring of acrylated poly(ethylene glycol) materials and evaluation of their cytoxicity for tissue engineering applications. Acta Biomater 7: 967–974. [DOI] [PMC free article] [PubMed] [Google Scholar]
- Ovsianikov A, Mironov V, Stampfl J, Liska R. 2012; Engineering 3D cell‐culture matrices: Multiphoton processing technologies for biological and tissue engineering applications. Expert Rev Med Devices 9: 613–633. [DOI] [PubMed] [Google Scholar]
- Peerani R, Zandstra P. 2010; Enabling stem cell therapies through synthetic stem cell niche engineering. J Clin Invest 120: 60–70. [DOI] [PMC free article] [PubMed] [Google Scholar]
- Psycharakis S, Tosca A, Melissinaki V, et al 2011; Tailor‐made three‐dimensional hybrid scaffolds for cell cultures. Biomed. Mater 6: 045008. [DOI] [PubMed] [Google Scholar]
- Raimondi MT, Eaton S, Nava MM, et al 2012; Two‐photon laser polymerization: from fundamentals to biomedical application in tissue engineering and regenerative medicine. J Appl Biomater Function Mater 10: 56–66. [DOI] [PubMed] [Google Scholar]
- Raimondi MT, Eaton S, Laganà M, et al 2013; 3D structural niches engineered via two‐photon laser polymerization promote stem cell homing. Acta Biomater 9: 4579–4584. [DOI] [PubMed] [Google Scholar]
- Raimondi MT, Nava MM, Eaton S, et al 2014; Optimization of femtosecond laser polymerized structural niches to control mesenchymal stromal cell fate in culture. Micromachines 5: 341–358. [Google Scholar]
- Rangamani P, Lipshtat A, Azeloglu EU, et al 2013; Decoding information in cell shape. Cell 154: 1356–1369. [DOI] [PMC free article] [PubMed] [Google Scholar]
- Tayalia P, Mendonca CR, Baldacchini T, et al 2008; 3D cell‐migration studies using two‐photon engineered polymer scaffolds. Adv Mater 20: 4494–4498. [Google Scholar]
- Terzaki K, Kissamitaki M, Skarmoutsou A, et al 2013; Pre‐osteoblastic cell response on three‐dimensional, organic–inorganic hybrid material scaffolds for bone tissue engineering. J Biomed Mater Res Part A 101: 2283–2294. [DOI] [PubMed] [Google Scholar]
- Thomas C, Collier J, Sfeir C, et al 2002; Engineering gene expression and protein synthesis by modulation of nuclear shape. Proc Natl Acad Sci U S A 99: 1972–1977. [DOI] [PMC free article] [PubMed] [Google Scholar]
- Tibbitt M. & Anseth K.. 2009; Hydrogels as extracellular matrix mimics for 3D cell culture. Biotechnol Bioeng 103: 655–663. [DOI] [PMC free article] [PubMed] [Google Scholar]
- Turunen S, Käpylä E, Terzaki K, Viitanen J, Fotakis C, Kellomäki M, Farsari, M . 2011; Pico‐ and femtosecond laser‐induced crosslinking of protein microstructures: evaluation of processability and bioactivity. Biofabrication 3: 045002. [DOI] [PubMed] [Google Scholar]
- Wu H, Whitfield TW, Gordon JAR, et al 2014; Genomic occupancy of Runx2 with global expression profiling identifies a novel dimension to control of osteoblastogenesis. Genome Biol 15: R52. [DOI] [PMC free article] [PubMed] [Google Scholar]