

Abstract
Studies using advanced toxicological methods enabling in vitro conditions that are more realistic are currently needed for understanding the risks of pulmonary exposure to airborne nanoparticles. Owing to the carcinogenicity of certain nickel compounds, the increased production of nickel nanoparticles (Ni‐NPs) raises occupational safety concerns. The aim of this study was to investigate the genotoxicity of airborne Ni‐NPs using a recently developed air–liquid interface exposure system. The wild‐type Chinese hamster lung fibroblast cell line (V79) was used and cytotoxicity, DNA damage and mutagenicity were studied by testing colony forming efficiency, alkaline DNA unwinding and HPRT mutation assays, respectively. Additionally, co‐exposure to a PARP‐1 inhibitor was performed to test possible involvement of base excision repair (BER) in repair of Ni‐induced DNA damage. The results showed that cell viability was reduced significantly (to 45% and 46%) after 48 hours Ni‐NP exposure at concentrations of 0.15 and 0.32 μg cm−2. DNA damage was significantly increased after Ni‐NP exposure in the presence of the BER inhibitor indicating that Ni‐NP‐induced DNA damages are subsequently repaired by BER. Furthermore, there was no increased HPRT mutation frequency following Ni‐NP exposure. In conclusion, this study shows that Ni‐NP treatment of lung fibroblasts in an air–liquid interface system that mimics real‐life exposure, results in increased DNA strand breaks and reduced cellular viability. These DNA lesions were repaired with BER in an error‐free manner without resulting in mutations. This study also underlines the importance of appropriate quantification of the actual exposure concentrations during air–liquid interface exposure studies.
Keywords: air–liquid interface, alkaline DNA unwinding, DNA damage, HPRT, nanotoxicology, SB
Short abstract
The aim of this study was to investigate the genotoxicity of airborne Ni nanoparticles using a recently developed air‐liquid interface exposure system that mimics real‐life exposure. Cytotoxicity, DNA damage and mutagenicity were in the V79 cell line. Ni nanoparticle exposure of the cells in the air‐liquid interface resulted in increased DNA strand breaks and reduced cellular viability at concentrations of 0.15 and 0.32 μg cm −2. These DNA lesions were repaired with BER in an error‐free manner without resulting in mutations
1. INTRODUCTION
Occupational exposure to Ni compounds is well known to increase the risk for several diseases, such as cancer (Andersen, Berge, Engeland, & Norseth, 1996; Field & Withers, 2012; Grimsrud, Berge, Haldorsen, & Andersen, 2002; IARC, 1990; NTP, 1996). However, the risks related to Ni nanoparticle (Ni‐NP) exposure are currently not completely understood. Because inhalation constitutes a significant exposure route for airborne NPs (ICRP, 1994), the toxicological methods should take into account the specific characteristics of this route. Several in vitro methods, based on air–liquid interface (ALI) exposure, have been described that better resemble the exposure conditions in the human lung than the traditional submerged assays (Kim, Peters, O'Shaughnessy, Adamcakova‐Dodd, & Thorne, 2013; Lenz et al., 2009; Paur et al., 2011; Savi et al., 2008). Despite this development, there are presently no published records of using these methods to obtain toxicological data on Ni‐NPs.
The mechanisms leading to Ni carcinogenesis have been extensively studied and yet clear conclusions have not been established. For example, different forms of Ni have been shown to cause both genetic and epigenetic effects in cells (Kasprzak, Sunderman, & Salnikow, 2003). However, rather than Ni being directly mutagenic, these outcomes are thought to result from the interference of Ni with other intracellular targets and processes, such as proteins, inflammation and proliferation (Efremenko, Campbell, Dodd, Oller, & Clewell, 2014; Hartwig, 1995; IARC, 1990; Kasprzak et al., 2003). Intracellular Ni has also been found to interfere with DNA repair by inhibiting DNA repair processes and thus resulting in indirect mutations (Beyersmann & Hartwig, 2008; Chiou et al., 2014). Furthermore, Ni ions have been described to induce intrachromosomal homologous recombination in the hprt gene of V79 cells possibly due to DNA repair inhibition (Helleday, Nilsson, & Jenssen, 2000). As a possible mechanism, an altered cellular redox balance by Ni and the subsequent effects on DNA repair machinery, such as nucleotide and base excision repair (BER), has been suggested (Hartwig et al., 2002).
Poly(ADP‐ribose) polymerase (PARP‐1) is a zinc‐finger protein, which due to its function in DNA damage repair as well as DNA replication and transcription (d'Amours, Desnoyers, d'Silva, & Poirier, 1999) has a central role in maintaining genome integrity (de Murcia et al., 1997; Horton, Stefanick, Kedar, & Wilson, 2007). Chemical inhibitors, such as 4‐amino‐1,8‐naphtalimide (4ANI), can inhibit PARP‐1 activity (d'Amours et al., 1999; de Murcia et al., 1997). Furthermore, some NPs have been suspected of disturbing other zinc‐finger proteins (Kain, Karlsson, & Möller, 2012). As the inactivity of PARP‐1 leads further to the inhibition of BER (Satoh & Lindahl, 1992), chemical PARP‐1 inhibitors can be used to study the involvement of BER in cellular responses to DNA damaging agents (Aguilar‐Quesada et al., 2007). As BER is involved in the repair of DNA single strand breaks (SB), as well as DNA alkylation and oxidation (d'Amours et al., 1999), PARP‐1 inhibition allows examining the induction of these DNA damage types.
The aim of this study was to assess the genotoxic properties of freshly generated airborne Ni‐NPs by using a recently developed electrostatic ALI exposure system. The effects of Ni‐NP exposure on cell viability, DNA damage, BER activity and mutation frequency (MF) were studied. Chinese hamster lung fibroblast cells (V79) (Ford & Yerganian, 1958) were chosen for this study due to the suitability of this cell line for the HPRT mutation assay (Nestmann, Brillinger, Gilman, Rudd, & Swierenga, 1991). Owing to the previously shown effects of low Ni concentrations (Latvala et al., 2016a), and the possibility for concentration‐specific mechanisms, this study was focused on investigating low exposure concentrations of Ni‐NPs.
2. MATERIALS AND METHODS
2.1. Cell culture
V79 cells (Thompson LH) were cultured in Dulbecco's modified Eagle's medium (DMEM; reference no. 31885–023, lot no. 1706549; Gibco® by Life Technologies, Gaithersburg, USA), which was supplemented with 10% fetal bovine serum (reference no. 10270–106, lot no. 42G955IK; Gibco® by Life Technologies), 100 units ml−1 penicillin and 100 μg ml−1 streptomycin (Pen Strep; Gibco® by Life Technologies). Supplemented DMEM is here denoted DMEM+. Cells were cultured in cell culture flasks in a humidified (<99% relative humidity; 37°C) cell incubator with CO2 atmosphere (5 vol%). Cells for the exposures were seeded in BD Falcon™ (New York, USA) cell culture inserts (cat. no. 353493, with 0.4 μm pore size and pore density of 1 × 10⁸ pores cm−2).
2.2. Particle exposure
Airborne Ni‐NPs were generated by electrode evaporation–condensation mechanism with spark discharge (Schwyn, Garwin, & Schmidt‐Ott, 1988). The discharge from Ni electrodes (Goodfellow, Coraopolis, USA, purity >99.99%) was done in a spark discharger (DNP Digital 3000; Palas GmbH, Karlsruhe, Germany) using constant N2 flow (99.996 vol%, 3000 ml min−1). The aerosol containing the Ni‐NPs was conditioned with O2 (20 vol%) and CO2 (5 vol%), and humidified using a gas humidifier (MH‐110‐12S‐4; Perma Pure LLC, Lakewood, NJ, USA) before reaching the ALI exposure chambers.
Based on a previous optimization study of the ALI system (Latvala et al., 2016b), aerosol flow rate of 214 ml min−1 and applied electrostatic field strength of ±1 kV were chosen for all experiments. The aerosol flow rate was controlled with a separate airflow controller (critical orifice) for each of the six exposure chambers. The applied electrostatic field between the aerosol inlet and a metal plate underneath the exposure chambers alternated between a positive and a negative charge (±1 kV) at a frequency of 0.24 Hz and enabled deposition of NPs on cell cultures. Further details of the exposure system set‐up and parameters are presented in a previous study (Latvala et al., 2016b).
Each exposure chamber included one cell culture insert with a total cell surface area of 4.2 cm2. Cells were exposed to airborne Ni‐NPs in the ALI system from the apical side and the cells were kept in the ALI system for 1, 1.5 or 2 hours. Simultaneous negative control treatments (clean air exposure) were obtained by removing all particles from the aerosol entering into two of the exposure chambers by two separate hydrophobic filters (Headline filters; In‐line filter; Grade DIF‐LN40). The four remaining exposure chambers received the Ni‐NPs in a non‐filtered aerosol. During each exposure, two inserts were kept in the cell incubator as additional negative controls. After each experiment, two of the Ni‐NP exposed inserts and one control insert were used for quantification of Ni‐NP deposition, while the remaining inserts were used for the toxicological assays.
2.3. Particle size distributions
Particle size distributions bb were measured with a differential mobility particle sizer (DMPS). The DMPS consists of a differential mobility analyzer measuring the electrical mobility diameter of the particles (detection interval 20–800 nm) and a condensation particle counter (model 3022; TSI GmbH, Aachen, Germany). The size distribution was measured downstream of the ALI exposure system without an applied field strength (which gave no particle deposition on the cells), and at ±1 kV (which enabled particle deposition). Before reaching the ALI exposure system and the DMPS, the aerosol passed through a bipolar charger for the aerosol to have an equilibrium charge distribution to enable deposition in the ALI exposure system and size distribution analysis in the DMPS. To ensure reproducible aerosol concentrations, the particle size distributions were monitored during each experiment.
2.4. Quantification of nickel exposure
Before the cell exposures, tests to find out how Ni‐NP deposition should be quantified were performed. According to our previous publication, the quantification method (gravimetric vs. chemical) or the presence of cells during the deposition can affect the amount of measured Ag‐NPs (Latvala et al., 2016b). Therefore, we compared two commonly used methods for determining particle deposition: gravimetric weighing of the deposited particle mass and chemical analysis of deposited Ni by inductively coupled plasma mass spectrometry (ICP‐MS). The purpose of this comparison was to assess whether Ni‐NP deposition in the ALI system is affected by the conditions during exposure of cell cultures, when compared to empty transwell membranes and whether the gravimetric method is suitable for quantifying exposure.
Before Ni‐NP exposure of the cell‐free inserts, the insert membranes were cut out and their mass was determined gravimetrically (Mettler Toledo MT5, Columbus, USA, precision: 1 μg). The membranes were conditioned in a room with controlled temperature (20 ± 0.5°C) and relative humidity (50 ± 2%) for 24 hours before weighing. Directly after weighing, the membranes were placed on top of the membranes of new and intact cell culture inserts, after which they were exposed to Ni‐NPs for 1 or 2 hours. After exposure, the conditioning and weighing was repeated.
After exposing V79 cells to Ni‐NPs for 1 or 2 hours, the total amount of cellular Ni was determined with ICP‐MS (iCAP Q; Thermo Scientific, Waltham, MA, USA). After Ni‐NP exposure, the cell culture insert membranes were cut out and placed into plastic tubes with 6 ml of 32.5 vol% HNO3 (Suprapur; Sigma‐Aldrich, Darmstadt, Germany). Triplicate samples were analyzed for each exposure time. The ICP‐MS method was calibrated with Ni standard solutions at concentrations of 0.1, 0.5, 1, 5, 10, 50, 100 and 500 μg l−1 in 5% HNO3. Indium and rhodium (5 μg l−1) were used as internal standards in all Ni standards and samples. Before the analysis, the samples were diluted with MilliQ water (18.2 MΩcm) to reach a 5% HNO3 concentration. Triplicate readings of each sample were recorded with the kinetic energy discrimination mode. The relative standard deviation acceptance between readings was 20%. A blank and a Ni standard sample were run after every 10 samples to control the quality of quantification. The final Ni concentrations are based on the average concentrations measured for the two most abundant isotopes 58Ni and 60Ni. All results were blank‐corrected by subtracting the average Ni value of three blank samples from the measured concentration of each sample. The limit of detection for Ni was 0.02 μg l−1.
Additionally, the ICP‐MS method was used for quantifying the Ni exposure after each ALI treatment for the colony forming efficiency (CFE) and HPRT mutation assays. In this case, two of the four Ni‐NP treated cell culture inserts were analyzed for total Ni concentrations.
2.5. DNA strand breaks
The alkaline DNA unwinding technique was used for assessing the number of SBs in cellular DNA (Erixon & Ahnstrom, 1979). This method utilizes the separation of DNA strands by unwinding them in an alkaline environment starting from DNA SBs and continuing until encountering unwinding of another SB or, e.g., an interstrand cross‐link (Vare, Johansson, Persson, Erixon, & Jenssen, 2014). DNA is labeled with thymidine [methyl‐3H] (lot no. 201204, 6.7 Ci mmol−1 [0.248 TBq mmol−1]; PerkinElmer, Shelton, USA) before the aerosol treatment and the obtained fraction of labeled single‐stranded DNA (ssDNA) corresponds to the amount of SBs per cell.
Cells (2 × 10⁵) were seeded in culture inserts and cultured 24 hours at 37°C in 5% CO2 with 3 ml of DMEM+ in the basal chamber and 2 ml on the apical side. DNA was labeled by incubating the cells for 24 hours in thymidine [methyl‐3H] diluted in DMEM+ (250 times). Thereafter, the media were removed and the cells were incubated in 5 ml of fresh DMEM+ for 30 minutes (in 37°C and 5% CO2). In half of the cell culture inserts, 9 μl of 4ANI (1 mm) was added and incubated for 30 minutes (in 37°C and 5% CO2) before exposure. The inhibitor controls were only exposed to clean air (without any particles) in the ALI exposure system. During the aerosol treatment (see Section 2.2 for further details), the cell culture inserts were kept in the ALI system with 3 ml DMEM+ on the basal side of the insert. The exposure was terminated directly after being removed from the ALI exposure system by transferring the inserts into a six well plate and washing the cells in 2.5 ml of ice‐cold NaCl (0.15 m). The alkali treatment was performed after removing the wash by adding 2.5 ml of NaOH (0.03 m in 1 m NaCl) in each insert. The plate was incubated in the dark for 30 minutes at room temperature. The samples were neutralized by adding 5 ml of NaH2PO4 (0.02 m) in each insert. To obtain small fragments of DNA, the samples were probe‐sonicated for 20 seconds, after which 250 μl of sodium dodecyl sulfate (7.5%) was added. The samples were stored in −20°C until they were eluted.
For separating the ssDNA and double‐stranded DNA, the samples were eluted using hydroxyapatite chromatography (0.25 g; DNA Grade, Bio‐Gel® HTP Gel, catalog no. 130–0520; Bio‐Rad, Hercules, USA) in glass columns mounted in a thermostatic aluminum block. The columns were kept at 60 ± 2°C during the elution. Before eluting the samples, they were thawed in a warm water bath. The glass columns were washed with 2 ml of potassium phosphate (0.5 m) followed by 4 ml of sodium phosphate (0.01 m), to remove possible remaining products of earlier samples. The samples were diluted with 1 ml of MilliQ water and 3 ml of the samples were added in to the glass columns. The sample liquid was eluted and the columns were washed with 4.5 ml of sodium phosphate (0.01 m). The ssDNA was eluted using 4.25 ml of potassium phosphate (0.10 m) and collected in scintillation vials, after which the double‐stranded DNA was eluted with 4.25 ml potassium phosphate (0.25 m) into new scintillation vials. Scintillation solution (10 ml; Ultima Gold™ XR, lot no. 79–14411, catalog no. 6013119; PerkinElmer) was added to the samples and the vials were mixed with vortex (10 seconds). The radioactive decay of 3H in the samples was then counted in a scintillation counter (PerkinElmer Liquid Scintillation Analyzer Tri‐Carb 2810 TR) using QuantaSmart software (Tri‐Carb LSC software, version 4.0; PerkinElmer). The amount of DNA SBs was then calculated.
2.6. HPRT mutations
The HPRT gene mutation assay can be used to assess the induction of mutations and acute toxicity in V79 cells (Jenssen, 1984). The CFE test of surviving cells is performed 48 hours after the beginning of the treatment and the number of mutated cells (mutation in the hprt gene) is analyzed by a selection performed 7 days after the end of treatment. The selection of the mutated phenotype is done by culturing the cells in cell medium containing 2‐amino‐6‐mercaptopurine (6‐TG) (Jenssen, 1984).
To reduce the amount of background mutations HAzT (hypoxanthine, l‐azaserine, thymidine) was added to the cell media before the seeding of cells. The HAzT treatment was performed by culturing the cells for 4 days in a mixture of DMEM+ and 6.8 μg ml−1 of hypoxanthine (Sigma‐Aldrich), 1.73 μg ml−1 of l‐azaserine (Sigma‐Aldrich) and 1.21 μg ml−1 of thymidine (Sigma‐Aldrich). After the HAzT selection, 105 cells were seeded in cell culture inserts. They were cultured for 24 hours with 3 ml of DMEM+ in the basal chamber and 2 ml on the apical side. The aerosol treatments in the ALI system were performed as described for the alkaline DNA unwinding assay. After the aerosol treatment the Ni‐NP exposure was continued for 48 hours by keeping the cell culture inserts in six well plates with 1.5 ml of DMEM+ on the basal side in the cell incubator (<99% relative humidity; 37°C; 5 vol% CO2). (±)‐anti‐11,12‐dihydroxy‐13,14‐epoxy‐11,12,13,14‐tetrahydro‐dibenzo[a,l]pyrene (DBPDE) was used as a positive control for the HPRT assay. The stock solution (from a previously synthesized stock, see Lagerqvist et al., 2008) was dissolved in dimethyl sulfoxide (Scharlau, Barcelona, Spain). The cells were exposed to DBPDE for 4 hours Hank's balanced salt solution (HBSS2+), after which the exposure solution was removed and the cells were further cultured in DMEM+ for 48 hours, as for cells exposed to Ni‐NP.
After the exposure, the cells were washed with HBSS− without CaCl2 and MgCl2 (reference no. 14170–088, lot no. 1592126; Gibco® by Life Technologies) supplemented with 0.01 m HEPES buffer (reference no. 15630–056, lot no. 1038414; Gibco® by Life Technologies). They were trypsinized and reseeded in Petri dishes (10 cm diameter) and cell culture flasks (75 cm2) for cytotoxicity and mutation tests, respectively. The cytotoxicity was determined by seeding 200 cells in 10 ml of DMEM+ in two Petri dishes per treatment and culturing them for 7 days, after which the cells were fixed in a solution of methylene blue in methanol (4 g l−1) and the colonies were counted. The results for cytotoxicity were calculated as a percentage of the control (relative cytotoxicity).
For the mutation test, two cell culture flasks per treatment group were seeded with 2 × 10⁵ cells and cultured in DMEM+ for 7 days. The cells from the same treatment groups were pooled and reseeded on Petri dishes for CFE testing and HPRT selection. The CFE was determined by seeding 200 cells in 10 ml of DMEM+ in two Petri dishes per treatment. For HPRT selection, three dishes with 105 cells were seeded per treatment. The selection of mutated clones was performed in 6‐TG (approximately 98%, lot no. 119F4024; Sigma‐Aldrich) at a concentration of 5 μg/ml in DMEM+. All dishes were cultured for 7 days, after which the colonies were fixed and counted. The MFs were calculated as the number of mutant (6‐TG resistant) colonies per 106 cloning cells, based on the CFE (Lagerqvist et al., 2008).
2.7. Statistical analysis
Statistical analyses were performed in R (version 3.1.1, R Core Team 2014) using one‐way ANOVA and Tukey's HSD test. When the assumptions of ANOVA were not met (MF data), the non‐parametric Kruskal–Wallis test was used instead. A statistical significance level of P < .05 was chosen.
3. RESULTS
3.1. Particle size distribution of nickel nanoparticles
Particle size distribution of the polydisperse Ni‐NP aerosol was measured before each cell exposure experiment. No particle deposition occurred without applied electrostatic field strength, whereas deposition was facilitated by applying a voltage of ±1 kV (Figure 1). The particle geometric mean diameter was 35 nm with a geometric standard deviation of 1.5 at 0 kV, and at ±1 kV the geometric mean diameter and geometric standard deviation were 40 nm and 1.4, respectively. The concentration downstream of the ALI exposure system was originally 4.5 × 10⁶ particles cm−3, decreasing to 1.7 × 10⁵ particles cm−3 after applying the electrostatic field strength of ±1 kV.
Figure 1.
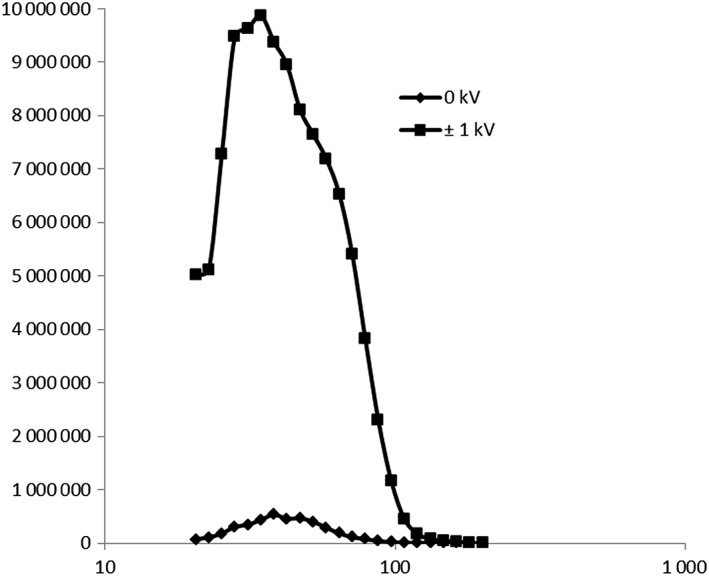
Particle size distribution of the aerosol containing freshly generated Ni nanoparticles measured using a differential mobility particle sizer after exiting the air–liquid interface exposure system. Before applying an electrostatic field the geometric mean diameters of the aerosol was 35 nm, the geometric standard deviation was 1.5 and the particle concentration was 4.5 × 10⁶, and at ±1 kV these particle size distribution characteristics were 40 nm, 1.4 and 1.7 × 10⁵ particles cm−3
3.2. Quantification of nickel exposure
The total amount of Ni deposited on cell culture inserts with and without cells after 1 and 2 hours exposure to Ni‐NPs is presented in Figure 2. The cell‐free inserts were analyzed gravimetrically, whereas the cell‐containing inserts were analyzed chemically with ICP‐MS. The simpler and less laborious gravimetrical method was used for pre‐screening possible exposure concentrations. The suitability of this method was then investigated by using cell‐containing inserts at the same conditions as the actual exposures were to be performed. The total Ni mass was 2.1 μg cm−2 after 1 hour deposition on the cell‐free inserts and 5.7 μg cm−2 after 2 hours. When the deposition was performed on cell‐containing inserts the average total Ni mass was 0.1 μg cm−2 after 1 hour and 0.4 μg cm−2 after 2 hours. Based on these experiments, it was apparent that the dose could not be approximated from gravimetrical analysis of dry inserts and the ICP‐MS method was chosen for the quantification of Ni exposure during the HPRT assay (Table 1).
Figure 2.

Total amount of Ni deposited on cell culture inserts with and without cells after 1 and 2 h exposure to Ni nanoparticles. Cell‐free inserts were analyzed gravimetrically and the inserts containing cells were analyzed chemically by inductively coupled plasma mass spectrometry. Each bar represents the mean value of three independent experiments. Error bars represent ±SEM
Table 1.
Total amount of Ni deposited on cells during Ni nanoparticle exposures in the air–liquid interface system. The cells were analyzed chemically by inductively coupled plasma mass spectrometry. Measurements are based on the mean value of at least three independent experiments
| Ni concentration (μg cm−2) | |
|---|---|
| Mean | SEM |
| 0.05 | 0.02 |
| 0.15 | 0.01 |
| 0.32 | 0.03 |
3.3. Cellular viability reduction due to nickel nanoparticle exposure
The viability of V79 cells was analyzed by the cytotoxicity measurement (Figure 3). The results were normalized with the corresponding control values of cells treated with clean filtered air in the ALI exposure system during each Ni‐NP exposure. After 48 hours post‐exposure in ALI (in the cell incubator), the viability was reduced particularly at Ni concentrations of 0.15 and 0.32 μg cm−2 resulting in relative viability values of 45 and 46%, respectively. These results were statistically significant compared to the control. The positive control (DBPDE) induced slightly reduced cell viability (89%).
Figure 3.

Cell viability of V79 cells was assessed after 48 h exposure to Ni nanoparticles in air–liquid interface at different Ni concentrations. DBPDE (10 nm) was used as a positive control. Values were compared to each corresponding control (clean filtered air treatment in air–liquid interface). Each data point represents the mean value of two cell culture inserts in a single experiment. Error bars represent ±SEM. *statistically significant values (P < .05). CFE, colony forming efficiency
3.4. Nickel nanoparticle exposure increases DNA strand breaks
The Ni‐Np exposure significantly increased the amount DNA SBs in the presence of the BER inhibitor 4‐Ani. After 2 hours Ni‐NP exposure, the average SB amount was more than double compared to the control and significantly higher than cells only treated with the BER inhibitor (Figure 4).
Figure 4.
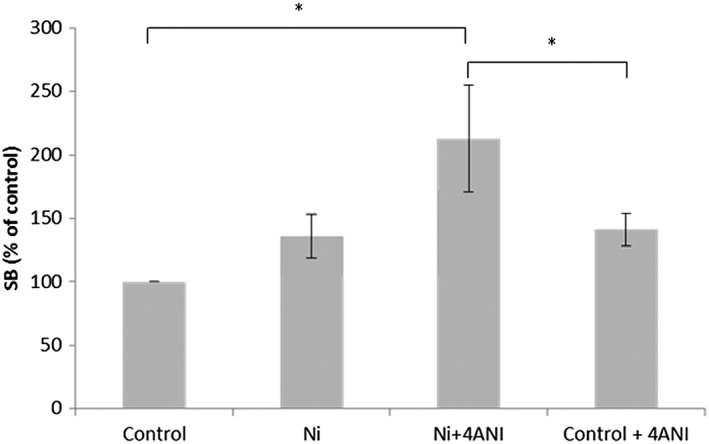
Amount of DNA SBs in V79 cells analyzed with the alkaline DNA unwinding technique after 2 h exposure to Ni nanoparticles in air–liquid interface either with or without 4ANI. The exposure concentration of Ni in this assay is estimated to be approximately between 0.3 and 0.4 μg cm−2. Each bar represents the mean value of three independent experiments. Error bars represent ±SEM. *statistically significant values (P < .05). 4ANI, 4‐amino‐1,8‐naphtalimide; SBs, strand brakes
The exposure concentration of Ni could not be directly measured in this assay, but based on exposures at the same conditions (2 hours ALI aerosol treatment), the total Ni concentration was estimated to be approximately 0.32 ± 0.03 μg cm−2 in both Ni treatments (“Ni” and “Ni 4ANI”).
3.5. Non‐mutagenic repair of nickel nanoparticle‐induced DNA lesions
The survival of mutant colonies is presented as MF per 106 surviving cells (Figure 5). MF was on average between 4 ± 1.7 and 11 ± 3.4 mutations 10−6 cells in cells exposed to Ni‐NPs at Ni concentrations of 0.05–0.32 μg cm−2. These values were lower compared to the negative control treatments, in which the MF was 15 ± 3.8 mutations per 106 cells (Figure 5). MF in the additional negative (incubator) control was 15 ± 3.5 mutations per 106 cells and thus, not significantly different from the ALI clean air controls. MF of the positive control (DBPDE) was 29 ± 0.5 mutations per 106 cells. Because both the cytotoxicity and the total number of mutated colonies affect the MF values, the absolute viability and mutation numbers, on which the MF calculations are based, are given in Table 2.
Figure 5.
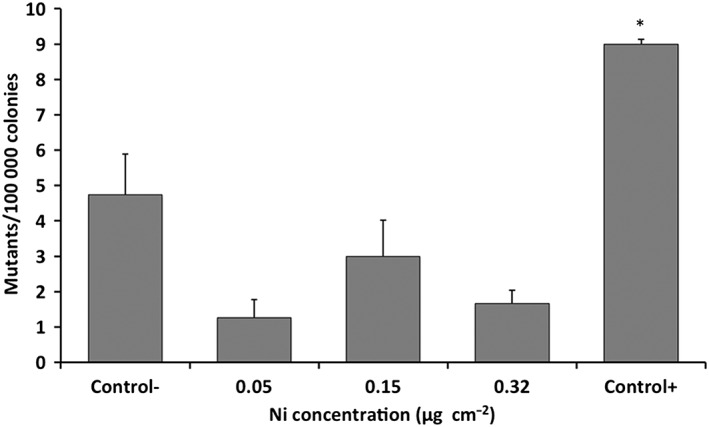
Induction of HPRT mutations in V79 cells (expressed as mutation frequency per 106 cells) after 48 h exposure to Ni nanoparticles in air–liquid interface at different Ni concentrations. DBPDE (10 nm) was used as a positive control. Clean filtered air treatment in air–liquid interface was used as a negative control. Each data point represents the mean value of two cell culture inserts in a single experiment. Error bars represent ±SEM. *statistically significant increase of mutation frequency (P < .05)
Table 2.
Absolute CFE and number of mutations for control and Ni‐NP treated as well as positive control ((±)‐anti‐11,12‐dihydroxy‐13,14‐epoxy‐11,12,13,14‐tetrahydro‐dibenzo[a,l]pyrene) cells. Average values for each Ni concentration with standard error of the mean (SEM) are given.
| Ni concentration (μg cm−2) | CFE | Number of mutations | ||
|---|---|---|---|---|
| Mean | SEM | Mean | SEM | |
| –control | 100 | 6.8 | 3 | 0.70 |
| 0.05 | 139 | 8.2 | 1 | 0.50 |
| 0.15 | 133 | 9.7 | 2 | 0.48 |
| 0.32 | 134 | 8.4 | 1 | 0.35 |
| +control | 94 | 3.64 | 4 | 0.24 |
CFE, colony forming efficiency.
4. DISCUSSION
In this study, effects on viability, genotoxicity and mutagenicity were studied for the first time following exposure of Ni‐NPs in ALI using a recently developed system. Owing to the differences of quantified Ni mass in the cell‐free and cell‐containing inserts (Figure 2). it is clear that the estimation of exposure concentrations should be based on experiments made at the same conditions as the exposures. The quantified deposition on cell‐free inserts was approximately 14–21 times higher than compared to the cell‐containing inserts. A similar observation was made in a previous study, in which the deposition of Ag‐NPs was studied in the same ALI exposure system (Latvala et al., 2016b) and in another study with Cu‐NPs (Elihn et al., 2013). The difference in deposited amount of Ni‐NP at cell‐free and cell‐containing conditions may be due to evaporation of liquid from the cell surface/medium below the cells at the cell‐containing conditions, which may prevent part of the Ni‐NP deposition. Differences due to different quantification methods (gravimetrical vs. ICP‐MS) cannot be ruled out completely, but a previous in‐depth comparison for Ag‐NPs suggests that such a difference was rather small (Latvala et al., 2016b). Therefore, to quantify the exposure concentrations as accurately as possible in this study, the total Ni mass was analyzed chemically from two cell culture inserts after each ALI treatment. These (cell‐containing) inserts were exposed during the same experiment as the two inserts that were used for the cell viability and HPRT assays. The total mass of Ni in contact with the cells was analyzed, i.e. Ni‐NP and some dissolved Ni in contact with the cells. Our previous experience suggests that the dissolved fraction of Ni is rather limited in biological media (Latvala et al., 2016a). With time, some dissolution in acidic lysosomes is likely to take place.
This study focused on investigating relatively low Ni concentrations mainly due to low doses being more relevant when considering real exposure scenarios. Furthermore, concentration‐specific effects and mechanisms may take place as previously suggested for Ni‐NPs in concentrations of 0.1–1 μg cm−2 following submerged exposure conditions (Latvala et al., 2016a). The obtained amounts of total deposited Ni were between 0.02 and 0.4 μg cm−2, when quantified with ICP‐MS from cell‐containing inserts. These concentrations are lower than previously obtained for Ag‐NPs using the same ALI exposure system, however, with a different particle generator (Latvala et al., 2016b).
In the cell viability assay, Ni concentrations of 0.15 and 0.32 μg cm−2 induced substantially decreased viability (approximately 45%) after 48 hours post‐exposure in ALI, when compared to the control. In comparison with a previous study (Latvala et al., 2016a), these results suggest that ALI exposure may result in more sensitive conditions when compared to submerged exposures, although different cell types were used.
We were also able to show that these Ni concentrations result in increased amounts of DNA damage. These DNA damages are likely repaired by BER as inhibition of this repair system significantly increased the amount of DNA lesions. Despite the increase of DNA lesions, the MF was found to decrease following the Ni exposure.
In conclusion, it was shown that the electrostatic ALI exposure system could be used for studying genotoxic effects of airborne Ni‐NPs in V79 cells. Based on this study, it can be concluded that Ni‐NP exposure induces DNA damage and affects cellular viability. Furthermore, these damages are likely repaired by BER in an error‐free way indicated by lack of mutations following the exposure. Most importantly, it is concluded that quantifying the deposited dose of airborne particles is imperative for verifying the actual exposure concentration at each experiment.
CONFLICT OF INTEREST
The authors did not report any conflict of interest.
ACKNOWLEDGEMENTS
Grants from the Swedish Research Council Formas are highly acknowledged. We gratefully thank the help from PhD Anda Gliga, PhD Ulrika Carlander and PhD Klara Midander with the operation of ICP‐MS.
Latvala S, Vare D, Karlsson HL, Elihn K. In vitro genotoxicity of airborne Ni‐NP in air–liquid interface. J Appl Toxicol. 2017;37:1420–1427. https://doi.org/10.1002/jat.3510
REFERENCES
- d'Amours, D. , Desnoyers, S. , d'Silva, I. , & Poirier, G. G. (1999). Poly(ADP‐ribosyl)ation reactions in the regulation of nuclear functions. Biochemical Journal, 342, 249–268. [PMC free article] [PubMed] [Google Scholar]
- Aguilar‐Quesada, R. , Muñoz‐Gámez, J. A. , Martín‐Oliva, D. , Peralta, A. , Valenzuela, M. T. , Matínez‐Romero, R. , … Oliver, F. J. (2007). Interaction between ATM and PARP‐1 in response to DNA damage and sensitization of ATM deficient cells through PARP inhibition. BMC Molecular Biology, 8, 1–8. [DOI] [PMC free article] [PubMed] [Google Scholar]
- Andersen, A. , Berge, S. R. , Engeland, A. , & Norseth, T. (1996). Exposure to nickel compounds and smoking in relation to incidence of lung and nasal cancer among nickel refinery workers. Occupational and Environmental Medicine, 53, 708–713. [DOI] [PMC free article] [PubMed] [Google Scholar]
- Beyersmann, D. , & Hartwig, A. (2008). Carcinogenic metal compounds: Recent insight into molecular and cellular mechanisms. Archives of Toxicology, 82, 493–512. [DOI] [PubMed] [Google Scholar]
- Chiou, Y. , Wong, R. , Chao, M. , Chen, C. , Liou, S. , & Lee, H. (2014). Nickel accumulation in lung tissues is associated with increased risk of p53 mutation in lung cancer patients. Environmental and Molecular Mutagenesis, 55, 624–632. [DOI] [PubMed] [Google Scholar]
- Efremenko, A. Y. , Campbell, J. L. Jr. , Dodd, D. E. , Oller, A. R. , & Clewell, H. J. III (2014). Time‐ and concentration‐dependent genomic responses of the rat airway to inhaled nickel subsulfide. Toxicology and Applied Pharmacology, 279, 441–454. [DOI] [PubMed] [Google Scholar]
- Elihn, K. , Cronholm, P. , Karlsson, H. L. , Midander, K. , Odnevall Wallinder, I. , & Möller, L. (2013). Cellular dose of partly soluble cu particle aerosols at the air‐liquid interface using an in vitro lung cell exposure system. Journal of Aerosol Medicine and Pulmonary Drug Delivery, 26, 84–93. [DOI] [PMC free article] [PubMed] [Google Scholar]
- Erixon, K. , & Ahnstrom, G. (1979). Single‐strand breaks in DNA during repair of UV‐induced damage in normal human and xeroderma pigmentosum cells as determined by alkaline DNA unwinding and hydroxylapatite chromatography: Effects of hydroxyurea, 5‐fluorodeoxyuridine and 1‐beta‐D‐arabinofuranosylcytosine on the kinetics of repair. Mutation Research, 59, 257–271. [DOI] [PubMed] [Google Scholar]
- Field, R. W. , & Withers, B. L. (2012). Occupational and environmental causes of lung cancer. Clinics in Chest Medicine, 33, 681–703. [DOI] [PMC free article] [PubMed] [Google Scholar]
- Ford, D. , & Yerganian, G. (1958). Observations on the chromosomes of Chinese hamster cells in tissue culture. Journal of the National Cancer Institute, 21, 393–425. [PubMed] [Google Scholar]
- Grimsrud, T. K. , Berge, S. R. , Haldorsen, T. , & Andersen, A. (2002). Exposure to different forms of nickel and risk of lung cancer. American Journal of Epidemiology, 156, 1123–1132. [DOI] [PubMed] [Google Scholar]
- Hartwig, A. (1995). Current aspects in metal genotoxicity. Biometals, 8, 3–11. [DOI] [PubMed] [Google Scholar]
- Hartwig, A. , Asmuss, M. , Ehleben, I. , Herzer, U. , Kostelac, D. , Pelzer, A. , … Bürkle, A. (2002). Interference by toxic metal ions with DNA repair processes and cell cycle control: Molecular mechanisms. Environmental Health Perspectives Supplements, 110, 797. [DOI] [PMC free article] [PubMed] [Google Scholar]
- Helleday, T. , Nilsson, R. , & Jenssen, D. (2000). Arsenic[III] and heavy metal ions induce intrachromosomal homologous recombination in the hprt gene of V79 Chinese hamster cells. Environmental and Molecular Mutagenesis, 35, 114–122. [DOI] [PubMed] [Google Scholar]
- Horton, J. K. , Stefanick, D. F. , Kedar, P. S. , & Wilson, S. H. (2007). ATR signaling mediates an S‐phase checkpoint after inhibition of poly(ADP‐ribose) polymerase activity. DNA Repair, 6, 742–750. [DOI] [PMC free article] [PubMed] [Google Scholar]
- IARC . (1990). IARC Monographs on the Evaluation of Carcinogenic risks to humans. Volume 49: Chromium, Nickel and Welding. [PMC free article] [PubMed]
- ICRP . (1994) Human Respiratory Tract Model for Radiological Protection (international commission on radiological protection) 66, Nos 1–3. [PubMed]
- Jenssen, D. (1984). A quantitative test for mutagenicity in V79 Chinese hamster cells In Kilbey B. J., Nichols W., & Ramel C. (Eds.), Handbook of Mutagenicity Test Procedures (2nd ed.) (pp. 269–290). Amsterdam: Elsevier. [Google Scholar]
- Kain, J. , Karlsson, H. L. , & Möller, L. (2012). DNA damage induced by micro‐ and nanoparticles – Interaction with FPG influences the detection of DNA oxidation in the comet assay. Mutagenesis, 27, 491–500. [DOI] [PubMed] [Google Scholar]
- Kasprzak, K. S. , Sunderman, F. W. Jr. , & Salnikow, K. (2003). Nickel carcinogenesis. Mutation Research. Fundamental and Molecular Mechanisms of Mutagenesis, 533, 67–97. [DOI] [PubMed] [Google Scholar]
- Kim, J. S. , Peters, T. M. , O'Shaughnessy, P. T. , Adamcakova‐Dodd, A. , & Thorne, P. S. (2013). Validation of an in vitro exposure system for toxicity assessment of air‐delivered nanomaterials. Toxicology In Vitro, 27, 164–173. [DOI] [PMC free article] [PubMed] [Google Scholar]
- Lagerqvist, A. , Håkansson, D. , Prochazka, G. , Lundin, C. , Dreij, K. , Segerbäck, D. , … Jenssen, D. (2008). Both replication bypass fidelity and repair efficiency influence the yield of mutations per target dose in intact mammalian cells induced by benzo[a]pyrene‐diol‐epoxide and dibenzo[a,l]pyrene‐diol‐epoxide. DNA Repair, 7, 1202–1212. [DOI] [PubMed] [Google Scholar]
- Latvala, S. , Hedberg, J. , Di Bucchianico, S. , Möller, L. , Odnevall Wallinder, I. , Elihn, K. , & Karlsson, H. L. (2016a). Nickel release, ROS generation and toxicity of Ni and NiO micro‐ and nanoparticles. PloS One, 11. e0159684 [DOI] [PMC free article] [PubMed] [Google Scholar]
- Latvala, S. , Hedberg, J. , Möller, L. , Odnevall Wallinder, I. , Karlsson, H. L. , & Elihn, K. (2016b). Optimization of an air–liquid interface exposure system for assessing toxicity of airborne nanoparticles. Journal of Applied Toxicology, 36, 1294–1301. [DOI] [PMC free article] [PubMed] [Google Scholar]
- Lenz, A. G. , Karg, E. , Lentner, B. , Dittrich, V. , Brandenberger, C. , Rothen‐Rutishauser, B. , … Schmid, O. (2009). A dose‐controlled system for air‐liquid interface cell exposure and application to zinc oxide nanoparticles. Particle and Fibre Toxicology, 6, 32–48. [DOI] [PMC free article] [PubMed] [Google Scholar]
- de Murcia, J. M. , Niedergang, C. , Trucco, C. , Ricoul, M. , Dutrillaux, B. , Mark, M. , … de Murcia, G. (1997). Requirement of poly(ADP‐ribose) polymerase in recovery from DNA damage in mice and in cells. Proceedings of the National Academy of Sciences USA, 94, 7303–7307. [DOI] [PMC free article] [PubMed] [Google Scholar]
- Nestmann, E. R. , Brillinger, R. L. , Gilman, J. P. W. , Rudd, C. J. , & Swierenga, S. H. H. (1991). Recommended protocols based on a survey of current practice in genotoxicity testing laboratories: II mutation in Chinese hamster ovary, V79 Chinese hamster lung and L5178Y mouse lymphoma cells. Mutation Research. Fundamental and Molecular Mechanisms of Mutagenesis, 246, 255–284. [DOI] [PubMed] [Google Scholar]
- NTP (1996). NTP toxicology and carcinogenesis studies of nickel oxide (CAS no. 1313‐99‐1) in F344 rats and B6C3F1 mice (inhalation studies). National Toxicology Program Technical Report Series, 451, 1–381. [PubMed] [Google Scholar]
- Paur, H. , Cassee, F. R. , Teeguarden, J. , Fissan, H. , Diabate, S. , Aufderheide, M. , … Schmid, O. (2011). In‐vitro cell exposure studies for the assessment of nanoparticle toxicity in the lung – A dialog between aerosol science and biology. Journal Aerosol Science, 42, 668–692. [Google Scholar]
- Satoh, M. S. , & Lindahl, T. (1992). Role of poly(ADP‐ribose) formation in DNA repair. Nature, 356, 356–358. [DOI] [PubMed] [Google Scholar]
- Savi, M. , Kalberer, M. , Lang, D. , Ryser, M. , Fierz, M. , Gaschen, A. , … Geiser, M. (2008). A novel exposure system for the efficient and controlled deposition of aerosol particles onto cell cultures. Environmental Science & Technology, 42, 5667–5674. [DOI] [PubMed] [Google Scholar]
- Schwyn, S. , Garwin, E. , & Schmidt‐Ott, A. (1988). Aerosol generation by spark discharge. Journal of Aerosol Science, 19, 639–642. [Google Scholar]
- Vare, D. , Johansson, F. , Persson, J. , Erixon, K. , & Jenssen, D. (2014). Quantification and repair of psoralen‐induced interstrand crosslinks in human cells. Toxicology Letters, 226, 343–350. [DOI] [PubMed] [Google Scholar]