

Nivolumab is a fully human immunoglobulin‐G4 monoclonal antibody that selectively binds to the programmed death‐1 (PD‐1) membrane receptor, blocking the interaction of PD‐1 with its 2 known ligands, PD‐L1 and PD‐L2.1 Blockade of PD‐1 is believed to promote antitumor immune responses by preventing downregulation of T‐cell activation and proliferation within the tumor microenvironment.1 Nivolumab has demonstrated clinical activity as monotherapy or in combination with ipilimumab (anti–cytotoxic T‐lymphocyte antigen 4 [anti‐CTLA‐4]) in several tumor types, including melanoma,2, 3 non–small cell lung cancer (NSCLC),4, 5, 6 and renal cell carcinoma (RCC).7, 8 In addition, nivolumab monotherapy is shown to be well tolerated up to a dose of 10 mg/kg in patients with solid tumors.9 Nivolumab 240 mg every 2 weeks is approved for the treatment of patients with unresectable or metastatic melanoma, previously treated metastatic NSCLC, advanced RCC, and urothelial cancer, and 3 mg/kg every 2 weeks is approved for classical Hodgkin lymphoma and recurrent or metastatic squamous cell carcinoma of the head and neck.10 Nivolumab 1 mg/kg in combination with ipilimumab every 3 weeks for 4 doses followed by nivolumab 240 mg every 2 weeks is also approved for the treatment of unresectable or metastatic melanoma.10 Durable responses, overall survival benefit, and improved progression‐free survival have been documented in patients with previously untreated melanoma who received nivolumab.2
The pharmacokinetics (PK) of nivolumab have been previously characterized and described by a linear 2‐compartment model with time‐varying clearance (CL).11 The PK of nivolumab has been found to be linear in the range of 0.1 to 10 mg/kg, and both elimination and distribution of nivolumab appeared to be independent of dose in the dose range studied.12 The end of infusion and minimum serum concentration (Cmin) after the first dose were approximately dose‐proportional. Exposure‐response (E‐R) of efficacy and safety has been characterized in previously treated patients with advanced melanoma receiving nivolumab 3 mg/kg (studies CA209003 and CA209037).13 The purpose of the current study was to extend the earlier characterization of nivolumab E‐R of overall survival to patients with previously untreated advanced melanoma. In previous E‐R analyses,13 nivolumab exposure (time averaged concentration after first dose [Cavg1]) was not a significant predictor of Response Evaluation Criteria In Solid Tumors v1.1 objective response or overall survival over the exposure range tested, and higher baseline tumor burden in melanoma was associated with a lower probability of response. The E‐R safety analysis found that nivolumab exposure (Cavg1) was not a significant predictor of the risk of grade ≥3 drug‐related adverse events and adverse events leading to drug discontinuation or death.
Methods
The analysis population consisted of previously treated and untreated patients with advanced melanoma in the following studies who had been treated with nivolumab, and for whom nivolumab serum concentration data were available: CA209003 (a phase 1 dose‐escalation study in patients with solid tumors; only data from the melanoma patients were included), CA209037 (an open‐label phase 3 study in which patients with melanoma were randomized to receive either nivolumab 3 mg/kg every 2 weeks or the investigator's choice of an alternative regimen), and CA209066 (a phase 3 randomized, double‐blind study of B nivolumab vs dacarbazine in patients with previously untreated advanced melanoma). The nominal nivolumab doses in patients from CA209003 were 0.1, 0.3, 1, 3, and 10 mg/kg every 2 weeks, whereas the nominal dose in patients from CA209037 and CA209066 was 3 mg/kg every 2 weeks. A description of these studies is also presented in Table S1.
Nivolumab serum samples were analyzed by validated bioanalytical assays: a ligand‐binding enzyme‐linked immunosorbent assay (ELISA) or an electrochemiluminescence (ECL) assay. The lower limit of quantification of the ELISA and ECL assays were 1.2 and 0.2 μg/mL, respectively, well below the trough concentration values produced by a dosing regimen of nivolumab 3 mg/kg every 2 weeks, which was assessed in the phase 3 studies.
Nivolumab exposure in these patients was determined by applying a previously developed population PK (PPK) model to the available nivolumab serum concentration data.11 The PPK model was a linear 2‐compartment, zero‐order intravenous infusion and first‐order elimination with time‐varying CL.11 The model also included a proportional residual error model, with random effect on CL, volume of distribution of the central compartment (VC), volume of distribution of the peripheral compartment, and correlation of the random effect between CL and VC. It contained baseline body weight (BW), baseline estimated glomerular filtration rate, sex, race, and baseline performance status effects on CL, and baseline BW and sex effects on VC.
The measure of nivolumab exposure used in the E‐R analysis was Cavg1 (time‐averaged nivolumab concentration after first dose), the same as in the previous E‐R analysis of overall survival in patients with previously treated melanoma.13 In the analysis population, Cavg1 values for each patient were determined from the maximum a posteriori Bayesian estimates of individual PK parameters obtained from the previously developed final PPK model.11 Cavg1 values were determined for the nominal nivolumab dosing regimen in each patient and were calculated by dividing the area under the concentration–time curve after the first dose with the nominal dosing interval (14 days for dosing every 2 weeks).
The E‐R relationship was characterized by a semiparametric Cox proportional hazards model that described the relationship between Cavg1 and the hazard of death, adjusting for the effect of covariates on the hazard. As the method is well established,14 only the essential components of the models are described.
The hazard function is expressed as λ(t) = λ 0(t) exp(βTxi), where λ 0(t) is the baseline hazard function and xi is a vector of predictor variables. The parameter vector β was estimated by maximum partial likelihood. The Cox proportional hazards model was developed in 2 stages. First, the relationship between nivolumab exposure and overall survival was characterized using a base Cox proportional hazards model that characterized the relationship of only Cavg1 on overall survival, without consideration of the potentially modulatory effect of covariate predictor variables on the E‐R relationship. Other summary measures of nivolumab exposure were highly correlated with Cavg1 (R > 0.83 for correlations between Cavg1 and Cavgss or Cmin1) and were therefore expected to have a similar E‐R relationship.
In the second stage, a full covariate model was developed by simultaneously incorporating all predictive variables of interest in the base Cox proportional hazards model developed from the first step. All inferences related to the effect of covariates, including effect of exposure on overall survival, were made based on the full model, as it is well established that this approach provides unbiased estimates of the effect of predictors (exposure and covariates) relative to estimates from a reduced model.15, 16, 17 The full model included the following covariate effects: prior treatment, prior anti‐CTLA‐4 treatment, sex, Eastern Cooperative Oncology Group (ECOG) status, BW, Cavg1, baseline nivolumab CL, age, baseline tumor size, and baseline lactate dehydrogenase (LDH) level. Baseline CL was included as a predictor in the Cox proportional hazards model in addition to Cavg1, as the CL of monoclonal antibodies has been reported to be associated with disease severity.11, 13 Baseline LDH level was log‐transformed, as the values of this covariate were right‐skewed.
In addition, sensitivity analyses were performed to assess the impact of excluding baseline CL from the full model and to assess the effect of BRAF mutation status, M stage, and PD‐L1 status (by Dako‐verified assay18) by adding these variables to those in the full model. These predictor variables were not included in the full model because data were not available for all studies included in the analysis. BRAF status and M stage values were not available from study CA209003; PD‐L1 status of patients in CA209003 was analyzed using an earlier assay to the PD‐L1 status in samples from CA209037 and CA209066.
The full model was evaluated by comparing the model‐predicted cumulative time‐to‐event distributions (from 1000 simulations) for overall survival with the corresponding distribution determined by nonparametric Kaplan‐Meier analysis.
Analyses were performed on an AMD‐based multicore CPU server running Red Hat Enterprise Linux 5.3. The PPK analysis was performed using the NONMEM computer program (version 7.3; ICON Development Solutions, Hanover, Maryland) compiled using Intel Fortran, and diagnostic plots were prepared using S‐PLUS software (version 8.0; TIBCO Software, Palo Alto, California) or using R (version 3.0.2).
Results
The analysis population consisted of 399 patients for whom estimates of maximum a posteriori Bayesian estimates of PK parameters were available: 106 patients from CA209003, 115 patients from CA209037, and 178 patients from CA209066. Fewer than 5% of nivolumab‐treated patients in CA209003 and CA209037 and 14% of patients in CA209066 were excluded from the analysis because of lack of serum concentration data. A summary of baseline covariates of the 399 patients included in the E‐R analysis is shown in Table 1. Nivolumab exposure after the first dose (Cavg1) in patients treated with 3 mg/kg every 2 weeks was similar in previously treated patients (studies CA209003 and CA209037) and untreated patients (study CA209066) with advanced melanoma (Figure S1).
Table 1.
Summary of Baseline Covariates of Patients Included in the Exposure–Response Analysis
| Characteristic | N = 399 |
|---|---|
| Sex, n (%) | |
| Male | 251 (62.9) |
| Female | 148 (37.1) |
| Age (years), mean (SD) | 60.3 (13.1) |
| Body weight, mean (SD) | 79.8 (17.1) |
| Baseline clearance (mL/h), mean (SD) | 11.6 (5.1) |
| Average concentration after first dose (μg/mL), mean (SD) | 27.6 (17.3) |
| M stage, n (%) | |
| M0, M1a, or M1b | 92 (23.1) |
| M1c | 201 (50.4) |
| Missing | 106 (26.6) |
| Previous therapy, n (%) | |
| Yes | 221 (55.4) |
| No | 178 (44.6) |
| ECOG status, n (%) | |
| 0 | 261 (65.4) |
| ≥1 | 138 (34.6) |
| LDH, × ULN, mean (SD) | 1.31 (1.28) |
| PD‐L1 expression, n (%) | |
| ≥5% | 137 (34.3) |
| <5% | 262 (65.7) |
| Prior anti‐CTLA‐4 treatment, n (%) | |
| Yes | 115 (28.8) |
| No | 284 (71.2) |
| Prior benefit from anti‐CTLA‐4, n (%) | |
| Yes | 42 (10.5) |
| No | 251 (62.9) |
| Unknown | 106 (26.6) |
| BRAF status, n (%) | |
| Mutant | 24 (6.0) |
| Wild type | 269 (67.4) |
| Unknown | 106 (26.6) |
| Nominal dose (mg/kg), n (%) | |
| 0.1 | 17 (4.3) |
| 0.3 | 18 (4.5) |
| 1.0 | 35 (8.8) |
| 3.0 | 309 (77.4) |
| 10.0 | 20 (5.0) |
Anti‐CTLA‐4, anti–cytotoxic T‐lymphocyte antigen 4; ECOG, Eastern Cooperative Oncology Group; LDH, lactate dehydrogenase; PD‐L1, programmed death ligand 1; SD, standard deviation; ULN, upper limit of normal.
The base model incorporated the effect of Cavg1 on the hazard as a linear function, but the effect was not statistically significant (95% confidence interval included 1; data not shown). Furthermore, Cavg1 was also not a significant predictor of the hazard of death in the full model, which incorporated all other predictors (Figure 1a). In contrast, ECOG status, baseline BW, nivolumab CL, age, and baseline LDH had a significant effect on overall survival, with the greatest magnitude of effect being associated with CL. No other predictor variables evaluated demonstrated a significant effect on overall survival, including prior treatment with anti‐CTLA‐4 or other therapies. The correlations between parameter estimates of the covariates in the model were well below 0.5, indicating that the model was not overparameterized, and that the effects of both CL and Cavg1 could be estimated together. The highest correlation was between the parameter estimates for prior treatment and prior anti‐CTLA‐4 treatment (r = −0.475), and the correlation between parameter estimates of CL and Cavg1 was 0.237.
Figure 1.
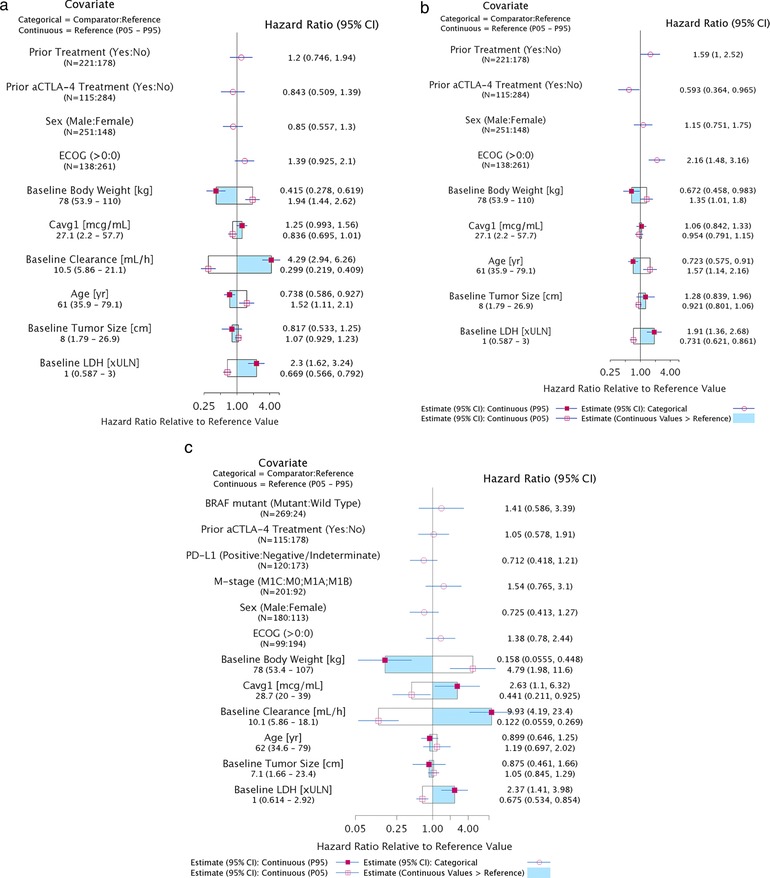
Estimated effects of predictor variables (Cavg1 and covariates) on the hazard ratio of overall survival. (a) Full Model: All predictor variables. (b) Sensitivity Analysis: All predictor variables excluding nivolumab CL. (c) Sensitivity Analysis: Effect of selected predictors on overall survival in patients from CA209037 and CA209066. The graph describes the effect of each covariate on the hazard ratio of overall survival relative to a subject with reference values of covariates. The hazard ratio for categorical covariates compared with the reference is described by red circles with 95% confidence interval. For continuous variables the hazard ratio at the 5th and 95th percentiles (P05–P95) are shown relative to the reference values. The shaded region of the box shows the estimate of the hazard ratio relative to the reference value when values of the continuous covariate are greater than the reference. aCTLA‐4, anti–cytotoxic T‐lymphocyte antigen 4; Cavg1, average plasma drug concentration; CI, confidence interval; ECOG, Eastern Cooperative Oncology Group; LDH, lactate dehydrogenase; PD‐L1, programmed death ligand 1; ULN, upper limit of normal.
The sensitivity analysis performed by excluding baseline CL from the full model found that Cavg1 was not a significant predictor of overall survival, even without CL (Figure 1b). Notably, the effect of ECOG was higher in this analysis, suggesting that the effect of CL is associated with disease severity.
In another sensitivity analysis, the effect of M stage, PD‐L1 status, BRAF mutation status, and benefit from prior anti‐CTLA‐4 therapy on overall survival in patients with melanoma were evaluated from studies CA209037 and CA209066, as those data were available from only these studies. This analysis demonstrated that none of these covariates were significant predictors of overall survival (Figure 1c). However, there was a trend for higher overall survival in patients with PD‐L1 expression ≥5% compared with patients with <5% PD‐L1 expression and lower overall survival in patients with M1c stage disease compared with patients with M0, M1a, or M1b stage disease. The CL effect on overall survival was consistent with early findings.12
Evaluation of the full model using visual predictive checks showed that the model‐predicted mean (90% prediction interval) of overall survival was consistent with the observed Kaplan‐Meier curve of overall survival (Figure 2a), for each study (Figure 2b), and at different nivolumab doses (Figure 2c). The Kaplan‐Meier curves were consistent with the Cox proportional hazards model predictions, indicating an adequate model performance.
Figure 2.
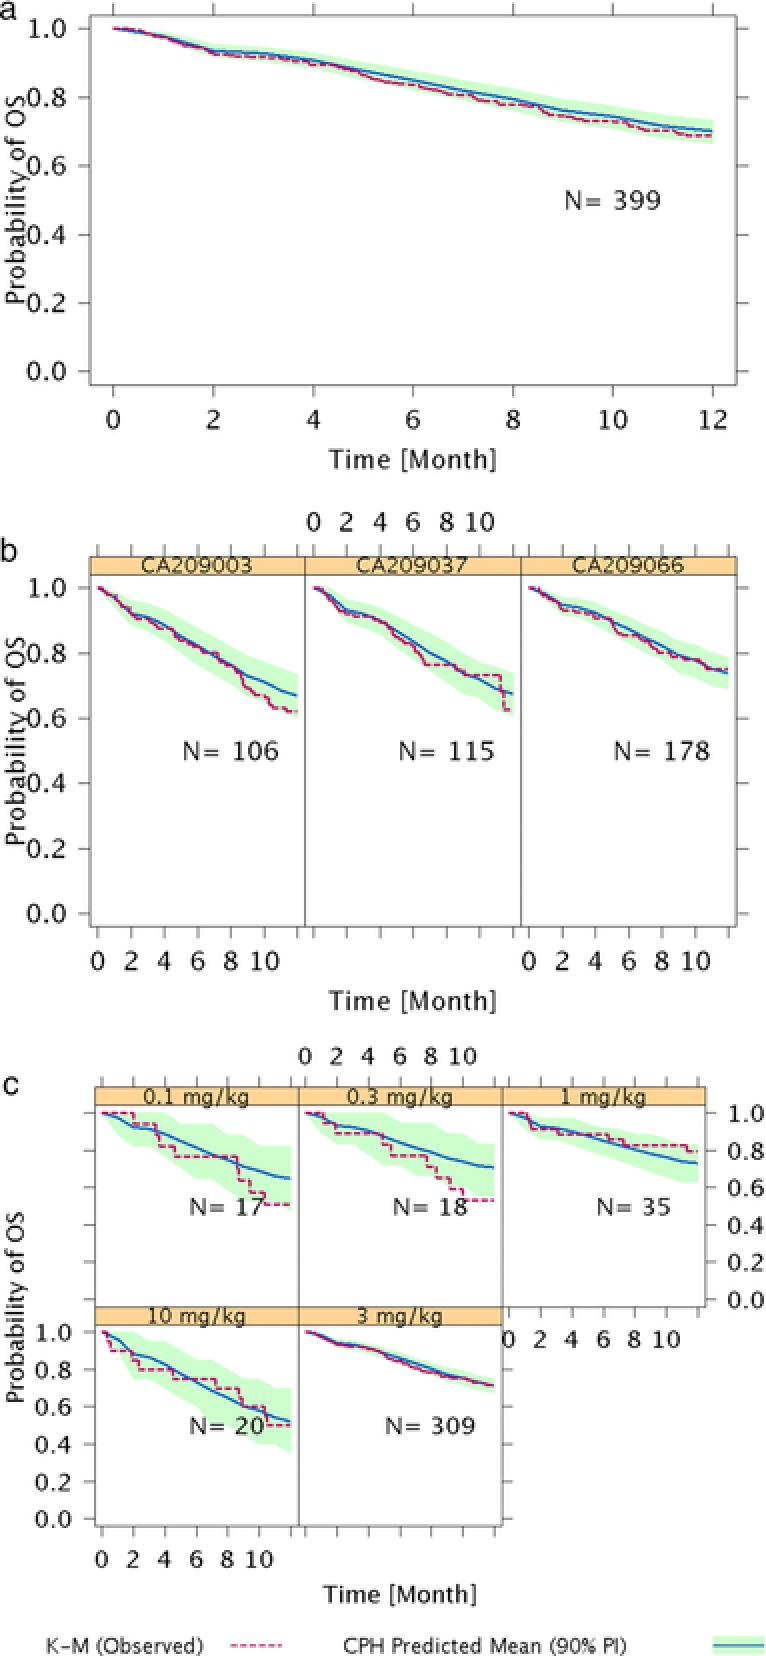
Model evaluation of exposure–response analysis of overall survival in (a) overall population, (b) each study, and (c) at different doses of nivolumab. CPH, Cox proportional‐hazards; K‐M, Kaplan‐Meier; OS, overall survival; PI, prediction interval.
This E‐R model was applied to support a change in the recommended dose of nivolumab in the United States from the initially approved body weight–normalized dose of 3 mg/kg every 2 weeks to a flat dose of 240 mg every 2 weeks.19, 20 The initial approved dose of 3 mg/kg every 2 weeks was used in phase 3 studies (CA209037 and CA209066) in patients with advanced melanoma. A flat dose of 240 mg every 2 weeks was proposed for convenience, and to reduce the possibility of dose calculation errors, such that the predicted exposures from this dose were similar to that of 3 mg/kg every 2 weeks. The potential impact on efficacy of this posology change was further assessed by comparing the predicted overall survival with 240 mg every 2 weeks and 3 mg/kg every 2 weeks.20 The model‐predicted curves produced with a body‐weight–based dose of nivolumab 3 mg/kg every 2 weeks in clinical studies were consistent with the Cox proportional hazards model predictions using a flat dose of 240 mg every 2 weeks, indicating a similar efficacy and supporting this posology change (Figure S2a). In addition, the magnitude of the hazard ratio at the 5th and 95th percentiles of nivolumab Cavg1 for the dose of 3 mg/kg every 2 weeks was similar to the hazard ratio at the corresponding percentiles of nivolumab Cavg1 for the dose of 240 mg every 2 weeks, both with respect to the median Cavg1 of the 3 mg/kg dosing regimen (Figure S2b). These data indicate that the impact on efficacy with nivolumab 240 mg every 2 weeks will be minimal compared with nivolumab 3 mg/kg every 2 weeks. Based on these and other analyses, nivolumab 240 mg every 2 weeks was approved for advanced melanoma, NSCLC, and RCC without an independent clinical study.19
Discussion
Like the anti‐CTLA‐4 antibody ipilimumab, nivolumab (an anti‐PD‐1) is an immune checkpoint inhibitor, a class of cancer immunotherapy indicated in patients with solid tumors. Based on data from the phase 3 CA209037 trial,21 nivolumab was one of the first immuno‐oncology drugs to be approved in patients with advanced melanoma who had disease progression after anti‐CTLA‐4 therapy. Nivolumab monotherapy has also been tested in a phase 3 trial of patients with previously untreated melanoma without BRAF mutation (CA209066).2 The purpose of this analysis was to support the clinical pharmacology profiling of nivolumab in both previously treated and untreated patients with advanced melanoma by characterizing the relationship between nivolumab exposure and clinical efficacy (overall survival). This analysis was done to extend the earlier‐characterized E‐R efficacy relationship in patients with melanoma to patients with previously untreated melanoma. The nivolumab CL and exposures in previously treated and untreated melanoma populations were similar (Figure S1), and therefore the final model from previous analyses was used to predict the exposures in patients with previously treated and untreated advanced melanoma. In this analysis, the PPK model‐predicted Cavg1 was selected as the measure of overall nivolumab exposure. Because Cavg1 was highly correlated with other exposure measures (data not shown), it was expected to have an E‐R relationship similar to other exposure measures. Cavg1 was chosen as the exposure measure based on the nivolumab PK, which is described by a PPK model that shows the CL of nivolumab changes with time. This change in nivolumab CL is likely because of the change in disease state of the patients after treatment.22 Therefore, an early measure of exposure would be conservative, as it may avoid any confounding effect of exposure and response.13, 22 In addition, Cavg1 is available in all patients who received nivolumab treatment and would be a better metric of exposure considering that patients in oncology trials may opt out of the study or have lower survival.
According to the E‐R analysis, nivolumab Cavg1 was not a significant predictor of overall survival in patients with advanced melanoma after accounting for the effect of other potential predictors of overall survival. Relative to patients with a median Cavg1 (27.1 μg/mL), patients at the 5th percentile (2.2 μg/mL) had an overall survival hazard ratio of 0.839, and patients at the 95th percentile (57.7 μg/mL) had an overall survival hazard ratio of 1.25. Considering that the magnitude of the effect of Cavg1 on overall survival is small, the opposing directions of the relationship between Cavg1 and overall survival indicating higher hazard in patients with relatively higher exposure may be because of unidentified factors not included in the analysis. This might also suggest that higher nivolumab exposures are not expected to improve overall survival in patients with advanced melanoma (ie, the E‐R efficacy relationship is flat over the range of exposures achieved in these patients). This result is consistent with the E‐R efficacy relationship seen in previous analyses of previously treated patients with melanoma.13
Nivolumab baseline CL, baseline LDH, baseline BW, ECOG status, and age were significant predictors of overall survival, with nivolumab CL as the strongest predictor. Nivolumab CL in patients decreases over time and is believed to be associated with change in the disease state of the patients.22 We chose to use baseline CL as a covariate reflecting the baseline disease state of patients in E‐R analyses, as incorporation of time‐varying CL (or Cavg) as a predictor in the model bears the risk of confounding the interpretation of the effect of CL on response. The selection of Cavg1 as a measure of exposure for the nivolumab E‐R analysis of efficacy was justified in a recent article in which the authors compared both Cavg1 and average concentration from initiation of treatment with the time of event or dropout.13, 22 The effect of Cavg1 was not likely to be confounded by the effect of CL in this analysis because Cavg1 values are from a range of doses (0.1–10 mg/kg). Furthermore, a sensitivity analysis excluding the effect of CL from the model confirmed that Cavg1 was not a significant predictor of overall survival. Baseline LDH and ECOG status, which are markers of disease state, were found to have a significant effect on overall survival. The effect of ECOG status was found to be pronounced in this sensitivity analysis, which may be because of nivolumab CL reflecting patient disease state, and its effect has been potentially redistributed among other predictors that are indicative of disease state. This finding is in line with previous results in which the CL of nivolumab was thought to be a surrogate for disease state.23 Elevated baseline LDH levels have been reported to be associated with poor prognosis in patients with melanoma and other solid tumors.24, 25 LDH is upregulated in most cancer cells, as cancer cells generally have a higher energy demand than do normal cells and therefore supplement energy production by converting glucose to lactate via the glycolysis pathway (known as the Warburg effect).26 Therefore, a higher level of serum LDH is indicative of more aggressive tumors with higher energy demand. M stage, BRAF mutation status, and PD‐L1 status were not significant predictors of overall survival in the melanoma trials for which these values were available (CA209037 and CA209066). In this sensitivity analyses, which included data from CA209037 and CA209066, although baseline LDH was the only significant predictor in this analysis, there were trends for PD‐L1 expression, M stage, and ECOG status in similar directions, as observed in previous analyses. These nonsignificant findings may be because of the smaller sample size of this data set and treatment with only nivolumab 3 mg/kg. Future analyses across broader groups may clarify these results.
Conclusions
Nivolumab Cavg1 was not a significant predictor of overall survival in patients with advanced melanoma, suggesting that the efficacy of nivolumab is similar over the range of exposure produced by doses of 0.1 to 10 mg/kg every 2 weeks. Nivolumab CL, baseline LDH, baseline BW, ECOG status, and age were significant predictors of overall survival, whereas BRAF mutation status, M stage, and PD‐L1 expression were not.
Supporting information
Figure S1
Figure S2
Figure S3
Table S1. Summary of Clinical Studies Included in Exposure–Response Analyses
Acknowledgments
We thank Erin Dombrowsky and Prema Sukumar at Bristol‐Myers Squibb for dataset preparation, Dako for collaborative development of the PD‐L1 IHC 28‐8 pharmDx assay used in the original studies. Professional medical writing and editorial assistance were provided by Zenab Amin, PhD, Kakoli Parai, PhD, and Cara Hunsberger at StemScientific, an Ashfield Company, funded by Bristol‐Myers Squibb.
Funding
This work was supported by Bristol‐Myers Squibb.
Declaration of Conflicting Interests
All authors are employees of Bristol‐Myers Squibb, which funded the study.
Fellow of the American College of Clinical Pharmacology: Manish Gupta.
References
- 1. Wang C, Thudium KB, Han M, et al. In vitro characterization of the anti‐PD‐1 antibody nivolumab, BMS‐936558, and in vivo toxicology in non‐human primates. Cancer Immunol Res. 2014;2:846–856. [DOI] [PubMed] [Google Scholar]
- 2. Robert C, Long GV, Brady B, et al. Nivolumab in previously untreated melanoma without BRAF mutation. N Engl J Med. 2015;372:320–330. [DOI] [PubMed] [Google Scholar]
- 3. Larkin J, Chiarion‐Sileni V, Gonzalez R, et al. Combined nivolumab and ipilimumab or monotherapy in untreated melanoma. N Engl J Med. 2015;373:23–34. [DOI] [PMC free article] [PubMed] [Google Scholar]
- 4. Brahmer J, Reckamp KL, Baas P, et al. Nivolumab versus docetaxel in advanced squamous‐cell non‐small‐cell lung cancer. N Engl J Med. 2015;373:123–135. [DOI] [PMC free article] [PubMed] [Google Scholar]
- 5. Borghaei H, Paz‐Ares L, Horn L, et al. Nivolumab versus docetaxel in advanced nonsquamous non‐small‐cell lung cancer. N Engl J Med. 2015;373:1627–1639. [DOI] [PMC free article] [PubMed] [Google Scholar]
- 6. Hellmann MD, Rizvi NA, Goldman JW, et al. Nivolumab plus ipilimumab as first‐line treatment for advanced non‐small‐cell lung cancer (CheckMate 012): results of an open‐label, phase 1, multicohort study. Lancet Oncol. 2017;18:31–41. [DOI] [PMC free article] [PubMed] [Google Scholar]
- 7. Motzer RJ, Escudier B, McDermott DF, et al. Nivolumab versus everolimus in advanced renal‐cell carcinoma. N Engl J Med. 2015;373:1803–1813. [DOI] [PMC free article] [PubMed] [Google Scholar]
- 8. Hammers HJ, Plimack ER, Infante JR, et al. Expanded cohort results from CheckMate 016: a phase 1 study of nivolumab in combination with ipilimumab in metastatic renal cell carcinoma Presented at American Society of Clinical Oncology Annual Meeting; May 29–June 2, 2015. Abstract 4516. http://ascopubs.org/doi/abs/10.1200/jco.2015.33.15_suppl.4516
- 9. Topalian SL, Hodi FS, Brahmer JR, et al. Safety, activity, and immune correlates of anti‐PD‐1 antibody in cancer. N Engl J Med. 2012;366:2443–2454. [DOI] [PMC free article] [PubMed] [Google Scholar]
- 10. OPDIVO (nivolumab) [US package insert] . Princeton, NJ: Bristol‐Myers Squibb; April 2017. [Google Scholar]
- 11. Bajaj G, Wang X, Agrawal S, Gupta M, Roy A, Feng Y. Model‐based population pharmacokinetic analysis of nivolumab in patients with solid tumors. CPT Pharmacometrics Syst Pharmacol. 2017;6:58–66. [DOI] [PMC free article] [PubMed] [Google Scholar]
- 12. Feng Y, Bajaj G, Wang X, et al. Model‐based analysis of nivolumab to support clinical pharmacology profiling in subjects with solid tumors (abstract). Clin Pharmacol Ther. 2015;97:S41. [Google Scholar]
- 13. Wang X, Feng Y, Bajaj G, et al. Quantitative characterization of the exposure‐response relationship for cancer immunotherapy: a case study of nivolumab in patients with advanced melanoma. CPT Pharmacometrics Syst Pharmacol. 2017;6:40–48. [DOI] [PMC free article] [PubMed] [Google Scholar]
- 14. Cox DR, Oakes D. Analysis of Survival Data. London, New York: Chapman and Hall; 1984. [Google Scholar]
- 15. Gastonguay MR. A full model estimation approach for covariate effects: inference based on clinical importance and estimation precision. AAPS J. 2004;6:abstract W4354. [Google Scholar]
- 16. Harrell FE Jr, Lee KL, Mark DB. Multivariable prognostic models: issues in developing models, evaluating assumptions and adequacy, and measuring and reducing errors. Stat Med. 1996;15:361–387. [DOI] [PubMed] [Google Scholar]
- 17. Harrell FE. Regression Modeling Strategies. New York: Springer‐Verlag; 2001. [Google Scholar]
- 18. Jorgensen JT. Companion diagnostic assays for PD‐1/PD‐L1 checkpoint inhibitors in NSCLC. Expert Rev Mol Diagn. 2016;16:131–133. [DOI] [PubMed] [Google Scholar]
- 19. US Food & Drug Administration . Modification of the dosage regimen for nivolumab. 2016. https://www.fda.gov/Drugs/InformationOnDrugs/ApprovedDrugs/ucm520871.htm
- 20. Zhao X, Suryawanshi S, Hruska M, et al. Assessment of nivolumab benefit‐risk profile of a 240‐mg flat dose relative to a 3‐mg/kg dosing regimen in patients with advanced tumors. Ann Oncol. 2017, https://doi.org/10.1093/annonc/mdx235. [DOI] [PMC free article] [PubMed] [Google Scholar]
- 21. Weber JS, D'Angelo SP, Minor D, et al. Nivolumab versus chemotherapy in patients with advanced melanoma who progressed after anti‐CTLA‐4 treatment (CheckMate 037): a randomised, controlled, open‐label, phase 3 trial. Lancet Oncol. 2015;16:375–384. [DOI] [PubMed] [Google Scholar]
- 22. Liu C, Yu J, Li H, et al. Association of time‐varying clearance of nivolumab with disease dynamics and its implications on exposure response analysis [published online ahead of print 2017]. Clin Pharmacol Ther. 2017;101:657–666. [DOI] [PubMed] [Google Scholar]
- 23. Feng Y, Agrawal S, Gupta M, Gupta AK, Masson E, Roy A. Association between immune‐checkpoint inhibitor induced tumor shrinkage and overall survival in advanced melanoma and NSCLC. J Clin Oncol. 2014;32. Abstract 3053. [Google Scholar]
- 24. Feng Y, Roy A, Masson E, Chen TT, Humphrey R, Weber J. Exposure‐response relationships of the efficacy and safety of ipilimumab in patients with advanced melanoma. Clin Cancer Res. 2013;19:3977–3986. [DOI] [PubMed] [Google Scholar]
- 25. Zhang J, Yao YH, Li BG, Yang Q, Zhang PY, Wang HT. Prognostic value of pretreatment serum lactate dehydrogenase level in patients with solid tumors: a systematic review and meta‐analysis. Sci Rep. 2015;5:9800. [DOI] [PMC free article] [PubMed] [Google Scholar]
- 26. Warburg O. On the origin of cancer cells. Science. 1956;123:309–314. [DOI] [PubMed] [Google Scholar]
Associated Data
This section collects any data citations, data availability statements, or supplementary materials included in this article.
Supplementary Materials
Figure S1
Figure S2
Figure S3
Table S1. Summary of Clinical Studies Included in Exposure–Response Analyses